Abstract
“Buy the dip” is the frequently trending phrase on Twitter. A successful “buy the dip” strategy can lead to overnight success. However, the problem lies in when to do so.
This article tries to illustrate market player behaviors that have historically taken place during market bottoms. The market behaviors are associated with retail psychology, stablecoin purchasing power, coin days destroyed and the relative fair value with regard to realized price. This analysis might give readers a general understanding as to the current state of the market how the market will react in the coming future.
The shrimp indicators combined with stablecoin supply ratio, CVDD and realized will give readers a historical reference on relative market bottoms and compare such situations with the current market.
1. Current state of the market
Eight months have passed since the Bitcoin All-Time-High (ATH) in November 2021, and the crypto market has been pessimistic after some CeFi liquidity crises incidents alongside a bearish macroeconomic environment. Last month, The Federal Reserve increased the funds rate by 75bps to 1.5% - 1.75%, a move aimed at bringing down the inflation rate. This increment further depressed the stock market as well as the crypto market.
The bear market may be painful, but it also introduces opportunities. It is a place where attractive investing opportunities are created. However, finding the market bottom is impossible because the last point of supply and the entry of demand are not in our hands. It is impossible to predict the future. Only the one who takes the market orders will know the next price movement.
However, there are helpful tools to aid in looking for potential market bottom formation so traders can apply dollar cost average to attain more favourable entry positions. This article introduces several helpful indicators for evaluating market bottom formation and discusses market psychology during market bottoms. This article aims to help develop skills to identify potential bottom formation conditions, so decisions can be made at different market cycle positions.
2. Shrimp index – the bottom finder
The explanation of the Shrimp index begins with analyzing how the market works. In trading markets like Tradfi and DeFi, the money weak hands lose transfers to the strong hands. There is a continuous buying and selling behavior between groups of market players that constitute the market. This basically means the transfer of wealth from weak hands to strong hands.
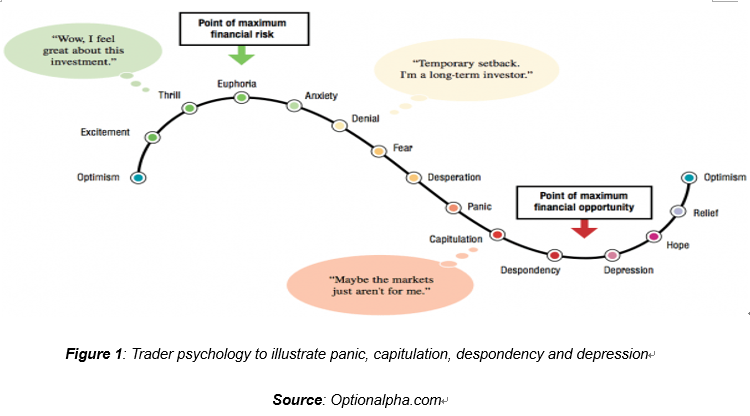
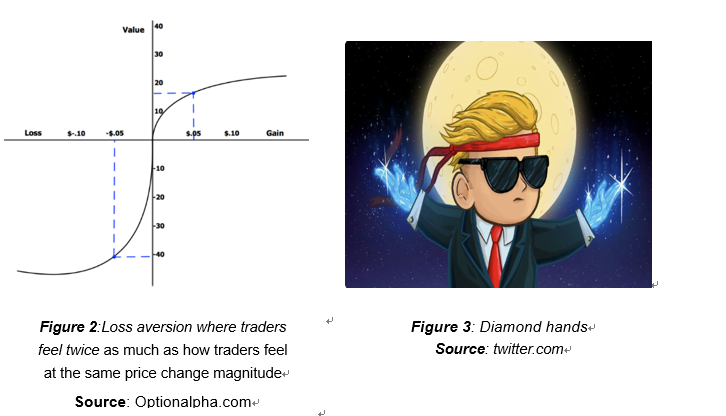
How does weak hand transfer a dollar through the market to add to the wealth of the whales? During market mass sell-off, weak hands sell their tokens/shares into weakness. The shares they sold were bought at higher prices. Basically, the market price actions mimic the actions of shrimps. Emotions are cultivated from thoughts, from fear to greed, and from depression to euphoria. From those emotional effects, shrimps decide to behave in accordance with market price actions, to either panic during mass sell-offs or adopt a Fear of Missing Out (FOMO) attitude during market ATH. The constant structure of triggering “the sell-low, buy-high” behavior from weak hands to strong hands accompanies the market 24/7. The diamond hands continue to liquidate and accumulate enough capital to restructure their portfolio to pump the market. When the market is bottomed, shrimps tend to exhibit a similar behavior. For example, during a mass sell-off, shrimps usually sell at a loss to follow up with their emotional behaviors, where the emotional behaviors are panic, capitulations, despondency and depression followed by disbelief in a relief rally.
We need quantitative behavioral analysis to visualize how many weak hands tend to sell at a loss to the strong hands. The number of shrimps, who tend to sell at a loss, are quantified as shrimp indicators. The indications are assumed as the particular group (population) divided by the number of sending addresses which are hypothetically selling addresses. Using such a hypothesis, we tested the indicator across a historical timeframe spanning from 2017 to today. When the shrimp indicators hit up to key value range and exhibit a U-turn down behavior, i.e. it turns down from the peak value, there is a relatively high probability that we shall surpass a relative inter-week market bottom.
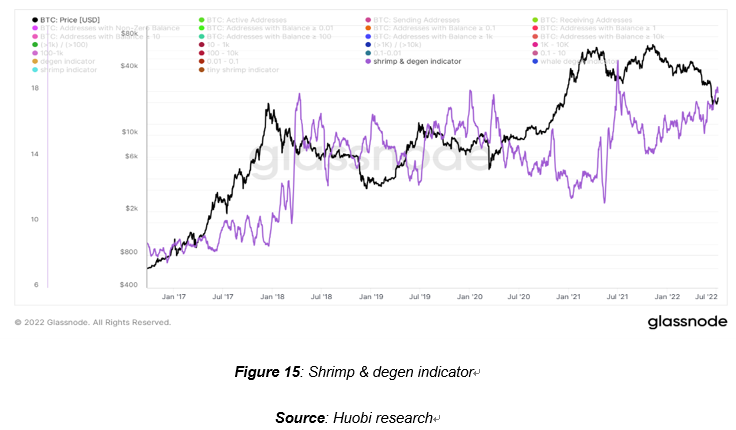
The indicators are illustrated in the following:
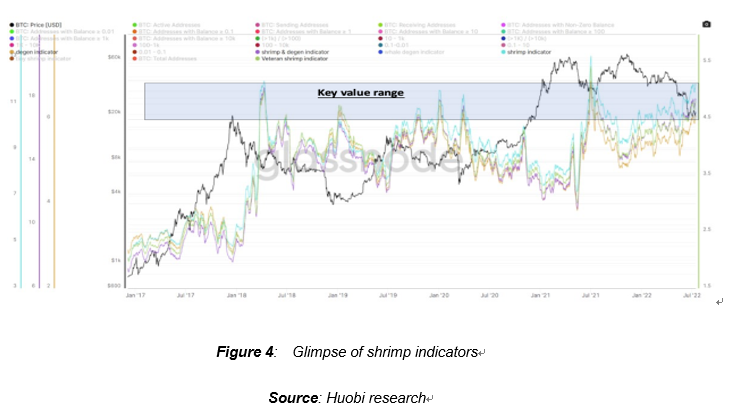
There are three probabilities cases when these shrimp indicators are hitting up to the key value range. In the first case, the total number of sending addresses grows smaller. When the denominator value becomes smaller, the indicator values shoot to a higher level. It indicates a higher probability that shrimps have already given up and are in a depression state, while whales are slowly accumulating at small daily transaction volumes. This also applies to Mark Minervini’s VCP strategy — that when the stock is about to break out, the volume contracts. It means there is a buying and selling balance where whales are buying at a low transaction volume, while shrimps have little to distribute. In the second case, there is a massive increase in the particular group of weak hand wallets. In this scenario, we are measuring the small wallet address groups, which are perceived as shrimp populations. These wallet groups can be classified as: less than 0.01 BTC (tiny shrimp indicator); 0.01BTC to 0.1 BTC (shrimp indicator), 0.1BTC to 1BTC (veteran shrimp indicator) and 1BTC to 10 BTC (whale degen indicator). To sum up and visualize the comparatively large number of weak hands, the degen indicator and shrimp & degen indicator measure the overall wallet address of 0.1BTC to 10 BTC and 0.01 to 10BTC respectively. If the weak hand wallet addresses increase, it indicates probability that some players have sold their BTC holdings at a loss and reduced their BTC exposure so they have a relatively smaller number of BTC in their wallets. The third case where the indicators hit up key value range is the scenario where more players sold at a loss and the transaction volume is low. The third case indicates a higher probability that the market is forming a relative bottom.
It is important to note that these indicators can change over time — while they could provide traders with opportunities to act before the market reacts, these indicators have to be combined with other strategies like technical analysis and on-chain metrics. The historical backtest was also conducted taking into account the events of 2017, because BTC is a new asset class from an emerging sector. These points may produce errors for the indicators across market reactions.
The six indicators will be illustrated in the following:

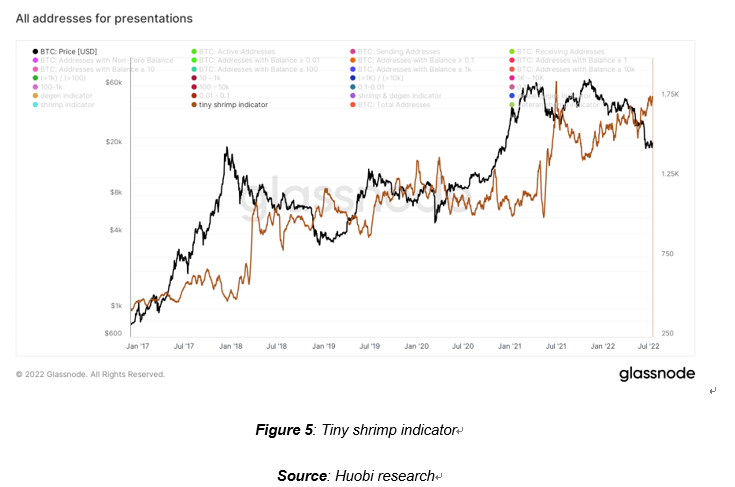
A quick scan of the tiny shrimp indicator concludes that the number of addresses are trending higher. However, unlike any of the following indicators mentioned below, the tiny shrimp indicator does not provide any key value range.

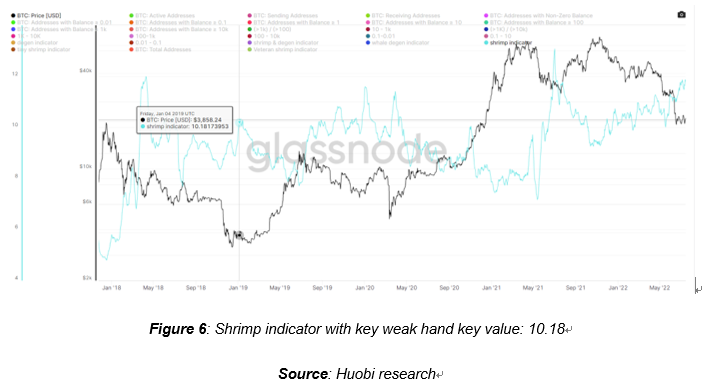
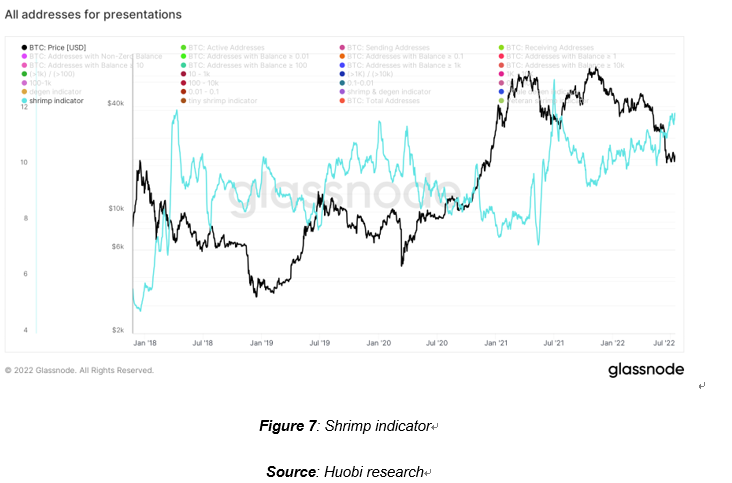
This indicator has a weak hand key value of approximately 10.18. It measures the wallet addresses where market players hold from 0.1 to 0.01BTC. Throughout the historical back test, a key indicator value of 10.18 showcased a relative bottom in the years of 2018, 2020 and 2021. The relatively bottoms were formed within weeks after the U-turn and dip of the shrimp indicator.
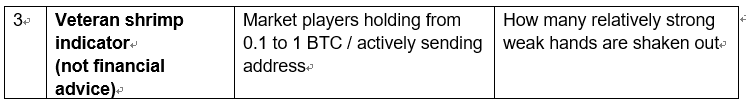
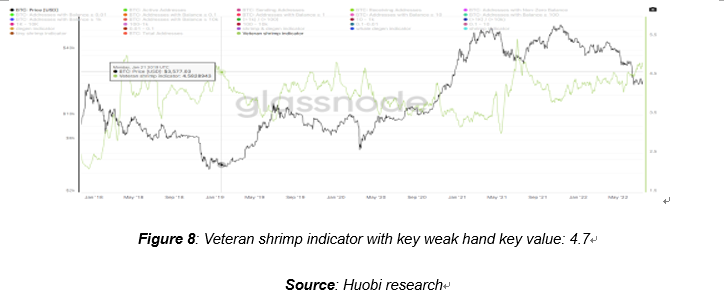
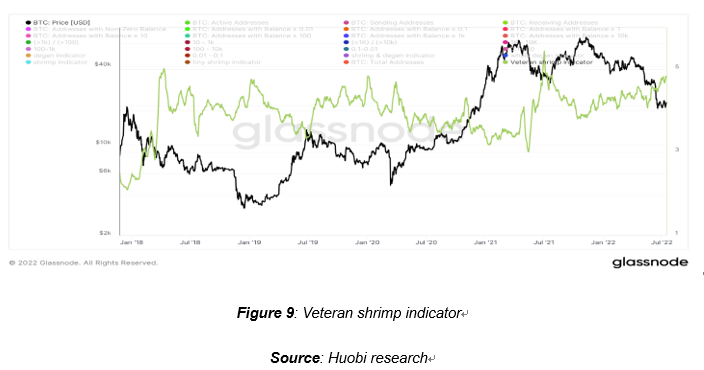
This indicator has a key weak hand key value of 4.7 approximately. It measures the wallet addresses where market players hold from 0.1 to 1 BTC. Throughout the historical back test, a key indicator value of 4.7 showcased a relative bottom in the years 2018, 2019, 2020 and 2021. It means that market players that originally held a relatively larger number of Bitcoin are now holding a relatively smaller amount, which contributes to this veteran shrimp indicator group. The relatively market bottoms were formed within weeks after the U-turn and dip of the veteran shrimp indicator. This group of veteran shrimps have stronger hands on the market but these players are holding fewer Bitcoin compared to their peers.

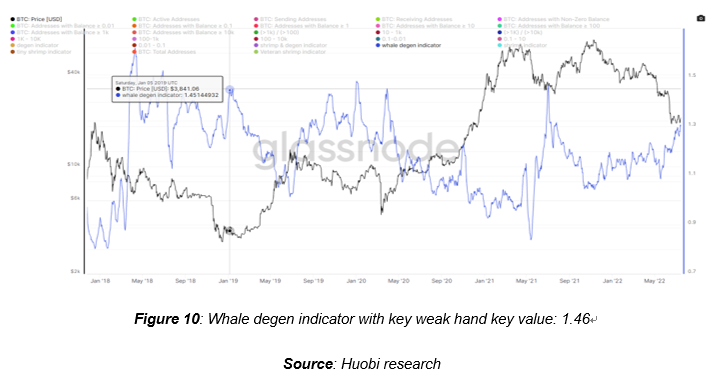
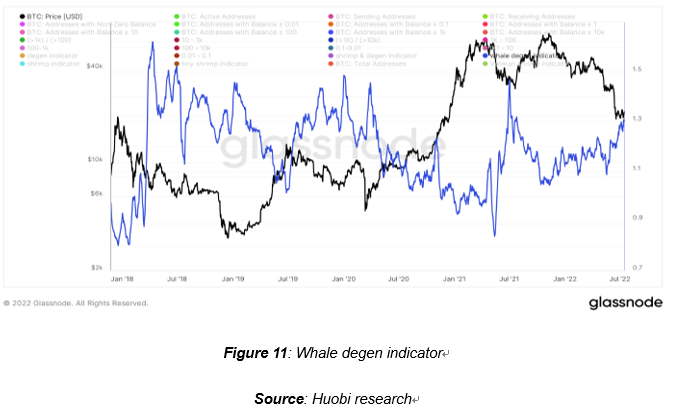
This indicator has a key weak hand key value of 1.46. It tracks the wallet addresses where market players hold 1 to 10 BTC. For the time being, their net worth is between US$20,000 and US$200,000 solely on the basis of their net number of Bitcoin per wallet address. Throughout the historical backtest, a key indicator value of 1.46 showcased a relative bottom in the years between 2018 and 2021. Its key value range of 1.46 and above differs from the other two indicators because a comparatively smaller proportion of investors hold such a number of bitcoins. Compared with peers, this indicator has not reached the key value range. It is because this group of market players, the “whale degens” do not have the tendency to sell at such a level. This either means the “whale degens” have a relatively strong risk tolerance or the sending or selling addresses dropped significantly. The former case shows that “whale degens” have not given up, which indicates the probability of a further market decline for mass capitulations. In this case the market has not reached a relative bottom. The latter case indicates the market has entered a period of low trading volume. It means a cooling down of the market that favors long-term accumulation by high net worth whales. Generally, the relatively market bottoms formed within weeks after the U-turn and decline of the veteran shrimp indicator. This group of “whale degens” have stronger hands on the market compared with other shrimps.
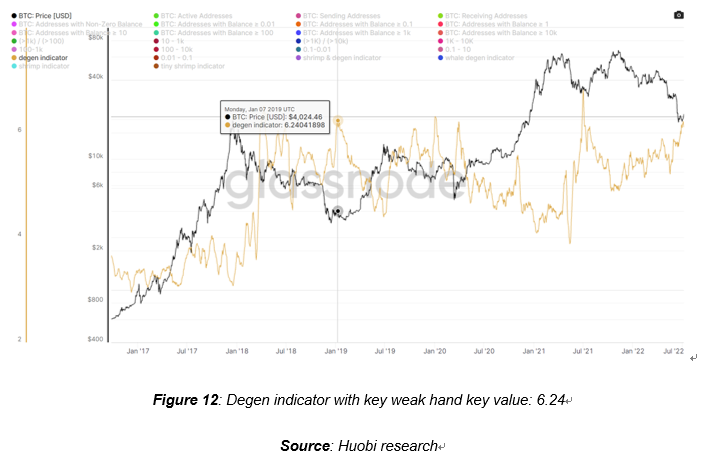
This indicator has a key weak hand key value of 6.24. It tracks the wallet addresses that hold 0.1 to 10 BTC. Basically, it sums up the market player behaviors associated with the indicators for tiny shrimp, shrimp, and veteran shrimp. This informs the investors (not investment advice) how the market behaves generally.
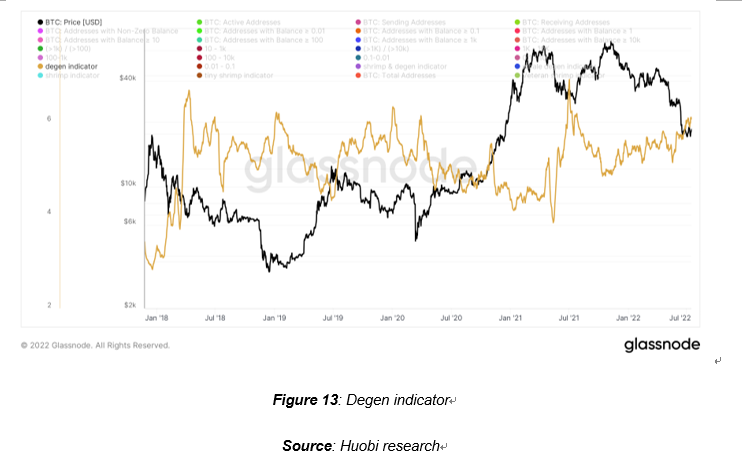
This indicator has a key weak hand key value of approximately 17.3. It tracks the wallet addresses that hold 0.01 to 10 BTC. Basically, it sums up the market player behaviors associated with the indicators for tiny shrimp, shrimp, and veteran shrimp.

3. SSR, CVDD & Realized Price
Stablecoin Supply Ratio (SSR) was first introduced by Renato Shirakashi and Rafael Schultze-Kraft in 2019. It is the ratio between Bitcoin supply and the supply of stablecoins, calculated by the total market cap of all (known and tracked) stablecoins in circulation. These stablecoins include: USDT, TUSD, USDC, PAX, GUSD, DAI and SUSD.

Stablecoins play an important role in crypto markets. They act as a gateway between fiat money and cryptocurrency, as well as the primary vehicle for entering and exiting Bitcoin positions. Because stablecoins have such a crucial role in Bitcoin’s demand and supply, we can evaluate and quantify the relationship between stablecoins and Bitcoin’s price in the SSR. In conclusion, SSR represents the buying power for Bitcoin. When there is a relatively large buying power available in the market, Bitcoin’s price can be readily inflated. On the other hand, when SSR is high, the buying power is weak, which means it becomes more difficult to push up the price of Bitcoin.
We should be reminded that SSR is one of the many ways to evaluate the current market situation. It does not necessarily mean that a low SSR represents a market bottom, as the latter is not determined by any metric, but by market players.
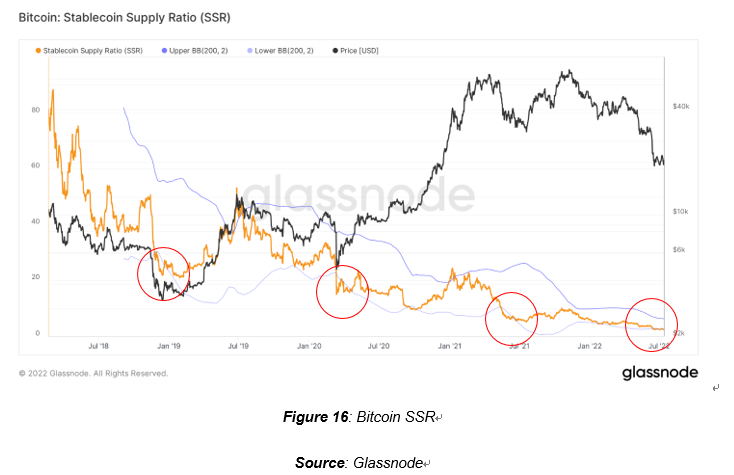
The above figure shows SSR vs Bitcoin’s price from 2018 to present. The upper band and lower band are computed by taking two standard deviations of SSR and smoothening it with a 200 moving average to eliminate noise. SSR is helpful when it comes to locating the potential market bottom. Historically, in Jan 2019, Feb 2020 and July 2021, the SSR breaks through the lower band of SSR which indicates a situation where the ratio of Bitcoin market cap to the market cap of major stablecoins has widened to a relatively extreme large extent. It coincidentally locates the bottom of Bitcoin at these particular time periods.
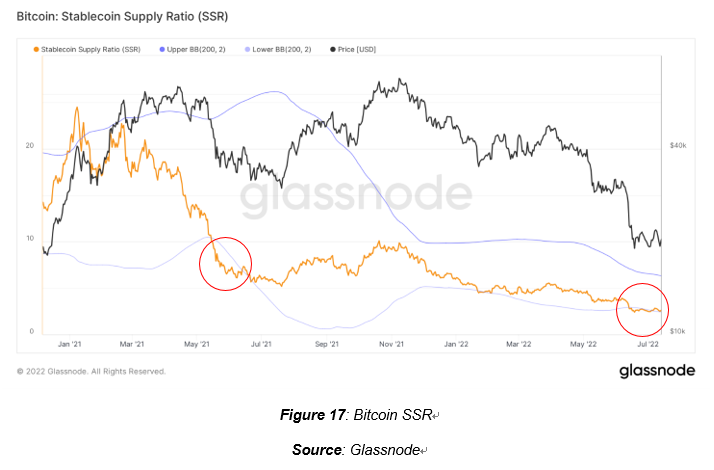
Let’s have a closer look at the current situation. The SSR touched the lower band in June 2022. It is worth noting that it flattened out in the last few months, which can be explained by a slow decline in Bitcoin market cap and a slowly increasing stablecoin market cap. Both indicate continuous and gradual waves of exits in Bitcoin. The takeaway is that SSR has reached the lower standard deviation and therefore could indicate a bigger chance of bottom formation at the current price level.
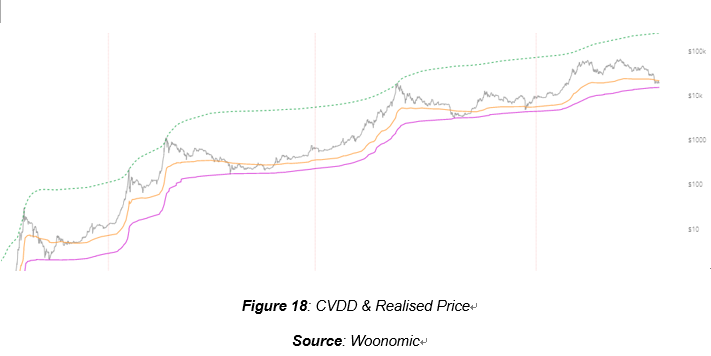
Another interesting metric to introduce here is the combination of CVDD and realized price. CVDD, introduced by Willy Woo in 2019, stands for Cumulative Value Days Destroyed. It has historically picked the bottom of Bitcoin in 2012, 2015 and 2019 with extreme accuracy. Please look at the purple line in the chart below.
When Bitcoin is transacted between an old investor and a new investor, the old information (previous purchase price and holding period) is destroyed and new information (latest transaction price and new count of holding period) is created. The indicator takes account of this value-time destruction as a ratio to the age of the market divided by 6 million as a calibration factor.

CVDD is even more useful for realizing the accumulation zone when it is used with realized price (the approximation of what the entire market paid for their coins, calculating by dividing the realized Bitcoin market cap by the total supply). Realized price indicates a fair value while CVDD indicates a possible base value where capitulations occur and potentially reached. Let’s have a closer look at the current market situation with CVDD and realized price.
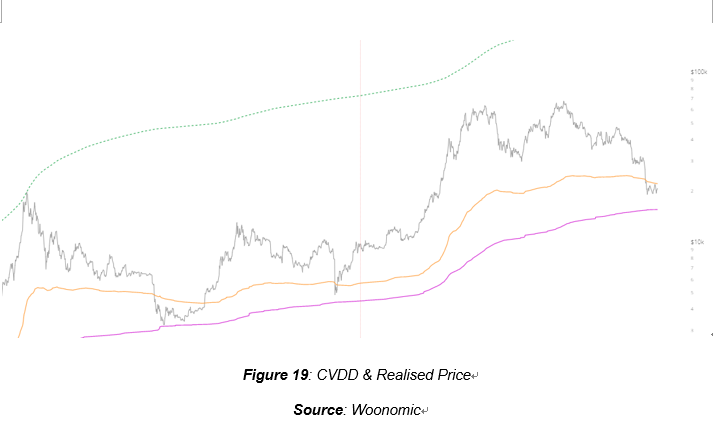
The current price level falls below the realized price, while staying above the CVDD. With regard to historical data, this zone offers an attractive risk-to-reward ratio for Bitcoin, because historically these zones were accumulation zones where capitulation events happened.
4. Conclusion
The shrimp, degen and whale indicators provide a good reference for the study of the behavioural patterns of different groups of market players during capitulations. When prices fall, some market players (particularly shrimps) panic and sell at a loss. During market capitulations, more people sell at a loss while fewer holders remain, pushing the value of the indicator even higher when there are more people selling at a loss who have fewer tokens to send. Market bottoms are formed when all sellers have been flushed out from the system. The remaining holders are the ones with a stronger conviction and a resilient mindset to face the bear market.
The CVDD and Realised Price are helpful to identify the potentially profitable accumulation zone. When the price falls below the Realised Price, it is a signal for profitable entry points. The CVDD price indicates a base value for BTC price which can be used as a reference for the lowest accumulation price. The CVDD and Realised Price are complementary to the shrimp, degen and whale indicators. The chance of seeing a potential bottom formation is greater when these indicators are pointing to the same direction during market capitulation periods.
Despite the fact that these indicators have performed well based on historical data, there are no predictive indicators. Many other factors can affect the crypto ecosystem. For instance, this may include macroeconomic, geopolitical, and even environmental factors. Indicators only provide snippets of historical information for us to visualise the likelihood of price development. They do not guarantee that past performance is indicative of the future. One must understand this concept when analysing charts with indicators.