A recent price recovery in the Bitcoin (BTC) market risks getting erased due to an eerie fractal from 2018.
Bitcoin price cycle similarities
First spotted by CryptoBullet, an independent market analyst, the fractal shows Bitcoin recreating an inverse head-and-shoulders (IH&S) pattern that preceded its price decline toward $3,100 later in December 2018. As a result, anticipations that BTC's price will undergo similar declines in 2022 might grow.
That is primarily because of the strikingly similar price trends between the pric downtrends in 2018 and 2021-2022. For instance, Bitcoin formed two higher highs in April and May 2018 around $10,000 before plunging below $6,000 in July while constructing the IH&S pattern.

BTC/USD daily price chart featuring IH&S fractal from 2018. Source: TradingView
Interestingly, in October 2021-February 2022, Bitcoin underwent an identical price trajectory, forming two higher highs — near $65,000 in April and $69,000 in November. Later, the price corrected to below $33,000 in early February while forming another IH&S pattern.
With IH&S being a bullish reversal pattern, BTC now awaits a breakout move towards or above $50,000. A similar technical setup shared by market analyst Lark Davis projects Bitcoin above $60,000.
2018 BTC price fractal risks trapping bulls
But a climb to $50,000 — or even $60,000 — may not absolve Bitcoin from its prevailing bearish bias. If the 2018 fractal repeats itself religiously in 2022, BTC's likelihood of falling toward $25,000 appears higher, as explained in the chart below.
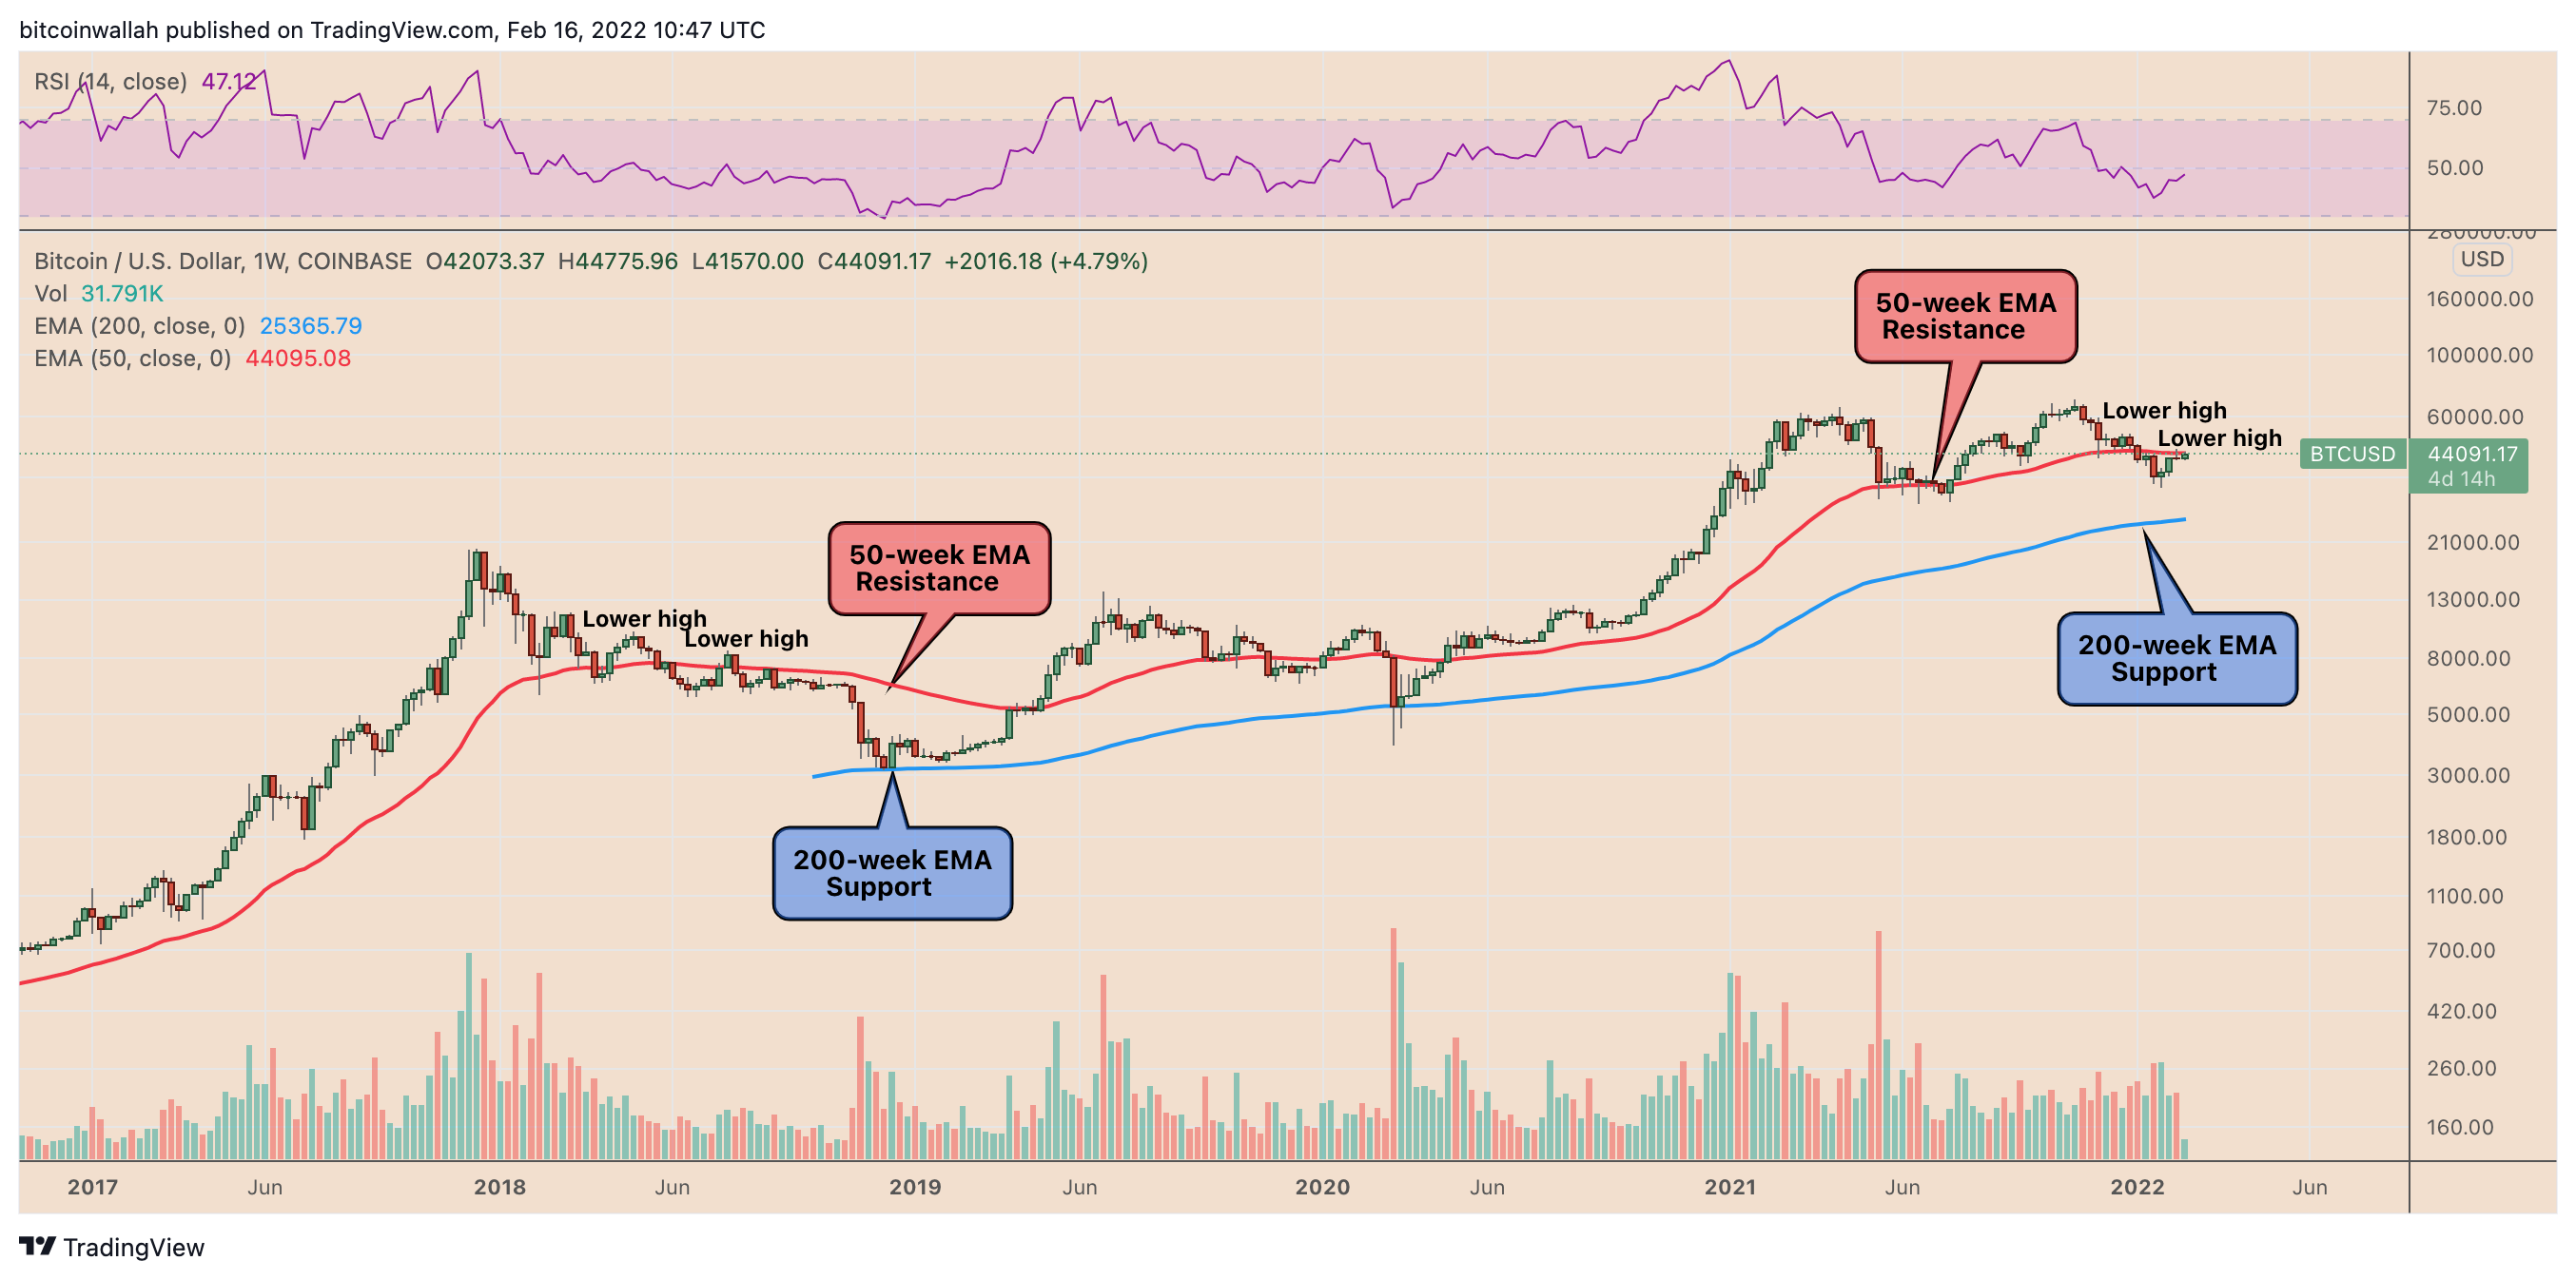
BTC/USD weekly price chart. Source: TradingView
Notably, the 2018 price action saw Bitcoin breaking out to the upside after its IH&S formation, reaching almost $10,000.
In doing so, BTC's price briefly reclaimed its 50-week exponential moving average (50-week EMA; the red wave) as support, only to break below it later. As it did, the price further declined towards the 200-week EMA (the blue wave) near $3,000, where it bottomed out in December 2018.
Applying the same fractal to the ongoing price action, Bitcoin might end up closing above its 50-week EMA, eventually hitting levels in the $50,000-$60,000 range. Nonetheless, it will move back below the red wave, and extend its decline towards the 200-week EMA, which sits near $25,000.
The negative outlook aligns with what Ari Rudd, an independent market analyst, shared in a Twitter thread on Feb. 14.
As Cointelegraph covered, the chartist cited Logarithmic Fractal Growth and moving average ribbon supports, suggesting that BTC's price might fall to the $24,000-$27,000 range in the coming months.
Not another 2018?
On the brighter side, Bitcoin has been treading ahead against more optimistic fundamentals than in 2018. Notably, BTC's price has rallied from under $4,000 in March 2020 to as high as $69,000 in November 2021, amid an increase in retail and institutional adoption led by macroeconomic risks such as higher inflation.
A November 2021 opinion editorial penned by Bloomberg Opinion’s John Authers points out that headline inflation, the consumer price index (CPI), rose roughly 28% in the past ten years. But denominating the same gauge in Bitcoin returned 99.99% deflation. But the mathematics came with a warning.
"If you put all your life savings into bitcoin a decade ago, well done. Should you do that now? Perhaps not," wrote Authers, adding:
"Over the last 10 years, bitcoin has delivered a lot of deflation, including 76% in the last 12 months alone, but also a couple of terrifying episodes when annual inflation ran at more than 200%."
Interestingly, the "terrifying episodes" occurred during the bearish cycles of 2015 and 2018.