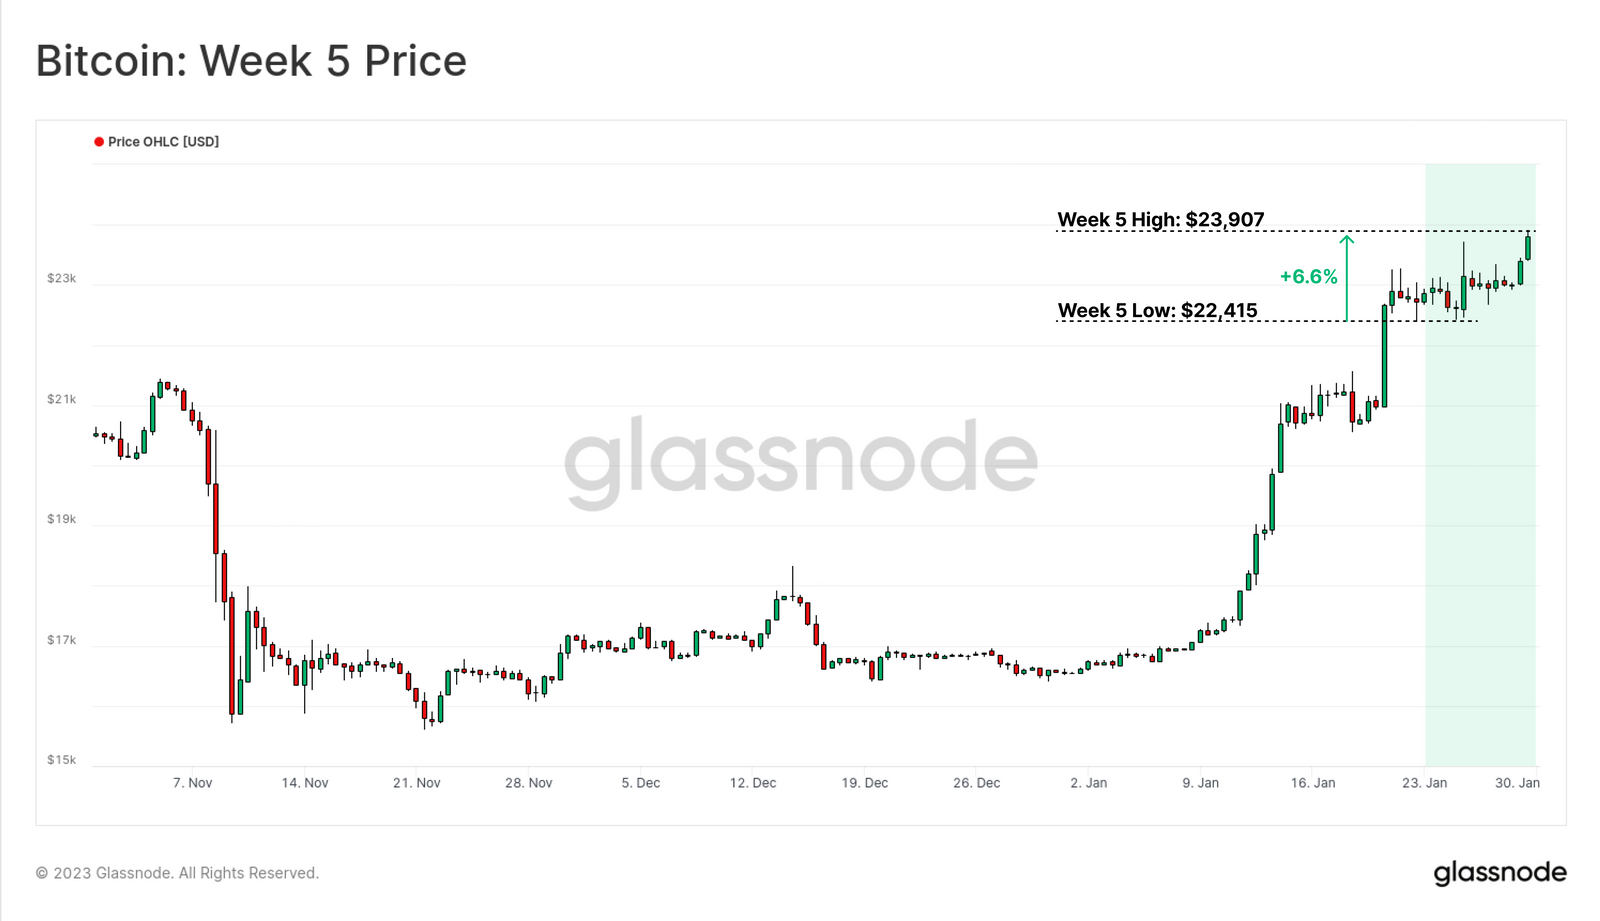
The rally in digital assets has continued this week, with Bitcoin prices reaching a high of $23.9k on Sunday evening. The month of January has seen Bitcoin markets posting the best monthly price performance since Oct-2021, reaching over +43% YTD. This puts Bitcoin prices at the highest level since Aug-2022, and a +6.6% gain off the weekly lows at $22.4k.
In this edition, we will explore some of the mechanics underlying this rally within both the derivative markets, and the spot exchanges. We cover:
1.The recent futures short squeeze and a return of positive futures basis, despite declining aggregate leverage relative to market size.
2.The prevailing decline of spot exchange balances, despite a decreasing dominance of exchange related on-chain activity.
3.The market breaking above the average withdrawal price for several market cohorts, including the class of 2019+, Binance and Coinbase customers, and Whales from the class of 2017.
Squeezing Shorts
After a long, painful, and gruelling 2022, the new year has opened with a notable reversal of the downtrend throughout January. As is often the case, such rallies are usually fuelled by some degree of short squeezes within derivative markets, and this rally is no different.
To date, there have been over $495M in short futures contracts liquidated across three waves, notably with declining scale as the rally played out.
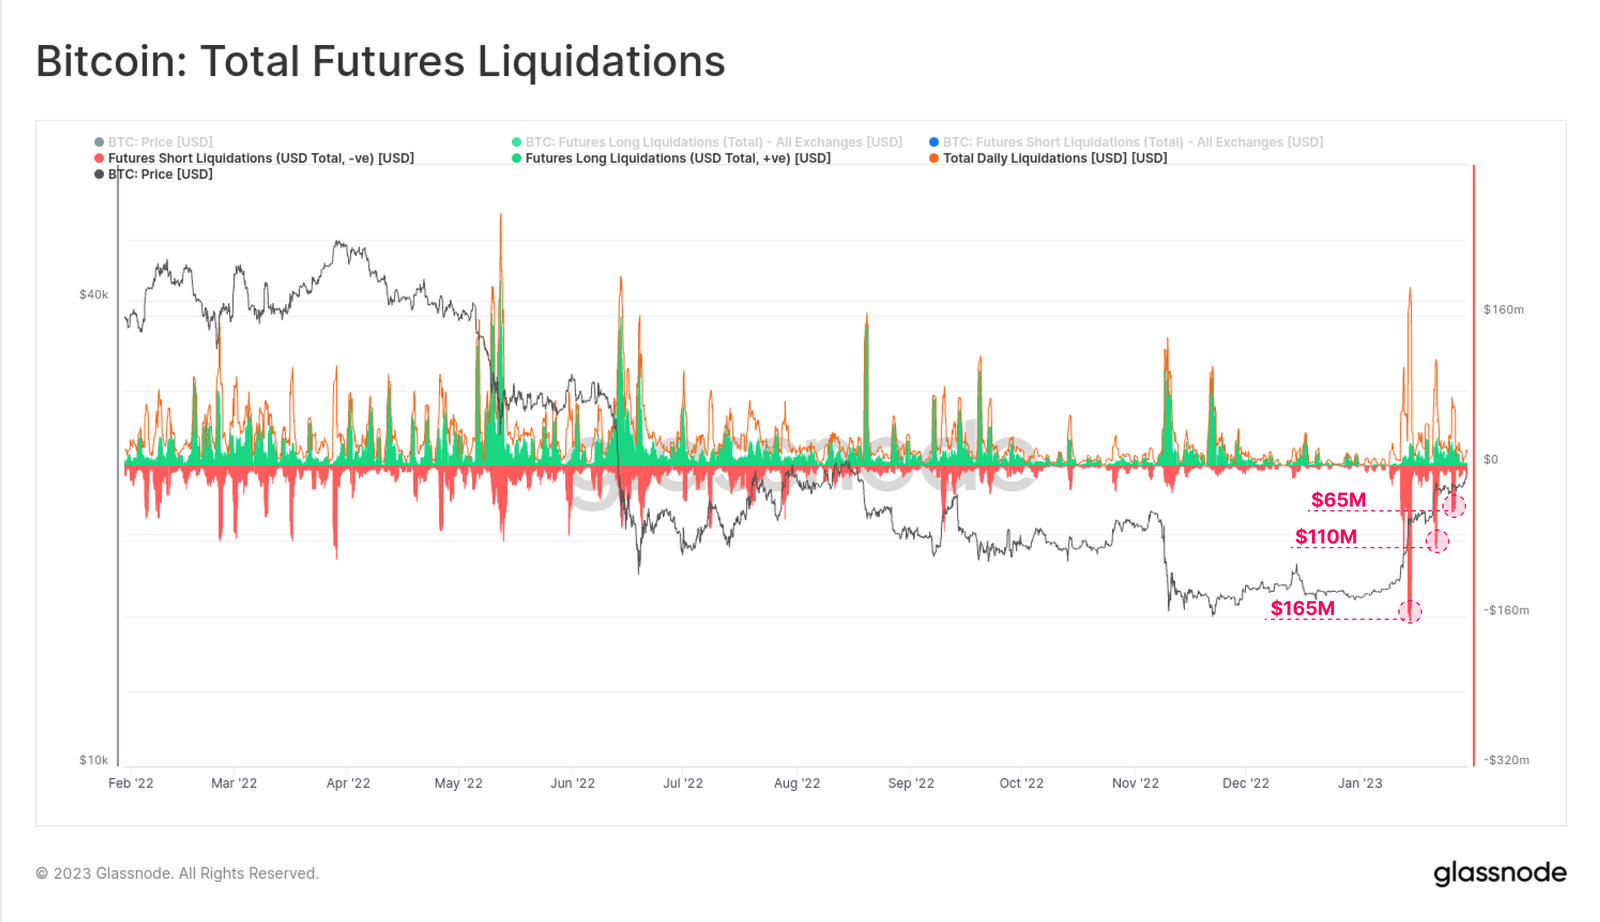
We can see the initial short squeeze in mid-Jan took many traders by surprise, setting an all-time-low of 15% for long liquidation dominance (meaning 85% of liquidations were shorts). This is an even larger magnitude relative to the longs liquidated during the FTX implosion (75% long dominance), showing just how offside many traders were.
Across both perpetual swap, and calendar futures, the cash and carry basis is now back into positive territory, yielding 7.3% and 3.3% annualized, respectively. This comes after much of November and December saw backwardation across all futures markets, and suggests a return of positive sentiment, and perhaps with a side of speculation.
However, despite this return of a positive futures basis, the total open interest relative to the Bitcoin Market cap has been in decline since mid-Nov. The BTC denominated value of open futures contracts has fallen by 36% over this time, dropping from 650k BTC in mid-Nov, to 414k BTC today.
Note that 40% of this decline can be directly attributed to the loss of 95k BTC worth of open interest that was held at the FTX exchange.
If we compare the notional size of open futures contracts to the BTC balance on corresponding exchanges, we can gauge the relative scale of leverage within the market. Here we can see that this leverage ratio has declined from open interest equal to 40% of spot exchange balances, to just 25% over the last 75-days.
Overall, this reflects a significant net reduction in futures leverage, and a closing out of short speculative interest. It potentially also signals a reduction in short term downside hedge positions. On a relative basis, and alongside the increase in observed shift back towards on-chain self-custody (WoC 46), this also puts more emphasis onto spot markets as a key driver of the current market structure.
Inspecting Spot Exchanges
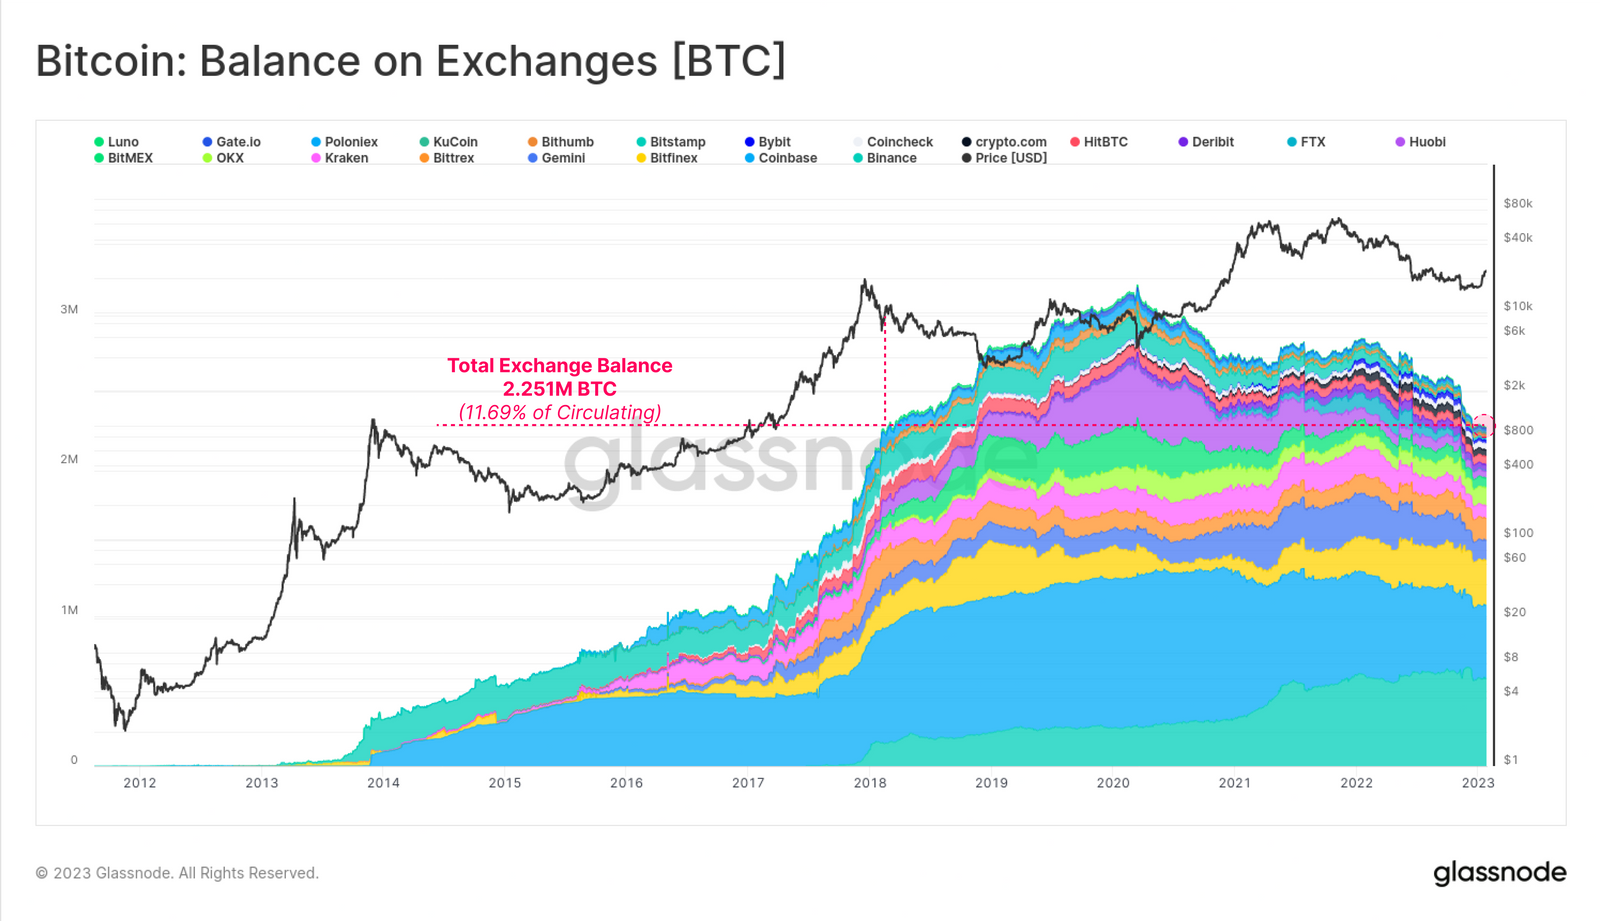
The trend of coins flowing out from spot exchanges has been a major theme since March 2020, which to this day marks the all-time-high exchange coin balance. Today, the total BTC balance held on the exchanges we track is around 2.251M BTC, representing 11.7% of the circulating supply, and a multi-year low that was last seen in Feb 2018.
The total volume of coins flowing both in and out of exchanges is currently around $625M/day in both directions (i.e. $1.25B/day total). On net, there is around $20M in net daily flows, reflecting just 1.5% of the total, and showing that exchange flows are in a remarkably even balance. This differs to Nov-Dec where exchanges saw periods of net outflows on the order of $200M to $300M per day.
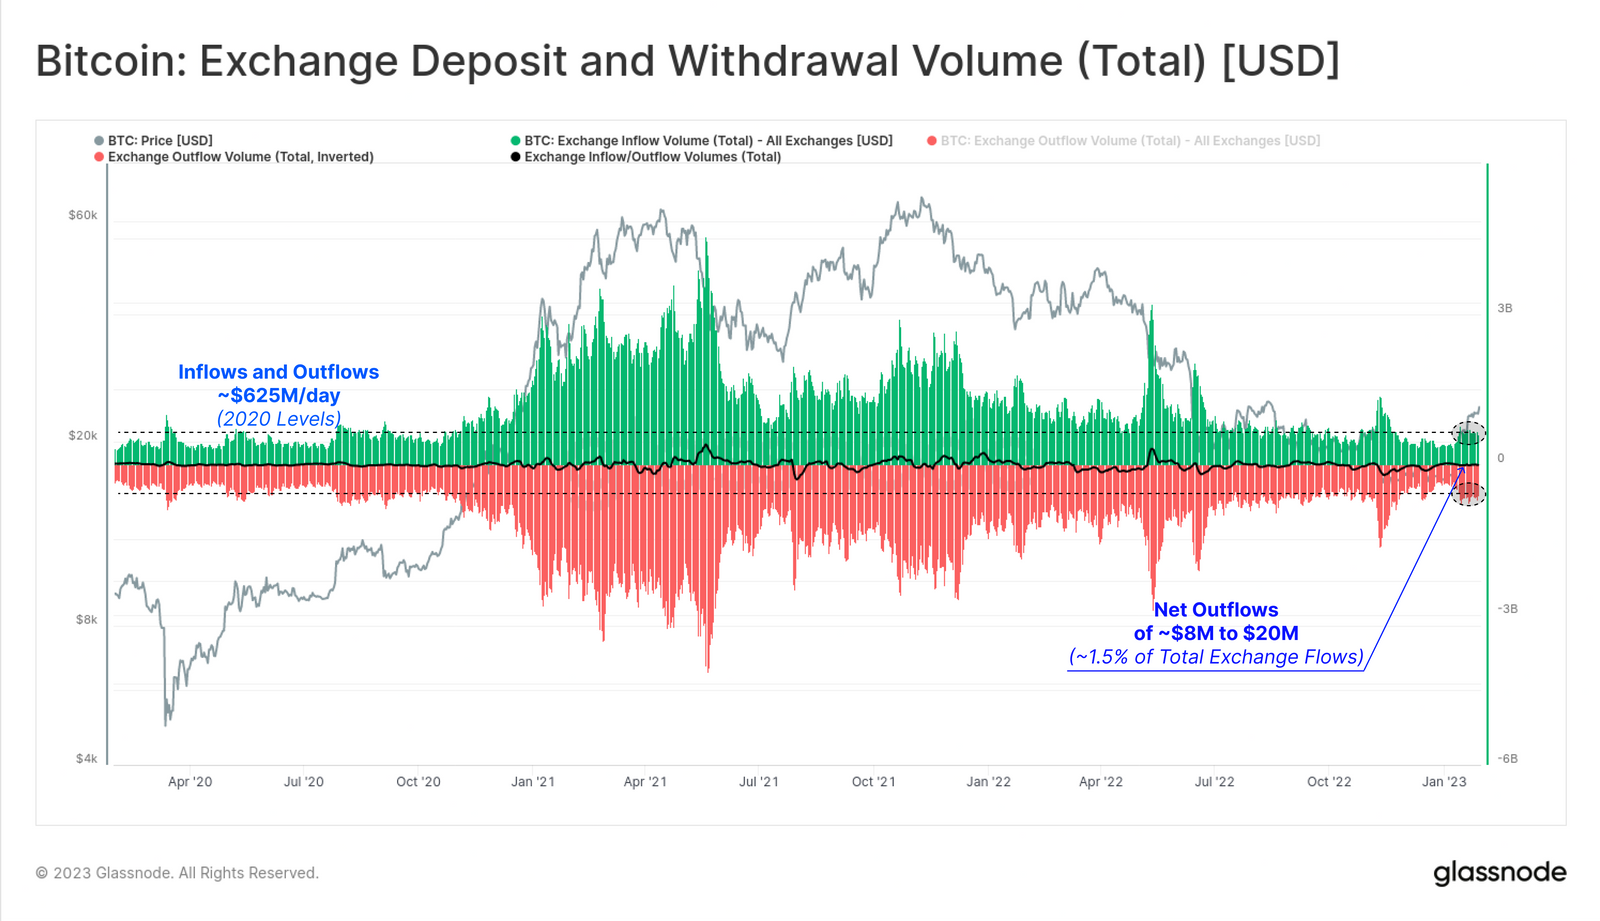
The largest monthly outflow of coins in history occurred in this Nov-Dec period, hitting -200k BTC/month in outflows across all exchanges. Today, exchange net-flows have returned to neutral, reflecting a cooling down of outflows. This may signify a slow down in new demand relative to newly mobilized spending (WoC 4), now that the market has rallied over 43% year-to-date.
The largest monthly outflow of coins in history occurred in this Nov-Dec period, hitting -200k BTC/month in outflows across all exchanges. Today, exchange net-flows have returned to neutral, reflecting a cooling down of outflows. This may signify a slow down in new demand relative to newly mobilized spending (WoC 4), now that the market has rallied over 43% year-to-date.
An Evolving Economy
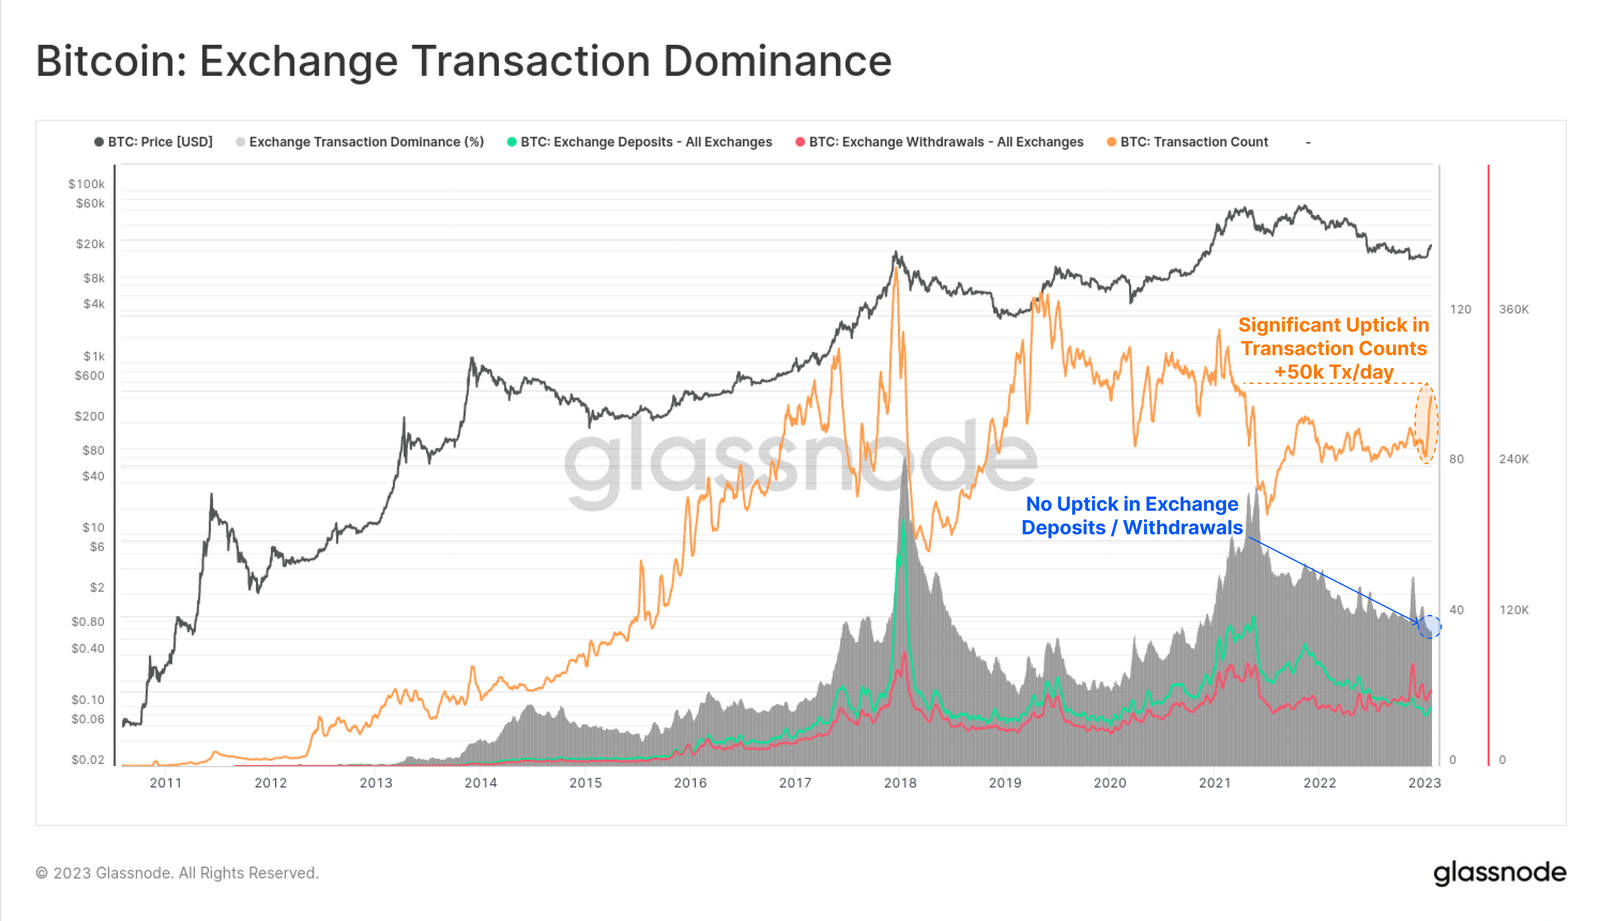
On-chain transactions for Bitcoin spiked by over 50k transactions per day this week, however we cannot see a corresponding increase in exchange deposits or withdrawal counts. Exchange related transactions represent just 35% of total transaction counts at present, with this dominance remaining in a downtrend since the May 2021 market peak.
This spike in transaction counts is also visible within our Entity-Adjusted data, suggesting it is not associated with a single entity, or internal wallet management. This suggests that recent uptick in transaction activity is occurring elsewhere within the Bitcoin economy.
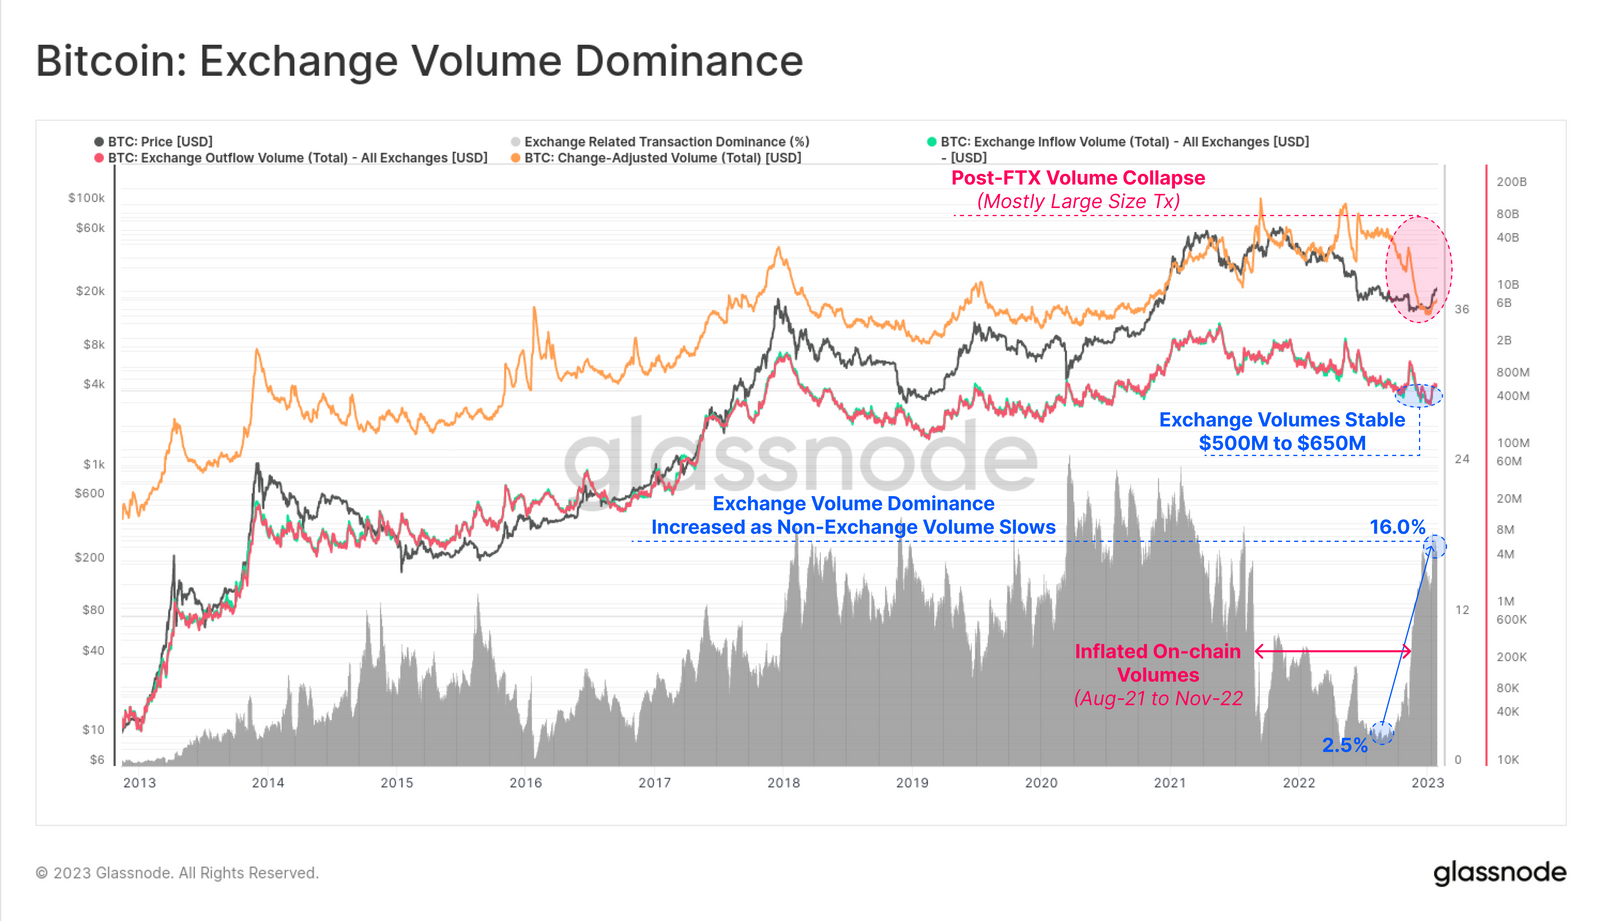
The USD denominated volume flowing in and out of exchanges has been relatively stable for the past few weeks, however despite this, the relative dominance of exchange related on-chain volume has grown from 2.5% to over 16%.
As we noted in WoC 3 and WoC 2, global transaction volumes for Bitcoin have fallen precipitously since November. This is likely a reflection of a decline in inflated, large size on-chain volumes occurring between Aug-2021 and Nov-2022, due largely to the industry-wide deleveraging, and wallet mismanagement by the FTX/Alameda entity.
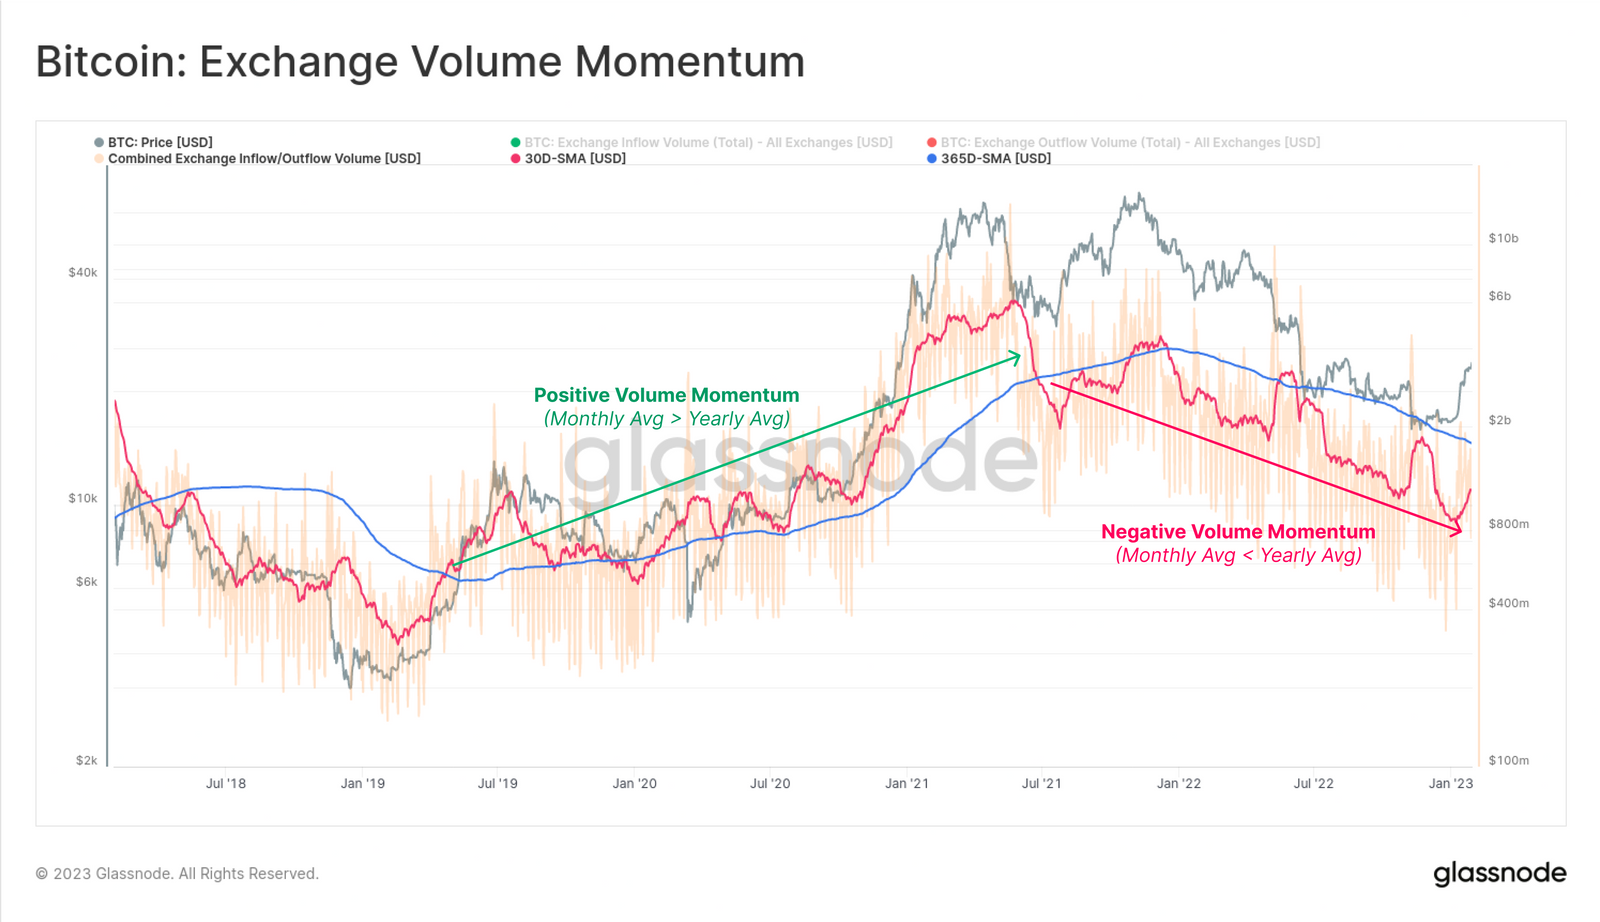
Usually, market strength is accompanied by an increase in total on-chain exchange volumes, as investors and traders become more active. With the above as context, we can see that there remains a negative aggregate momentum within exchange transfer volumes. The monthly average is starting to increase, however it remains well below the yearly baseline at this stage.
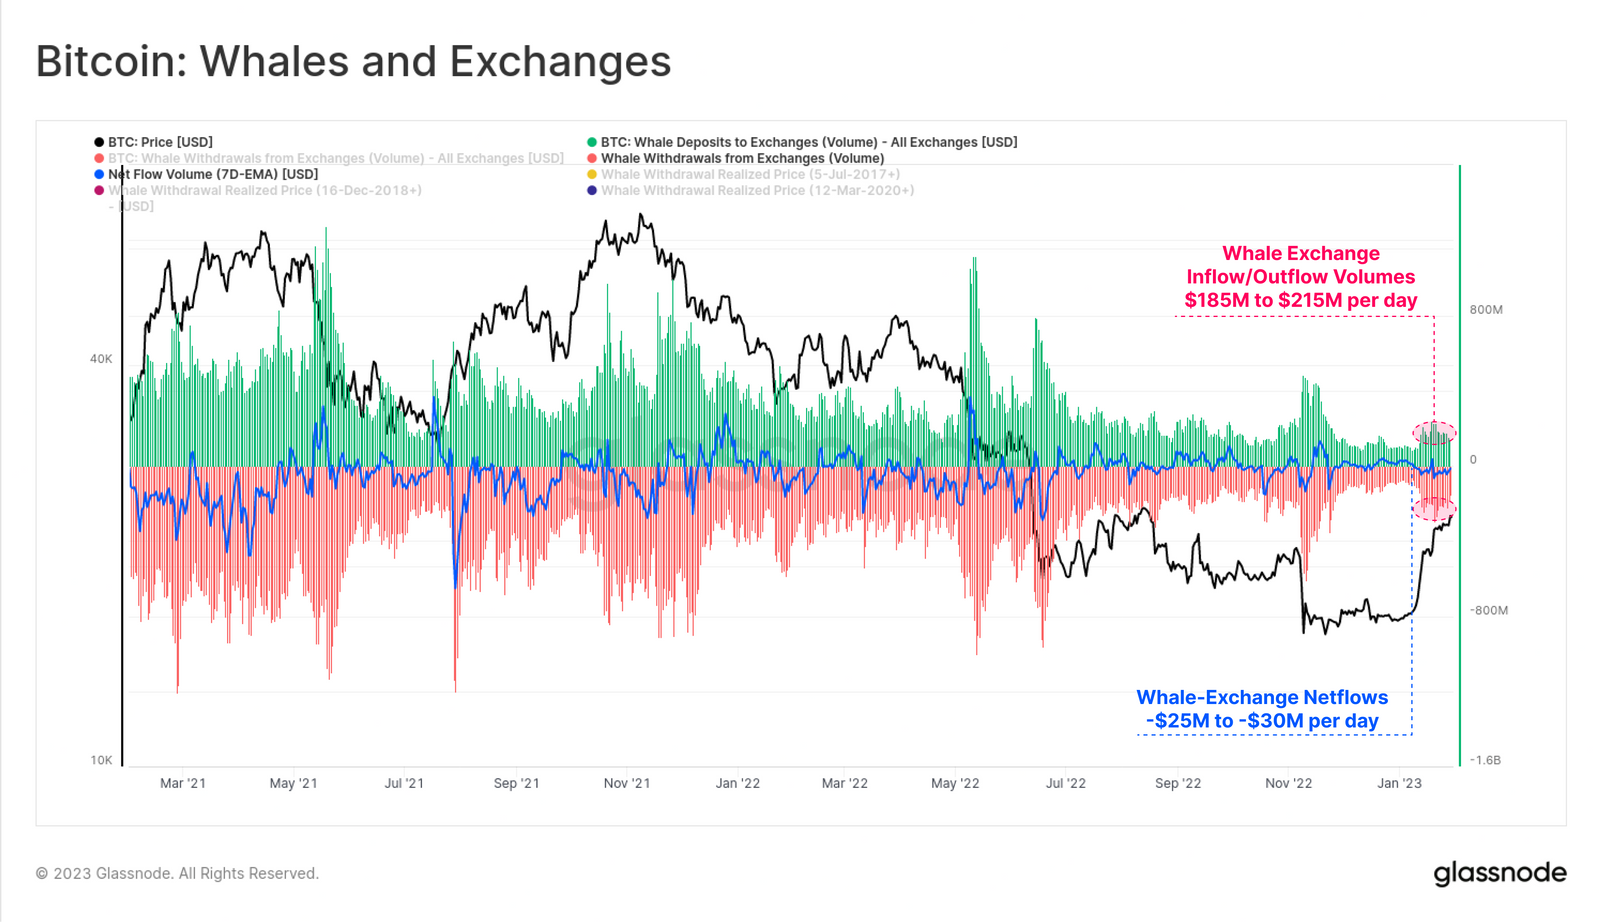
Specifically looking to Whale entities, holding over 1k BTC, we can also see an uptick in both deposit and withdrawal volumes to exchanges. Throughout January, Whale entities have contributed between $185M to $215M to total exchange inflows (and outflows), with a net bias of around $25M in net withdrawal volumes.
An Average Acquisition Price
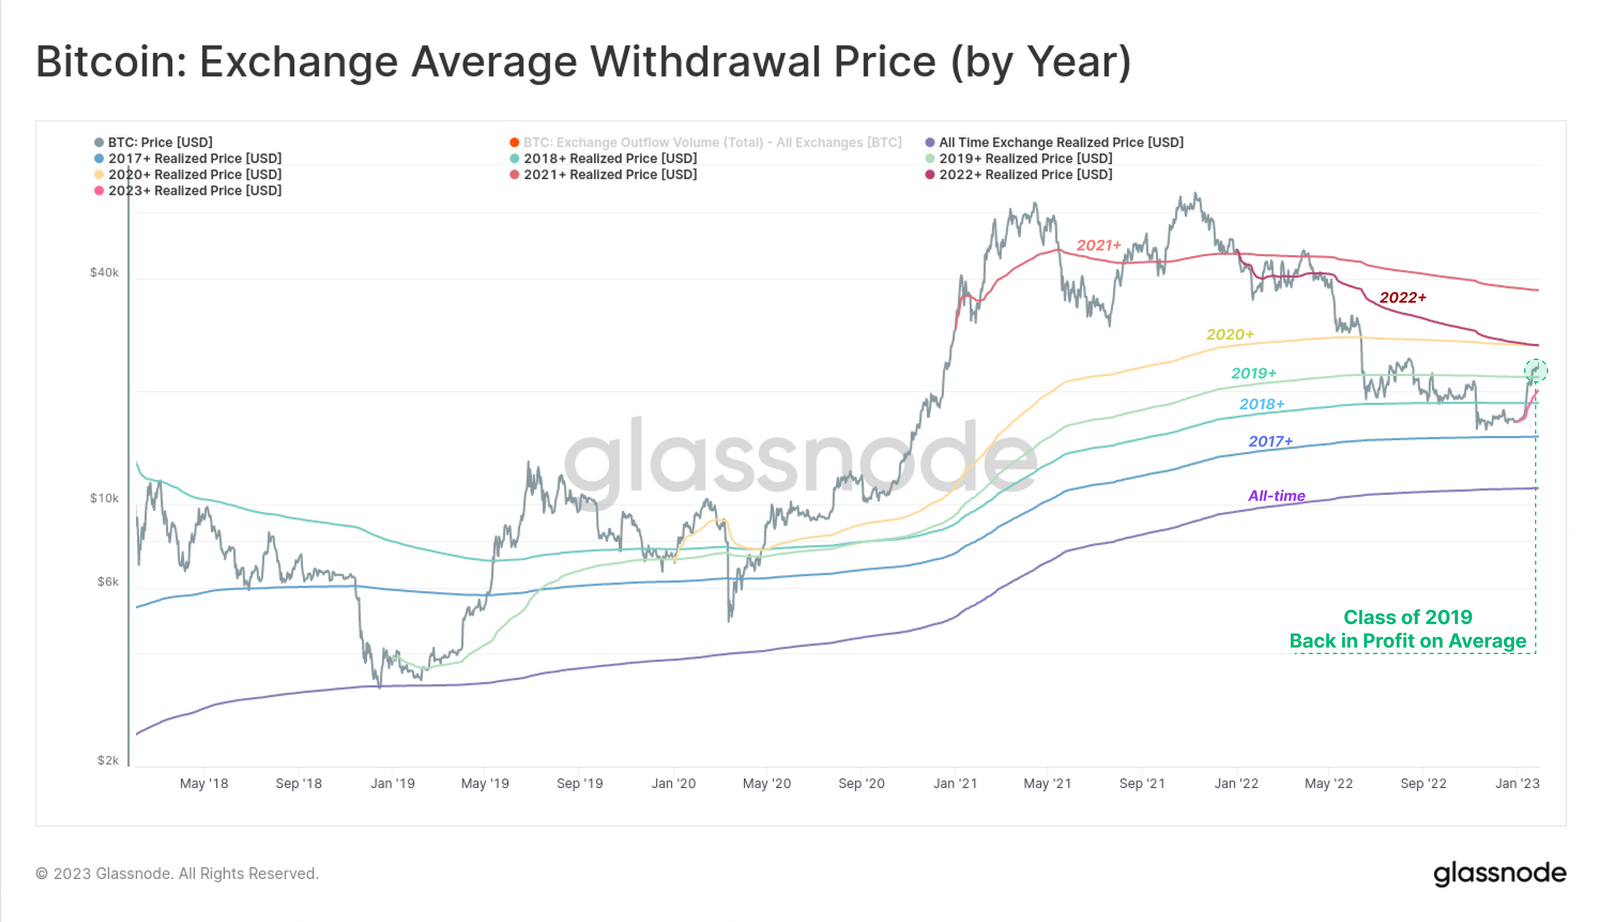
With such large volumes of coins flowing both in, and out of exchanges, we can estimate the average acquisition price for various cohorts of the Bitcoin economy. This first chart models the average acquisition price by yearly class, starting the calculation on the 1-Jan each year, and modelling a sort of long-only DCA cost basis.
Through the 2022 downtrend, only those investors from 2017 and earlier avoided hitting a net unrealized loss, with the class of 2018+ seeing their cost basis taken out by the FTX red candle. The current rally however has pushed the class of 2019 ($21.8k) and earlier back into an unrealized profit.
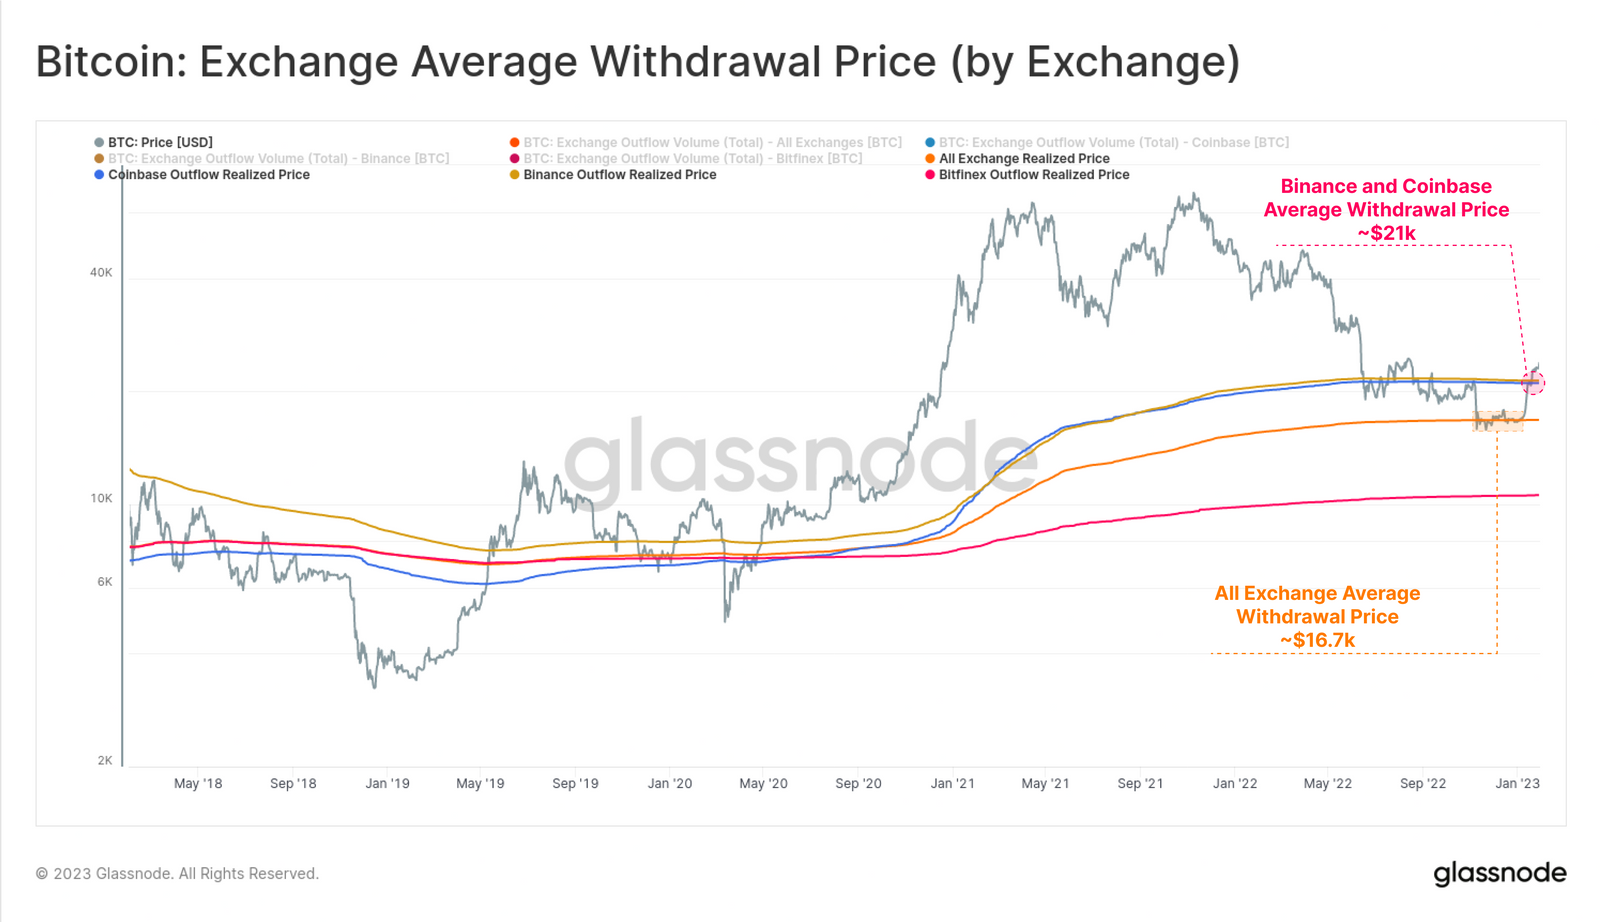
We can create a similar model per exchange, with the chart below showing that recent price action intersected three key cost basis levels:
🟠 The all-exchange, all-time withdrawal price was intersected at $16.7k, and provided a form of support during the end of year consolidation range.
🟡 + 🔵 The average withdrawal price since Jul-2017 for Coinbase and Binance, the two largest exchanges, was just broken through around $21k.
In line with our report last week (WoC 4), this can also be seen within metrics like Percent Supply in Profit, which have increased dramatically as prices rise above their on-chain acquisition price.
Finally, we return to our Whale cohort discussed earlier, however this time reviewing their average acquisition prices since major market bottoms. By starting these traces at market lows, we can assess this cohorts most favourable possible prices.
What we see is that even the average whale, that has been active since the 2017 market 🟡, saw their holdings go into an unrealized loss in 2022 as prices broke below $18k. The cohort since the March 2020 lows have an acquisition price of $23.8k, which is sitting immediately above spot prices at the time of writing.
All three of these models demonstrate just how unforgiving the 2022-23 bear market has been, driving cohorts with even the most favourable starting points into an unrealized loss.
Summary and Conclusions
As the end of January approaches, Bitcoin markets have seen the strongest monthly price performance since Oct-2021, fuelled by both historic spot demand, and a sequence of short squeezes. This rally has brought a large portion of the market back into profit, and resulted in futures markets trading at a healthy contango. We also note that initial impulse of exchange outflows, in the aftermath of FTX have calmed to neutral, and are now balanced by newly motivated inflows.