Your Backtest Is Lying: Why You Must Use Point-in-Time Data

insights.glassnodeОпубліковано о 2026-03-13Востаннє оновлено о 2026-03-13

Анотація

The article warns that backtests using revised historical data are misleading due to look-ahead bias. It illustrates this with a hypothetical trading strategy based on Bitcoin exchange outflows from Binance: entering the market when the 5-day moving average of BTC balance falls below the 14-day average, and exiting on the reverse. Initial backtest results using current data appeared reasonably successful, even comparable to buy-and-hold at times. However, the author argues this is deceptive because metrics like exchange balances are often revised retroactively as new data arrives, meaning a backtest uses information that wasn't available in real-time. Re-running the identical strategy using Point-in-Time (PiT) data—which is immutable and reflects only what was known when the data was first published—yielded significantly worse performance. The PiT-based strategy failed to capture key market upswings as effectively, resulting in meaningfully lower cumulative returns. The key takeaway is that only immutable, Point-in-Time data ensures a backtest accurately replays history without look-ahead bias, and that using revised data will produce lying backtests.

Let's build a simple, hypothetical trading strategy. The premise is straightforward and rooted in a widely discussed narrative: when coins leave exchanges, it tends to be bullish. The reasoning is intuitive: coins moving off exchanges typically signal that holders are withdrawing to self-custody, reducing the available supply for selling. Conversely, coins flowing onto exchanges may indicate that holders are preparing to sell.

A single day of outflows, however, is just noise. To identify a genuine trend, we would apply a moving average crossover on the exchange balance. When the short-term average falls below the long-term average, it confirms that coins have been leaving exchanges consistently, as a sustained pattern, rather than isolated events.

Using Glassnode's exchange balance for Binance, we define the following:

  • Enter the market when the 5-day moving average of Binance's BTC balance falls below its 14-day moving average, signaling a sustained outflow trend.
  • Exit the market when the 5-day average rises back above the 14-day average, signaling that the outflow trend has reversed and coins are returning to the exchange.

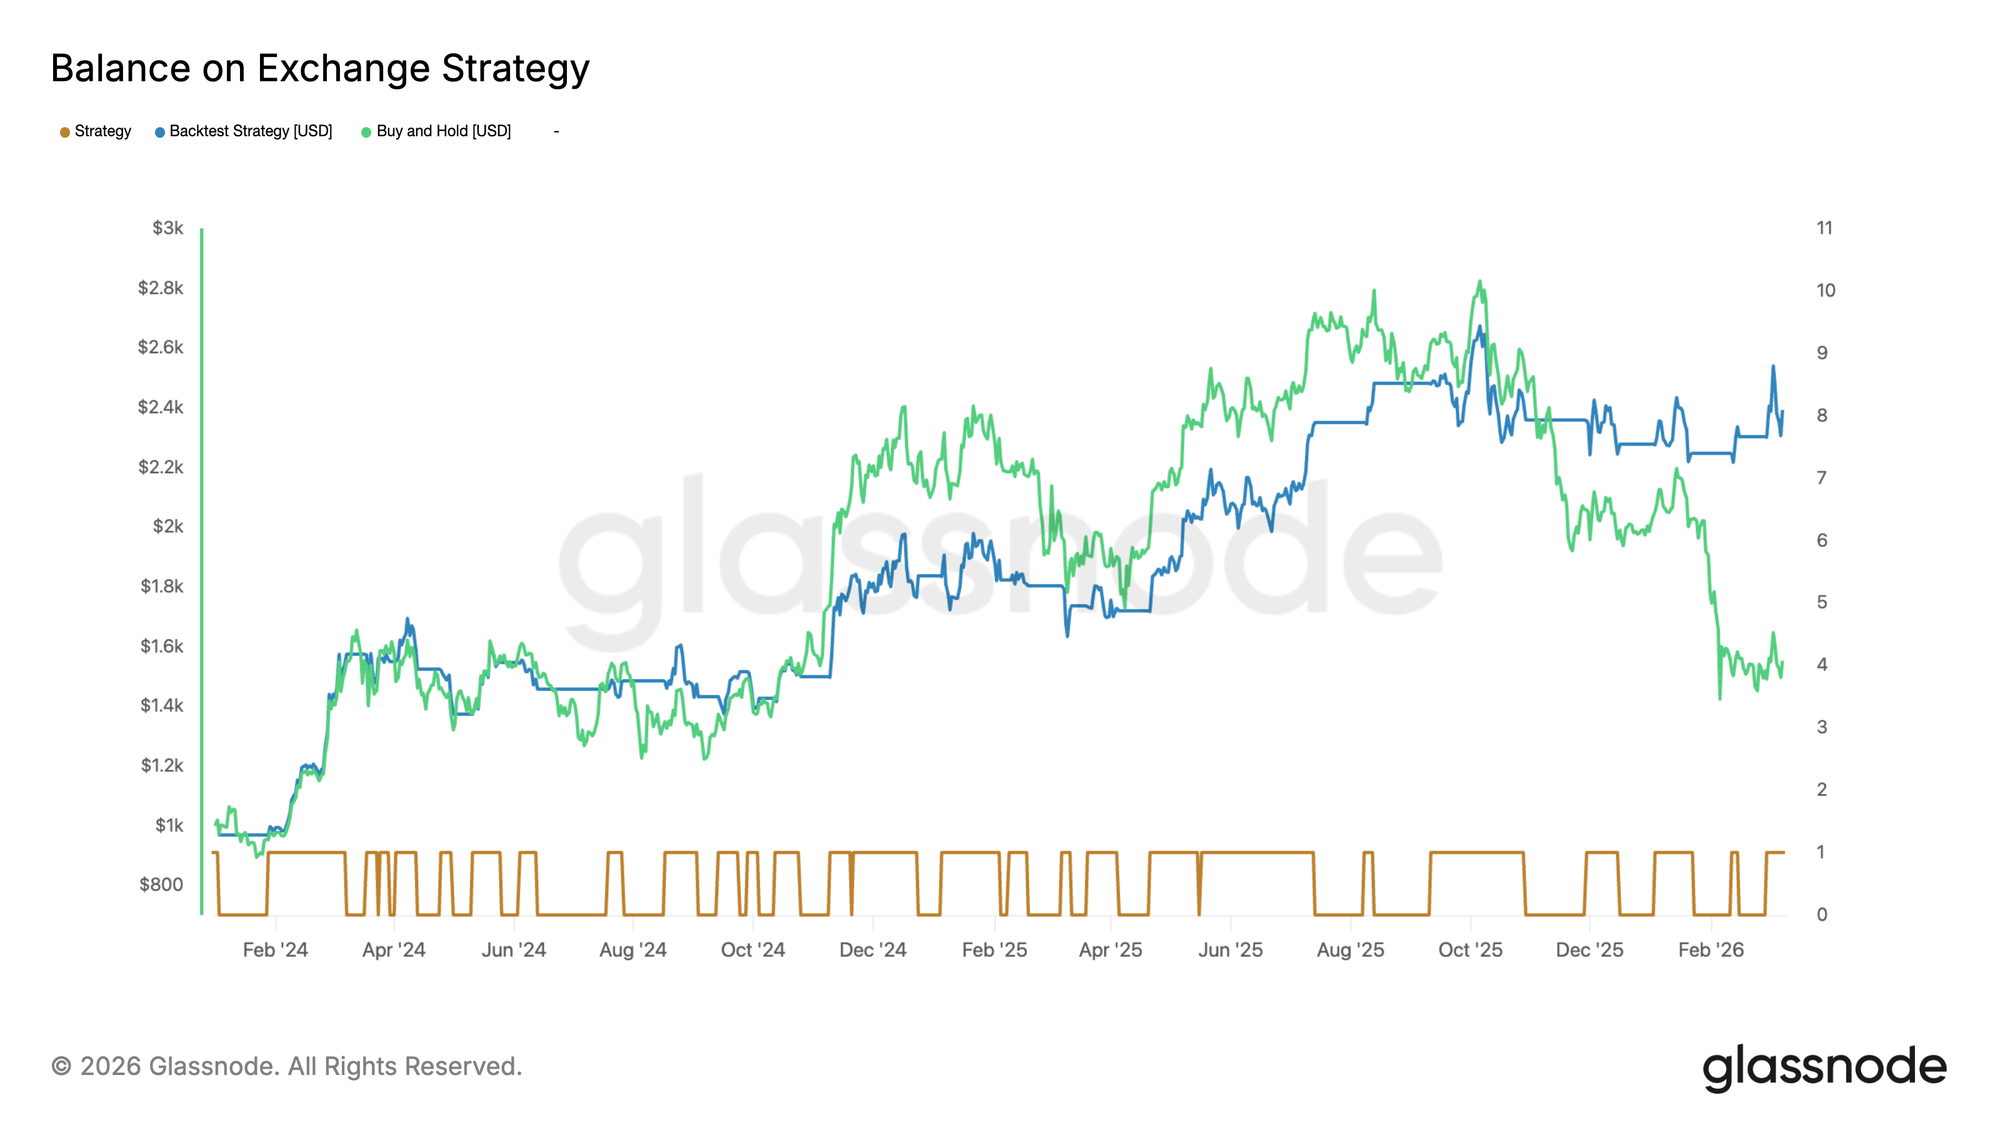
We then benchmark this strategy against simply holding BTC over the same period, starting January 1, 2024 through March 9, 2026, with an initial capital of $1,000 and 0.1% trading fees applied to each trade.
This is a simplified trading strategy, designed primarily for illustrative purposes. It is not investment advice, nor is it meant to suggest that exchange balances are a robust foundation for a trading system.
Access live chart

Here's how to read this chart:

🟫 The brown line at the bottom is the binary trading signal, toggling between in the market (1) and out of the market (0).

🟦 The blue line tracks the strategy's portfolio value over time.

🟩 The green line is the buy-and-hold portfolio benchmark.

We can observe that the exchange balance strategy performed reasonably well, although at times the buy-and-hold strategy outperformed it. In the final days of the research period, however, the exchange balance strategy caught up. While some investors may find the combination of reduced volatility and an ultimately comparable performance to buy-and-hold appealing, the final numbers are misleading – and here’s why.

The Problem: Data Mutation and Look-Ahead Bias

Metrics are not static. Many are retroactively revised as new information becomes available. This is particularly true for metrics that depend on address clustering or entity labeling, such as on-chain exchange balances. However, it is also the case for metrics such as trading volume or price, as individual exchanges can occasionally submit their data with slight delays.

This means that a value you see today for, say, January 15, 2024, may not be the same value that was published on January 15, 2024. The data has been revised with hindsight. When you backtest a strategy on this revised data, you are implicitly using information that was not available at the time the trading decisions would have been made. This introduces a look-ahead bias.

The Honest Backtest: Using Point-in-Time Data

Let's therefore repeat the exact same backtest – same signal logic, same parameters, same dates, same fees – but this time using the Point-in-Time (PiT) variant of the Exchange Balance metric, available in Glassnode Studio.

PiT metrics are strictly append-only and immutable. Each historical data point reflects only the information that was known at the time it was first computed. No retroactive revisions, no look-ahead bias.

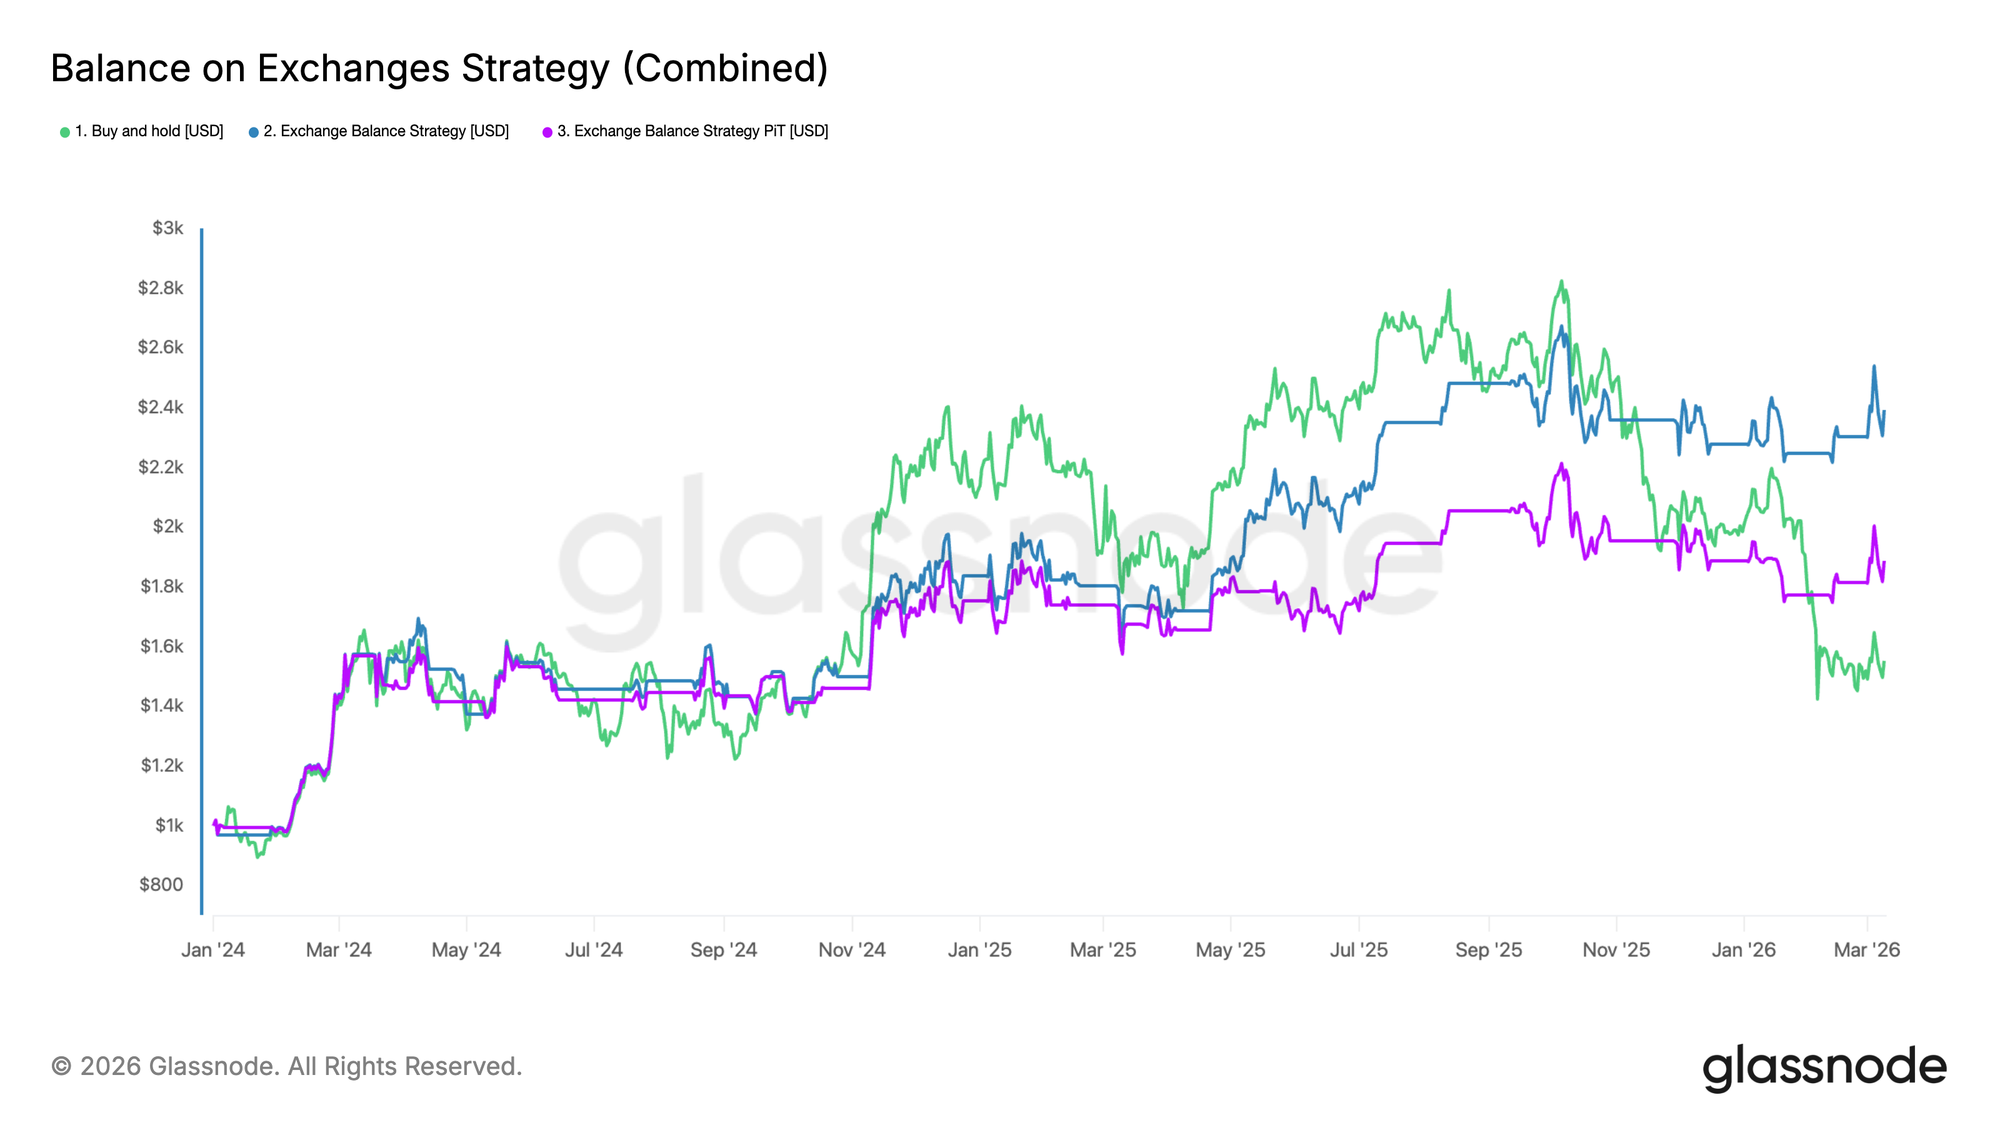
While we are using the same metric, the strategy now produces significantly different results, as illustrated by the purple line in the new chart below. The overall performance is notably worse.

Although both strategies behave similarly for much of 2024, we observe that the PiT-based version fails to capture the strong upticks in November 2024 and March 2025 as effectively. As a result, the cumulative performance diverges meaningfully and ends up considerably lower.
Access live chart

Key Takeaway

In this example, the purple strategy, which only has access to information as it was available at the time, performs noticeably worse. ► Backtests will lie if fed with wrong or revised data. Only immutable, Point-in-Time metrics ensure you’re replaying history as it actually happened.


Пов'язані питання

QWhat is the main premise of the hypothetical trading strategy described in the article?

AThe strategy is based on the narrative that when coins leave exchanges, it is a bullish signal, as it indicates holders are moving to self-custody and reducing available supply. It enters the market when the 5-day moving average of Binance's BTC balance falls below its 14-day average and exits when it rises back above.

QWhat is the primary problem identified with using standard historical data for backtesting?

AThe primary problem is data mutation and look-ahead bias. Many metrics are retroactively revised as new information becomes available, meaning a backtest uses data that was not known at the time of the original trading decision, leading to inaccurate and overly optimistic results.

QWhat is Point-in-Time (PiT) data and how does it differ from standard data?

APoint-in-Time data is strictly append-only and immutable. Each historical data point reflects only the information that was known and published at that specific time, with no retroactive revisions. This prevents look-ahead bias in backtesting.

QHow did the performance of the strategy change when backtested with Point-in-Time data?

AThe performance was significantly worse. The PiT-based strategy failed to capture strong market upticks as effectively, leading to a meaningfully lower cumulative performance compared to the backtest using revised data.

QWhat is the key takeaway from the article regarding backtesting and data?

AThe key takeaway is that backtests will produce misleading results if they use revised data. Only immutable, Point-in-Time metrics ensure an accurate historical replay of what was actually knowable at the time, preventing look-ahead bias.

Пов'язані матеріали

Platform Token Soars 15x in Half a Month, Pons Tops Robinhood Chain Charts for Both Token Launches and Trading

In just half a month, the Pons platform token (PONS) surged over 15x in value as Pons solidified its position as the leading token launch and trading platform on Robinhood Chain, capturing both the highest daily token creation volume and transaction volume. Following the exit of previous leader NOXA, competition initially favored Flap before Pons emerged dominant around mid-July. By July 26th, Pons accounted for 77.1% of total trading volume across all Robinhood Chain launchpads. Pons's success is attributed to its streamlined, one-transaction process for deploying a token contract and its corresponding Uniswap V3 liquidity pool simultaneously, eliminating the need for bonding curves or complex migrations. This simplicity, combined with low creation costs and immediate tradability, attracted significant creation activity and speculative trading. The meteoric rise of its native token, PONS, further fueled platform growth. A tokenomics model directing 80% of protocol fees to buy back and burn PONS created a reinforcing cycle: platform usage boosted PONS value, which in turn attracted more users. Looking ahead, Pons V2 aims to expand beyond meme tokens by integrating support for paying fees in stablecoins (USDG) and RWA assets, aligning with Robinhood Chain's broader focus on on-chain finance and stock tokens.

Odaily星球日报6 хв тому

Platform Token Soars 15x in Half a Month, Pons Tops Robinhood Chain Charts for Both Token Launches and Trading

Odaily星球日报6 хв тому

Qualcomm Chip Price Hike Deals a Blow to Android Phones

Qualcomm has officially announced a new round of price increases for its entire chip portfolio, effective September 1. The hikes, reaching up to 18% for the flagship Snapdragon 8 Elite Gen 6 Pro, follow similar moves by MediaTek, intensifying cost pressures on the already strained smartphone industry. CEO Cristiano Amon confirmed the plan, citing the need to offset rising industry-wide costs and restore declining profit margins. Qualcomm's Q3 FY2026 results showed a 25% drop in net profit, with mobile revenue plunging 20% year-over-year, hitting its lowest level since 2021. The surge in AI computing demand has led memory manufacturers to prioritize HBM production, creating a shortage in general-purpose DRAM and NAND Flash chips. Their prices soared by 93%-98% and 55%-60% respectively in Q1 2026, causing the memory cost share in smartphones to jump from 10%-15% to over 30%. Coupled with the soaring cost of advanced nodes like TSMC's 2nm and packaging, overall chip costs have reached historic highs. These upstream pressures are forcing downstream smartphone brands like Xiaomi, OPPO, and vivo to cut orders for mid-to-low-end models by up to 20% and use cost-saving measures like older chipsets. Reportedly, the Snapdragon 8E5 will be repurposed as a "long-lasting" chip for sub-brand phones in H2 2026. Amid this cost crisis, the Android market remains sluggish. Q2 2026 smartphone shipments in China fell 4.3% year-over-year, marking five consecutive quarters of decline. Major Android brands saw market share drop, while Huawei and Apple, with their in-house chip advantages, gained share. Qualcomm is diversifying into automotive and IoT sectors to reduce reliance on smartphones, but these new segments cannot yet fill the mobile revenue gap. Industry observers warn that the full impact of component cost hikes will hit in the second half of 2026, likely leading to higher-than-expected price increases for Android flagships and a further contraction in the Chinese smartphone market.

marsbit16 хв тому

Qualcomm Chip Price Hike Deals a Blow to Android Phones

marsbit16 хв тому

Breaking: GPT-5.6 Prices Slashed Effective Today

OpenAI has announced significant price cuts for its GPT-5.6 model API, effective immediately. The entry-level **GPT-5.6 Luna** sees the most drastic reduction, with input prices dropping 80% to $0.20 per million tokens and output prices falling to $1.20 per million tokens. The mid-tier **GPT-5.6 Terra** is reduced by 20%, now costing $2.00 (input) and $12.00 (output) per million tokens. The flagship **GPT-5.6 Sol** maintains its original price but introduces a new **Fast mode**, offering speeds up to 2.5 times faster for double the cost. The company attributes these price reductions to efficiency gains achieved through **GPT-5.6 Sol's own involvement in optimizing its production systems**. The model assisted in rewriting GPU kernels and improving speculative decoding, leading to a 20% reduction in end-to-end service costs and over 15% improvement in token generation efficiency. OpenAI emphasizes this process remained human-led. A key focus of the降价 is to lower the barrier for running **AI agent workflows**. By making the capable, tool-calling Luna model significantly cheaper, OpenAI aims to enable more frequent use in cost-sensitive, high-volume tasks like code review and monitoring. This creates a potential feedback loop: model-assisted efficiency gains lead to lower costs, which enables broader agent deployment, which in turn drives further optimization. The new pricing and features will also apply to Codex and ChatGPT Work subscriptions. The changes intensify competition in the large language model market, with OpenAI directly challenging rivals like Anthropic to respond.

marsbit46 хв тому

Breaking: GPT-5.6 Prices Slashed Effective Today

marsbit46 хв тому

South Koreans' 'Gambling Nature' is Actually Forced by Life

This article explores how systemic pressures in South Korea, rather than inherent "gambling" tendencies, drive widespread speculative financial behavior. It begins by noting the high frequency of flights from South Korea to Macau, symbolizing the search for outlets beyond domestic restrictions. The core argument is that ordinary life goals—stable employment, home ownership, and financial security—have become increasingly tied to asset markets due to structural economic factors. South Korea's development model, historically reliant on corporate leverage (chaebols), has evolved into a society where household debt and personal leverage are normalized as pathways to social mobility. Key mechanisms discussed include: * **Housing Policy:** Government measures to improve affordability, like extending mortgage terms to 50 years and the unique *jeonse* (key money) rental system, embed high leverage into the housing market. * **Financial Products:** The recent approval and explosive popularity of single-stock 2x leveraged ETFs (e.g., on Samsung and SK Hynix), easily accessed via mobile apps, lowered barriers to high-risk trading. * **Social Pressure:** Media narratives around soaring corporate profits (e.g., SK Hynix) and employee bonuses create a fear of missing out, pushing individuals to use leverage to "catch up." The article concludes that this "leveraged life" is a product of institutional history and policy choices. When traditional paths to success feel constrained, and policy facilitates debt-based solutions for housing and investment, speculative behavior becomes a rational, if risky, strategy for many. The rapid cycle of regulatory approval for leveraged ETFs followed by a market crash and official apology in mid-2026 exemplifies the system's inherent contradictions. Ultimately, the "bet" is not just on assets, but on using future earnings to secure a place in the present society.

marsbit46 хв тому

South Koreans' 'Gambling Nature' is Actually Forced by Life

marsbit46 хв тому

Торгівля

Спот
活动图片