Authors: Caleb Shack, Alana Levin
Translation: Jiahuan, ChainCatcher
At Variant, we are passionate about exploring emerging markets. New asset classes, financial products, asset issuance, expanded market access, and novel ways of participation are all deeply rooted in our founding DNA.
Lately, we have been thinking about markets built around computing power.
Access to computing power is a vast and growing field, and one that could arguably be ripe for further financialization.
However, the supply and demand dynamics of computing power are highly complex, opaque, and constantly evolving. Many questions remain unanswered regarding market timing, structure, and even the precise asset being traded.
In the midst of debating and exploring these questions, we want to share an emerging analytical framework as a window into thinking about computing power markets.
The birth of new futures markets typically requires five prerequisites:
- Fragmentation on the supply side
- Ongoing price volatility
- Some form of physical settlement infrastructure
- Standardized, tradable units
- Lack of alternatives for price discovery or hedging
Our framework examines the current landscape of computing power markets through these five dimensions. We draw on historical analogies to explain the importance of each and to predict when the market might reach its inflection point.
Summary of Key Points
A quick glance at the framework reveals that today's computing power market still lacks the maturity needed to sustain a robust futures market.
(Nevertheless, the market is dynamic, and many startups are actively working to change this; if you are building in this space, get in touch!)
Here is our current scorecard for computing power futures across the five dimensions:
- Supply Fragmentation: 🔴 Supply is highly monopolized by hyperscale cloud providers
- Price Volatility: 🟢 GPU prices are highly volatile
- Physical Settlement Infrastructure: 🟢 Physical settlement infrastructure exists at the OTC broker level
- Standardization: 🔴 Computing power lacks standardized, tradable units
- Lack of Alternatives: 🟡 Vertically integrated suppliers can hedge internally; others are forced to go long
1. Supply Fragmentation (Score: 🔴)
Futures markets are mechanisms for price discovery.
Under a monopoly supply, price discovery becomes unnecessary because prices are determined by a few large suppliers, eliminating any pricing uncertainty.
History is filled with examples of this.
Oil futures only grew robust after supply-side cartels (like the "Seven Sisters," the seven major multinationals that dominated global oil in the mid-20th century) weakened.
Electricity markets only formed after governments deregulated, broke monopoly pricing, and allowed independent producers to enter the market. Supply fragmentation drove futures markets to become important venues for price discovery.
Examining today's computing power dynamics, the supply side appears relatively concentrated.
The four major cloud giants (like AWS, Azure, GCP, Oracle) control roughly 78% of self-built critical IT power capacity globally, and about 69% of H100 supply (according to the original text's calculations, assuming 12.4 million H100s in Q4 2025).
From this, we infer they also dominate the supply of global compute hours. The supply is not fragmented.
Nevertheless, we are considering factors that might shift this dynamic.
New cloud providers are emerging. New chip architectures create opportunities for other vendors to gain market share.
Some long-term contracted capacity by major labs might ultimately be underutilized, meaning those labs could eventually become compute suppliers or sellers on the market.
So, while we are uncertain about the degree of concentration in the future, our current assessment is: the supply side is trending towards becoming more fragmented than it is today.
2. Price Volatility (Score: 🟢)
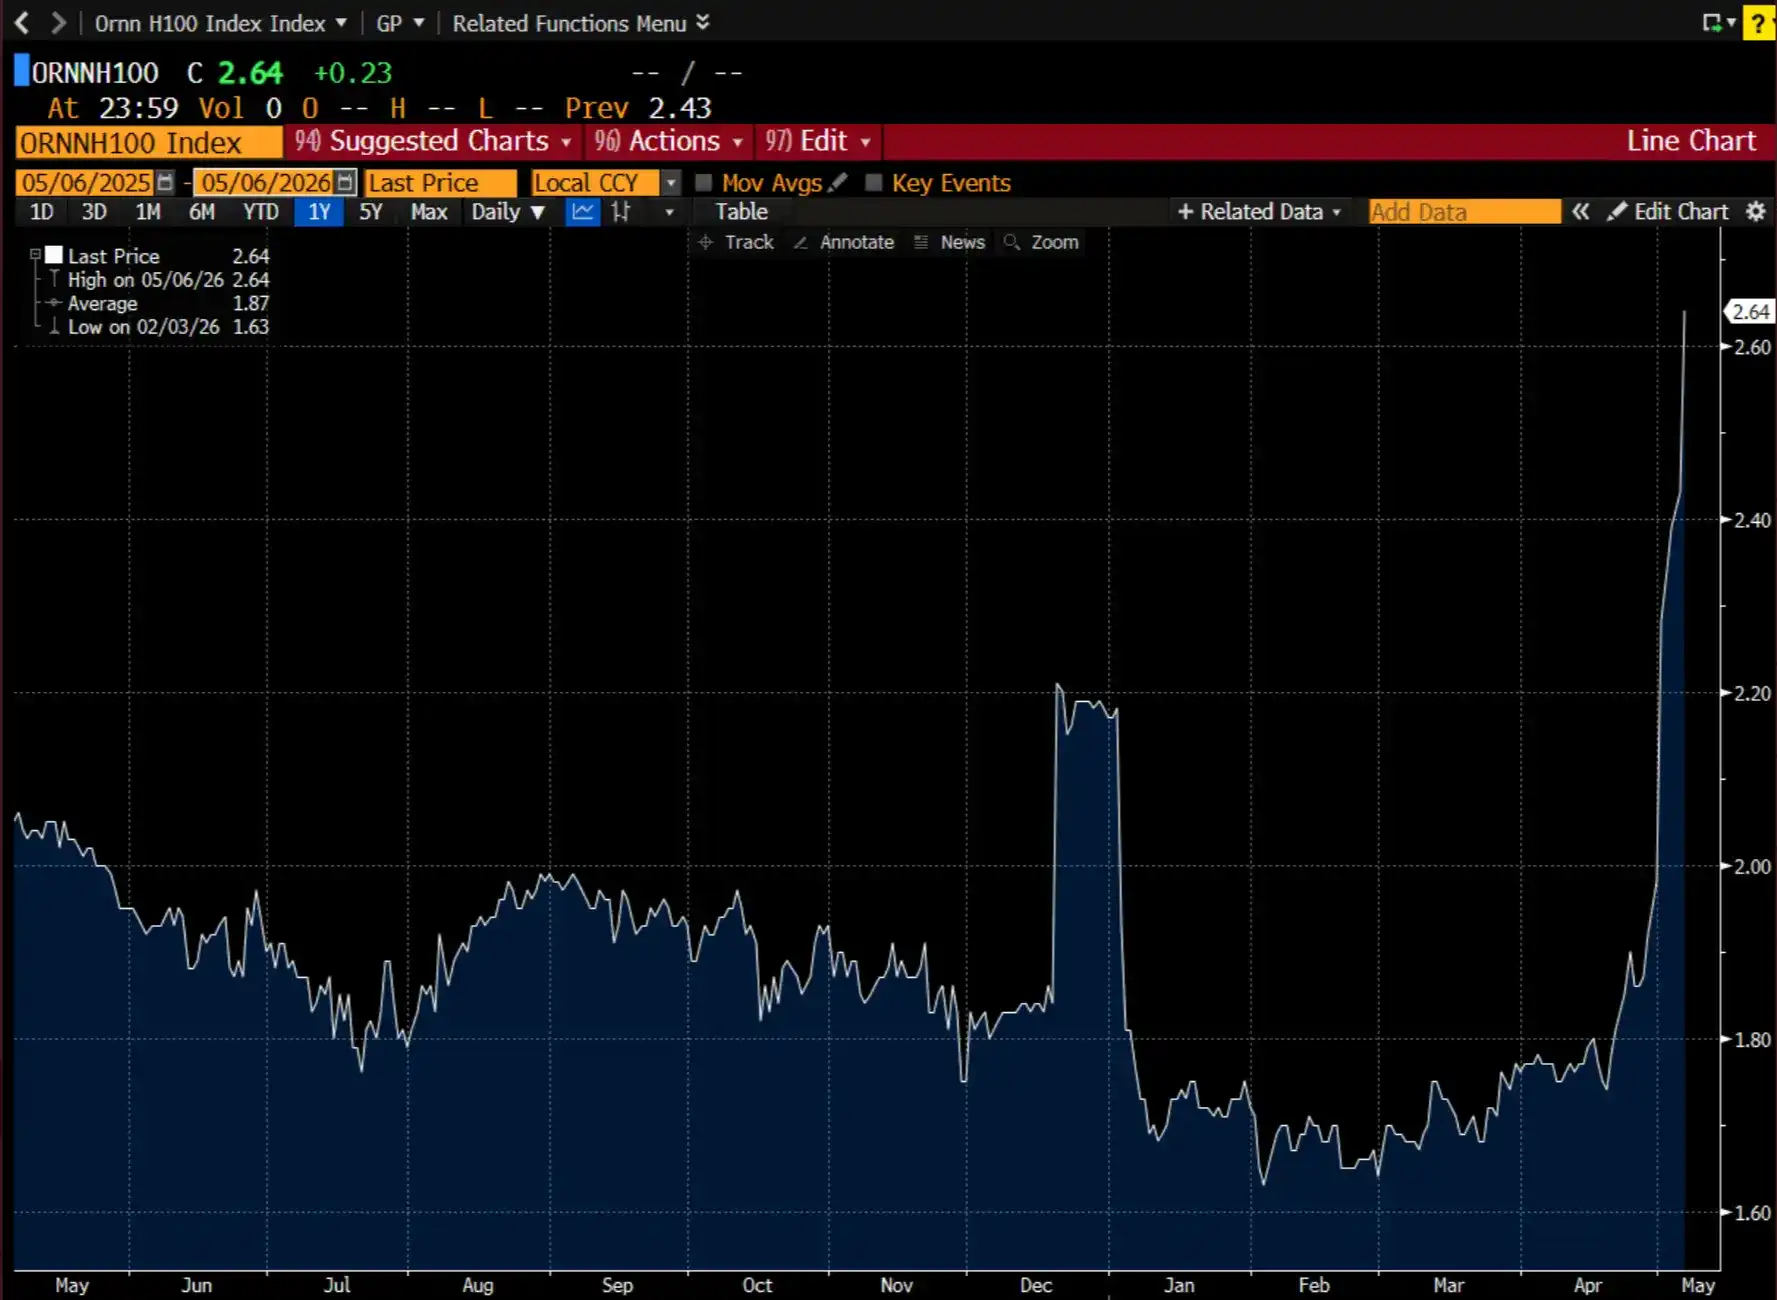
The Ornn H100 Index on the Bloomberg Terminal
Another prerequisite for a futures market is that the underlying asset exhibits significant volatility.
Without meaningful price uncertainty, hedgers lack the incentive to protect against volatility risk.
Volatility also attracts speculators, who profit from large price swings. If a market is stable or predictable, speculators will look elsewhere.
We saw this in the 1950s oil market.
During an oil glut, the Soviet Union posted prices below the "Seven Sisters'" posted prices. The "Seven Sisters" responded by lowering prices in the Middle East region without informing the producing countries there.
The resulting shockwaves led to nationalization of Middle Eastern oil, the formation of OPEC, and increased global oil price uncertainty. The oil volatility subsequently triggered electricity market volatility in the 1970s.
Compute pricing has been and will continue to be volatile.
The rate at which new supply comes to market is uncertain. New chips or data center architectures could improve token efficiency for specific tasks. Demand continues to surge and expand in unpredictable ways.
We are very confident this prerequisite is already met today.
3. Physical Settlement Infrastructure (Score: 🟢)
For markets to operate efficiently, buyers must be confident they can receive and consume the underlying instrument at the specified date and time.
This requires infrastructure: mechanisms for aggregating supply, ensuring reliable delivery, clearing trades, handling collateral, and managing settlement. This work is typically done by intermediaries or brokers.
In electricity markets, this is handled by Independent System Operators, which act as neutral, quasi-governmental third parties.
Today's compute market lacks a direct equivalent. However, our hypothesis is that compute brokers or OTC desks are beginning to (and increasingly are) taking on many of these functions.
Today, brokers are building indices and data aggregation tools around compute purchase and lease agreements to anchor market prices.
Ornn and Silicon Data have begun publishing price data for datacenter-grade GPUs.
The broker community is also converging on contractual agreements, akin to how SAFE agreements standardized early-stage financing terms. These tools polish the underlying physical settlement infrastructure—coordination that largely used to happen in group chats.
We give a green score for physical settlement infrastructure because it lays the groundwork for price discovery.
But it is far from robust compared to mature spot markets. These purchases occur at the infrastructure layer, and not all market participants have the right to resell publicly after buying. We are closely watching developments for new market creation at this layer.
4. Standardization (Score: 🔴)
A primary challenge for new commodities is often how unique and non-fungible their units are.
Too many variables can fragment liquidity across many markets or introduce too much basis risk to satisfy most hedging and delivery needs.
For example, crude oil is measured by density and sulfur content, which varies by origin.
NYMEX found product-market fit with its WTI index (light, sweet crude) because it locked in a standard that served global upstream markets and was even used by downstream markets (like airlines) for hedging.
Electricity is standardized by region, accounting for supply and demand fluctuations that vary by factors like temperature and population density.
The compute market lacks a level of standardization that meets general hedging needs.
The challenge is: an H100 instance is not always equivalent to another H100 instance.
Factors like region (and thus local power input), rack configuration (i.e., hardware and networking components), and tenor (i.e., contract duration) exacerbate pricing differences for GPU instances.
However, we see early signs of standardization, especially when demand stems from long-tail (i.e., non-frontier lab) inference.
Unlike training, inference workloads require far fewer nuances and can run on distributed rather than co-located deployments.
If inference supply fragments across many providers—for example, as open-source weight models gain share—standardization may emerge.
5. Lack of Alternatives (Score: 🟡)
This is a subtle but often overlooked point in market formation.
Futures markets are built to serve hedgers. If there is a substitute with sufficient liquidity and negligible basis risk, the alternative contract will go unused.
A textbook example is the lack of adoption of aviation fuel futures—because WTI and other upstream indices sufficiently served demand.
In the weather-related domain, temperature-based futures failed because market participants found hedging the outcome (electricity) more efficient than hedging the cause (temperature).
Today, model providers hedge compute risk via long-term lease agreements or joint ventures, often structured as take-or-pay deals, swapping spot price exposure for counterparty risk.
Hyperscalers typically own the GPUs they deploy.
On the other hand, the long-tail suppliers, lacking the contractual leverage for favorable lease terms and the capital to build their own vertically integrated infrastructure, bear the brunt of spot market volatility.
From a market perspective, there is no alternative; however, participants controlling supply can hedge internally through vertical integration.
Overall Assessment
Looking at the combined scorecard, it might be early for compute to support a robust futures market.
The market has the volatility to attract speculators and early-stage settlement infrastructure to support trading, but it lacks the supply fragmentation and standardization needed for genuine price discovery at scale.
Most trading happens OTC.
Brokers are building price feeds, Ornn and Silicon Data are publishing indices, and group chat deals are being formalized into contract templates.
This isn't meaningless, but it's not yet a formed market like WTI or PJM. Volume is too small, contracts are too bespoke, and supply is too concentrated for existing infrastructure to clear at scale.
The right way to read this framework is as a diagnostic tool, not a conclusion. It tells us what's missing, not what's impossible.
Open Questions
The market will evolve in ways we are not certain of today.
We have many unanswered questions and some preliminary hypotheses. These hypotheses are tentative and need to be further validated or disproven. Below, we articulate the strongest argument for these assumptions.
▍In the next 1-2 years, will the market supply side become more fragmented or more concentrated?
We expect moderate fragmentation.
New cloud providers are bringing new capacity online faster than any other category.
As power becomes a core constraint, new regions are coming online, benefiting operators who can build capacity near cheap power, not near existing hyperscaler footprints.
Fortune 2000 companies are even standing up small-scale data centers. Expansion in this sector seems inevitable.
However, standard business models rely on large, long-term contracts with reliable counterparties like hyperscalers and frontier labs.
Cloud brokerage service providers like Hyperbolic and SF Compute are doing the opposite, offering hourly-rate capacity.
These serve the long-tail compute needs of AI-native startups, application-layer companies running inference on open-source weights, and research labs without frontier-level budgets.
We believe adoption of open-source weights, in particular, will lead to further fragmentation of compute capacity—as supply "de-verticalizes" from frontier labs and hyperscalers.
▍How will standardization unfold?
Index providers are setting standards around hourly GPU instance costs.
These data sources represent rough estimates, not precise prices.
Instance prices vary due to numerous factors, including region, rack configuration, and tenor, making a standardized price difficult.
Rack configuration differentiation is particularly acute, a result of datacenters tailoring for bespoke workloads and hyperscalers optimizing for ecosystem lock-in rather than market uniformity.
Standards emerge when there is a unifying market demand.
The WTI standard gained adoption because it served a wide range of downstream refinery products like gasoline, diesel, and aviation fuel.
Today, compute demand is driven by AI training and inference workloads.
Training infrastructure is customized, optimized for long, compute-intensive tasks in large, centralized facilities, making underlying compute instances nearly non-fungible.
On the other hand, inference infrastructure requires simpler hardware specs and less power; it's optimized for latency, meaning infrastructure is distributed across regions rather than co-located.
Inference is homogenizing and is projected to comprise over 65% of AI compute demand by 2029. We suspect optimization around the compute infrastructure layer serving this market will lead to convergence in compute requirements among vendors.
If chip-level instances remain differentiated, another path to standardization could be hardware-level benchmarking.
Nvidia created the MLPerf benchmark for scoring inference and training performance across various model architectures.
In this vision, GPU instances would trade based on the quality and efficiency of their output, not their hardware specs.
▍What could prevent a standard from emerging in the next 1-2 years?
We think walled gardens and bespoke workloads will kill attempts at standardization.
In the next 1-2 years, hyperscalers and frontier labs will strive to maintain their dominance in AI infrastructure and model provision.
If the two don't decouple, they will maintain hardware based on their own needs, which vary by company. Adoption of new chip architectures will further fracture hardware specs, making standardization difficult.
▍How will open-source weights gain meaningful adoption?
This is the simplest path to compute market formation.
The two core bottlenecks facing these markets today are concentrated supply and lack of standardization.
Widespread adoption of open-source weights democratizes the ability to run inference.
This, in turn, creates incentives for independent operators to form and promotes infrastructure optimization tailored to those specific models.
We saw the same story in Bitcoin mining: open-source software gave rise to numerous miners and drove standardization around hardware configurations.
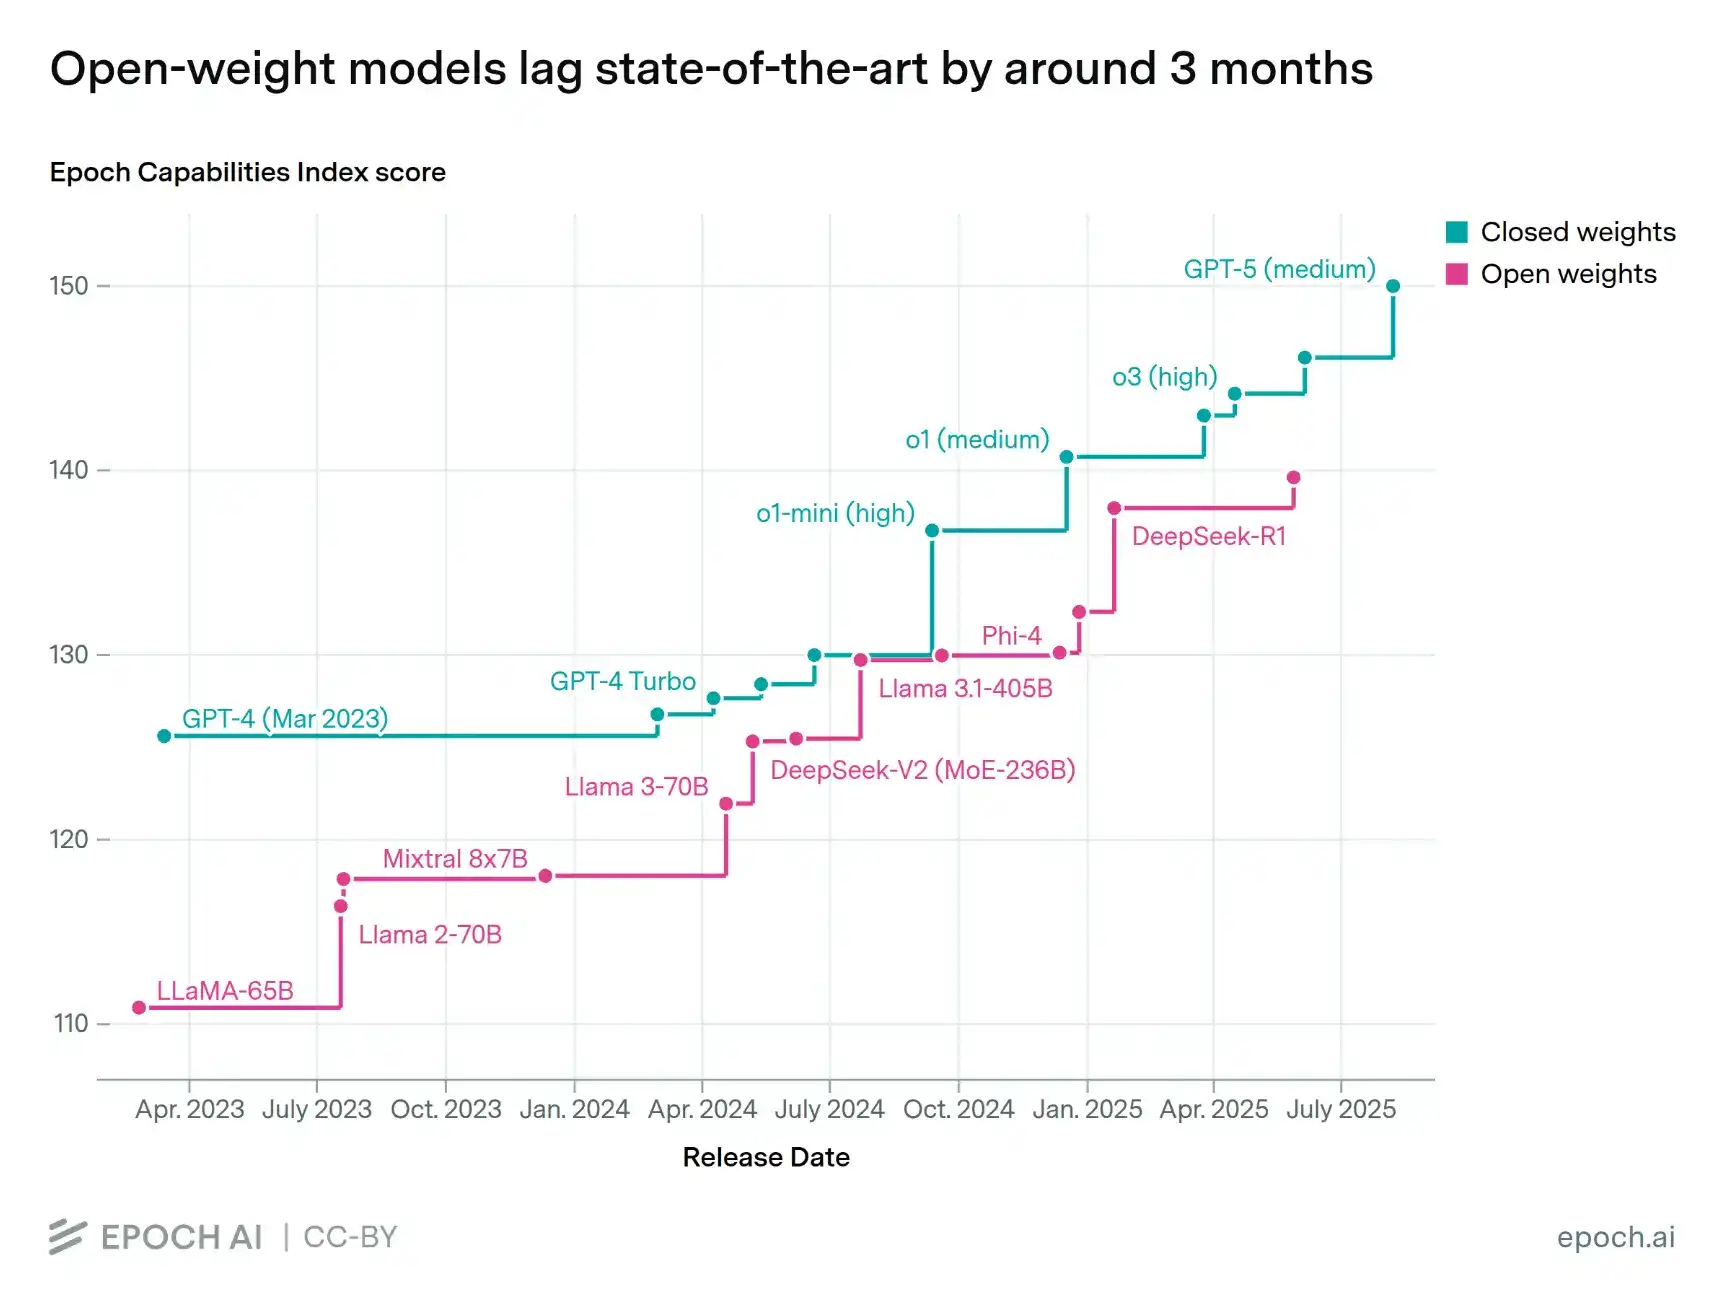
To date, open-source weights have lagged behind closed-source models in performance.
But if the trend continues, open-source weights will soon reach the performance thresholds we see in closed-source models today.
Enterprises have already begun broadly embedding closed-source models into their systems, witnessing significant productivity gains. In three months, a model that can deliver similar productivity gains might cost a fraction of today's price.
Still, most enterprises will likely opt for the best-performing model.
We believe a day will come when frontier closed-source models become too expensive for the tasks they perform, and companies will optimize intelligence deployment across different models.
It's worth remembering that frontier labs currently provide inference at a loss, and they must eventually raise prices to sustain operations. That will be open-source weights' moment.
▍What will the ultimate traded unit be?
Compute power can be roughly broken into three layers: Chip, Chip Instance-Hour, Token.
Chip layer — supply is highly concentrated.
ASML monopolizes the lithography machines used by TSMC, TSMC monopolizes the chip foundries used by Nvidia, and Nvidia monopolizes frontier chip design.
Moreover, a chip is only useful when plugged into power and kept online with high uptime. This leads us to believe a single, deliverable chip will not be the ultimate unit.
Chip Instance-Hour layer — refers to the period when a chip can be actually used.
This is arguably the most valuable state for a chip and is the core layer discussed in this article.
At this layer, as long as there is sufficient demand around compute resources, compute as a commodity will behave similarly to electricity.
We envision compute being traded similarly to electricity and other utilities: standardized in regional contracts (compute is a function of electricity), with spot and futures markets layered on top for hedging. This is feasible in the "chip instance-hour" format.
Token layer — is the downstream output of a compute instance and could also become the ultimate unit.
If tokens are the primary driver of compute instances, then token markets would offer the demand side a way to hedge costs and allow the supply side to lock in revenue.
The supply side could hedge costs via ongoing long-term contracts or vertical integration and remain concentrated.
However, tokens are not uniform across models. Each model has its own text tokenization standards and produces varied outputs, making them not fully interchangeable across use cases. Still, we are watching this space closely.