Waiting for Conviction

insights.glassnodeОпубліковано о 2026-02-25Востаннє оновлено о 2026-02-25

Анотація

Bitcoin remains in a fragile consolidation between $60k–$70k, showing signs of structural weakness despite finding temporary support. Nearly half of the circulating supply is held at a loss, indicating deep bear market conditions, though this often occurs in later stages of downturns. Large holders are not accumulating aggressively, and ETF flows have turned negative, reducing institutional support. Spot market selling is dominant, while derivatives have reset to neutral, shifting focus to spot demand. Options markets show defensive positioning with high demand for downside protection. A sustained recovery requires renewed institutional inflows, strong spot buying, and large-holder accumulation. Until then, the market remains vulnerable to further downside.

Since rebounding from the $60k region in early February, Bitcoin has entered a sideways consolidation phase. As outlined in Week 06 – Structural Weakness, this fragile range reflects a temporary equilibrium between seller exhaustion and localized support from long-term holders who accumulated within the same price band during H1 2024.

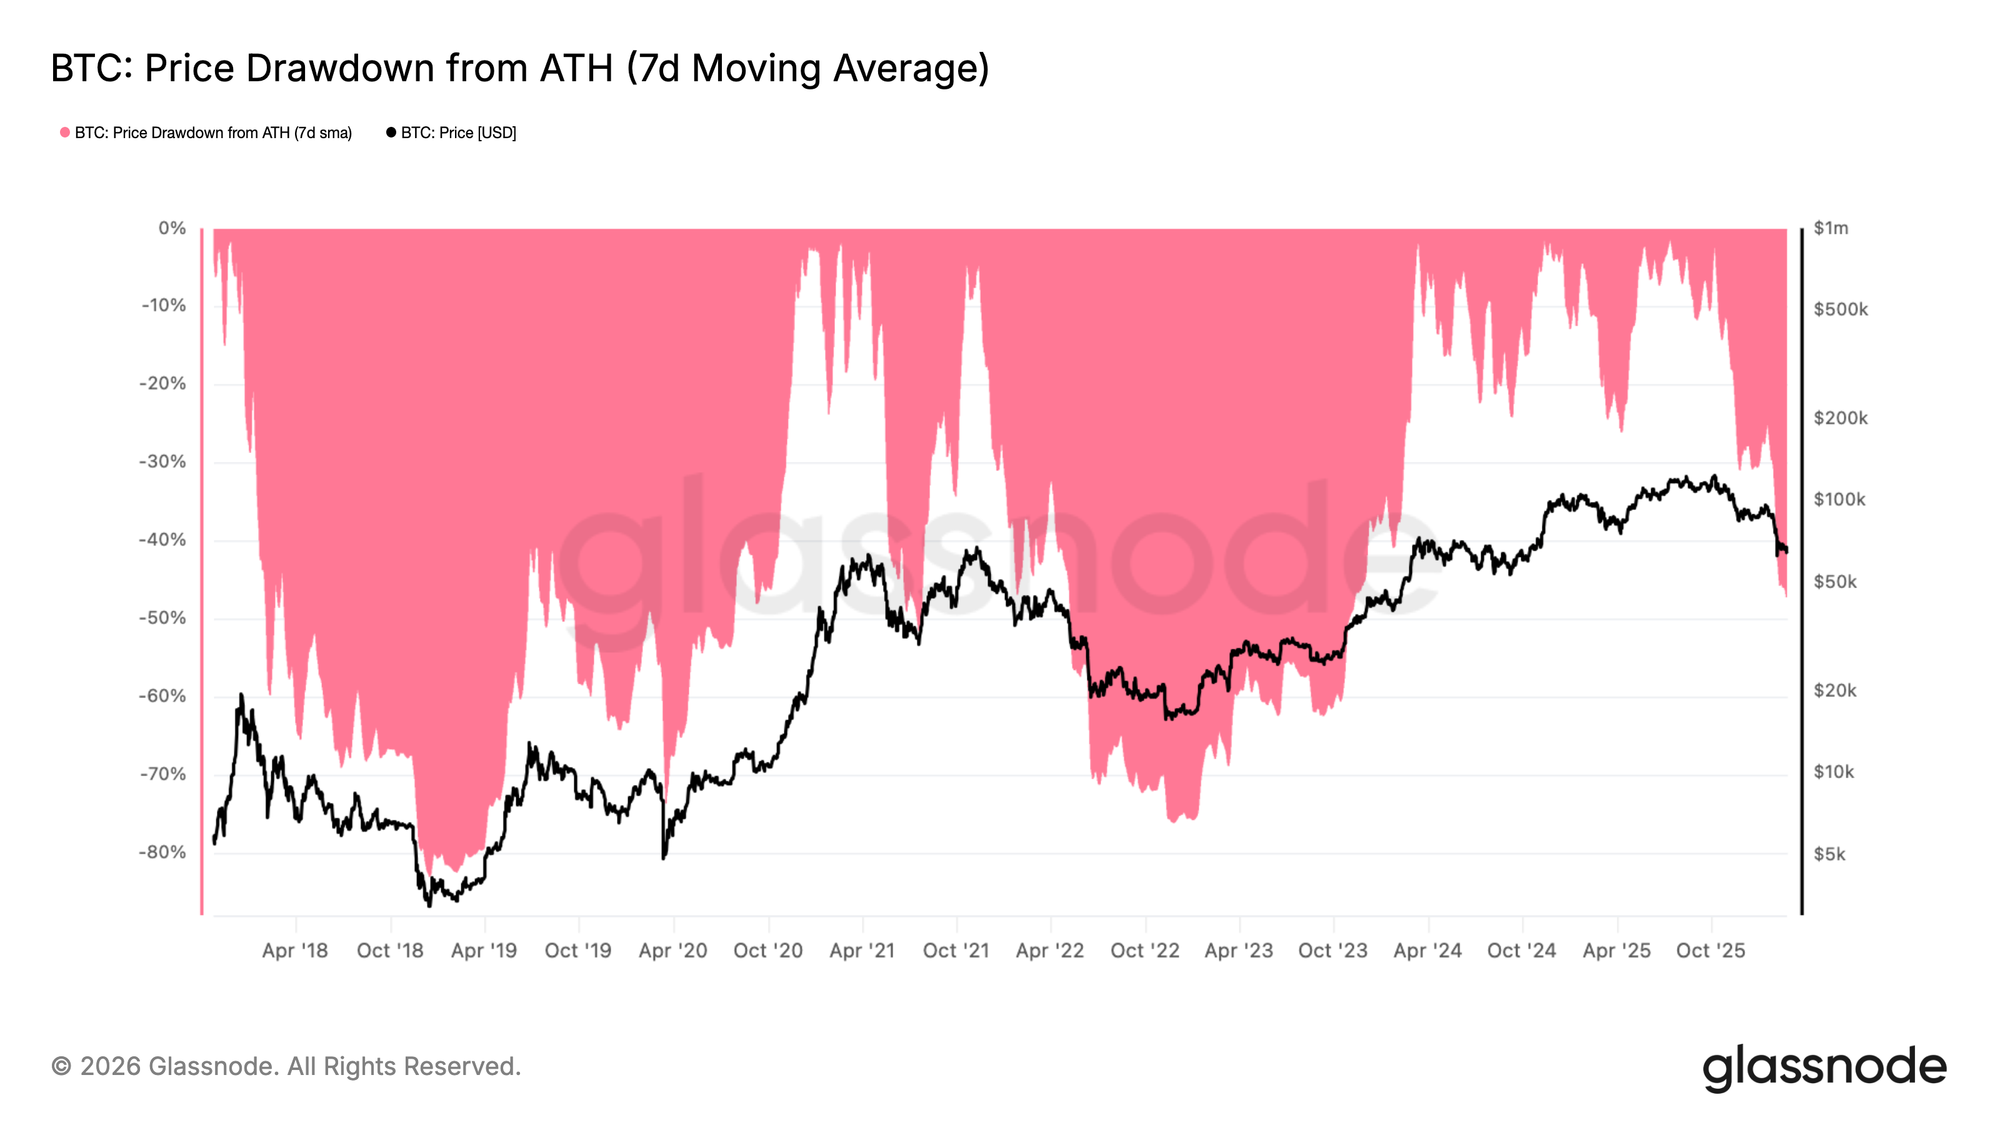
From a broader cyclical perspective, the 7-day moving average drawdown from the ATH currently sits at 47.3%, comparable to the early May 2022 range-bound phase that preceded further downside expansion. Historical analogues suggest that, at similar drawdown depths, time typically acts as a headwind rather than a tailwind for bullish continuation. Prolonged compression at these levels increases the probability that leveraged or structurally weak entities face mounting balance sheet stress.

Absent a decisive reclaim of higher price levels (>$70k) in the coming weeks, the risk of renewed contraction remains elevated.

Live Chart

Deep into Bear Market Territory

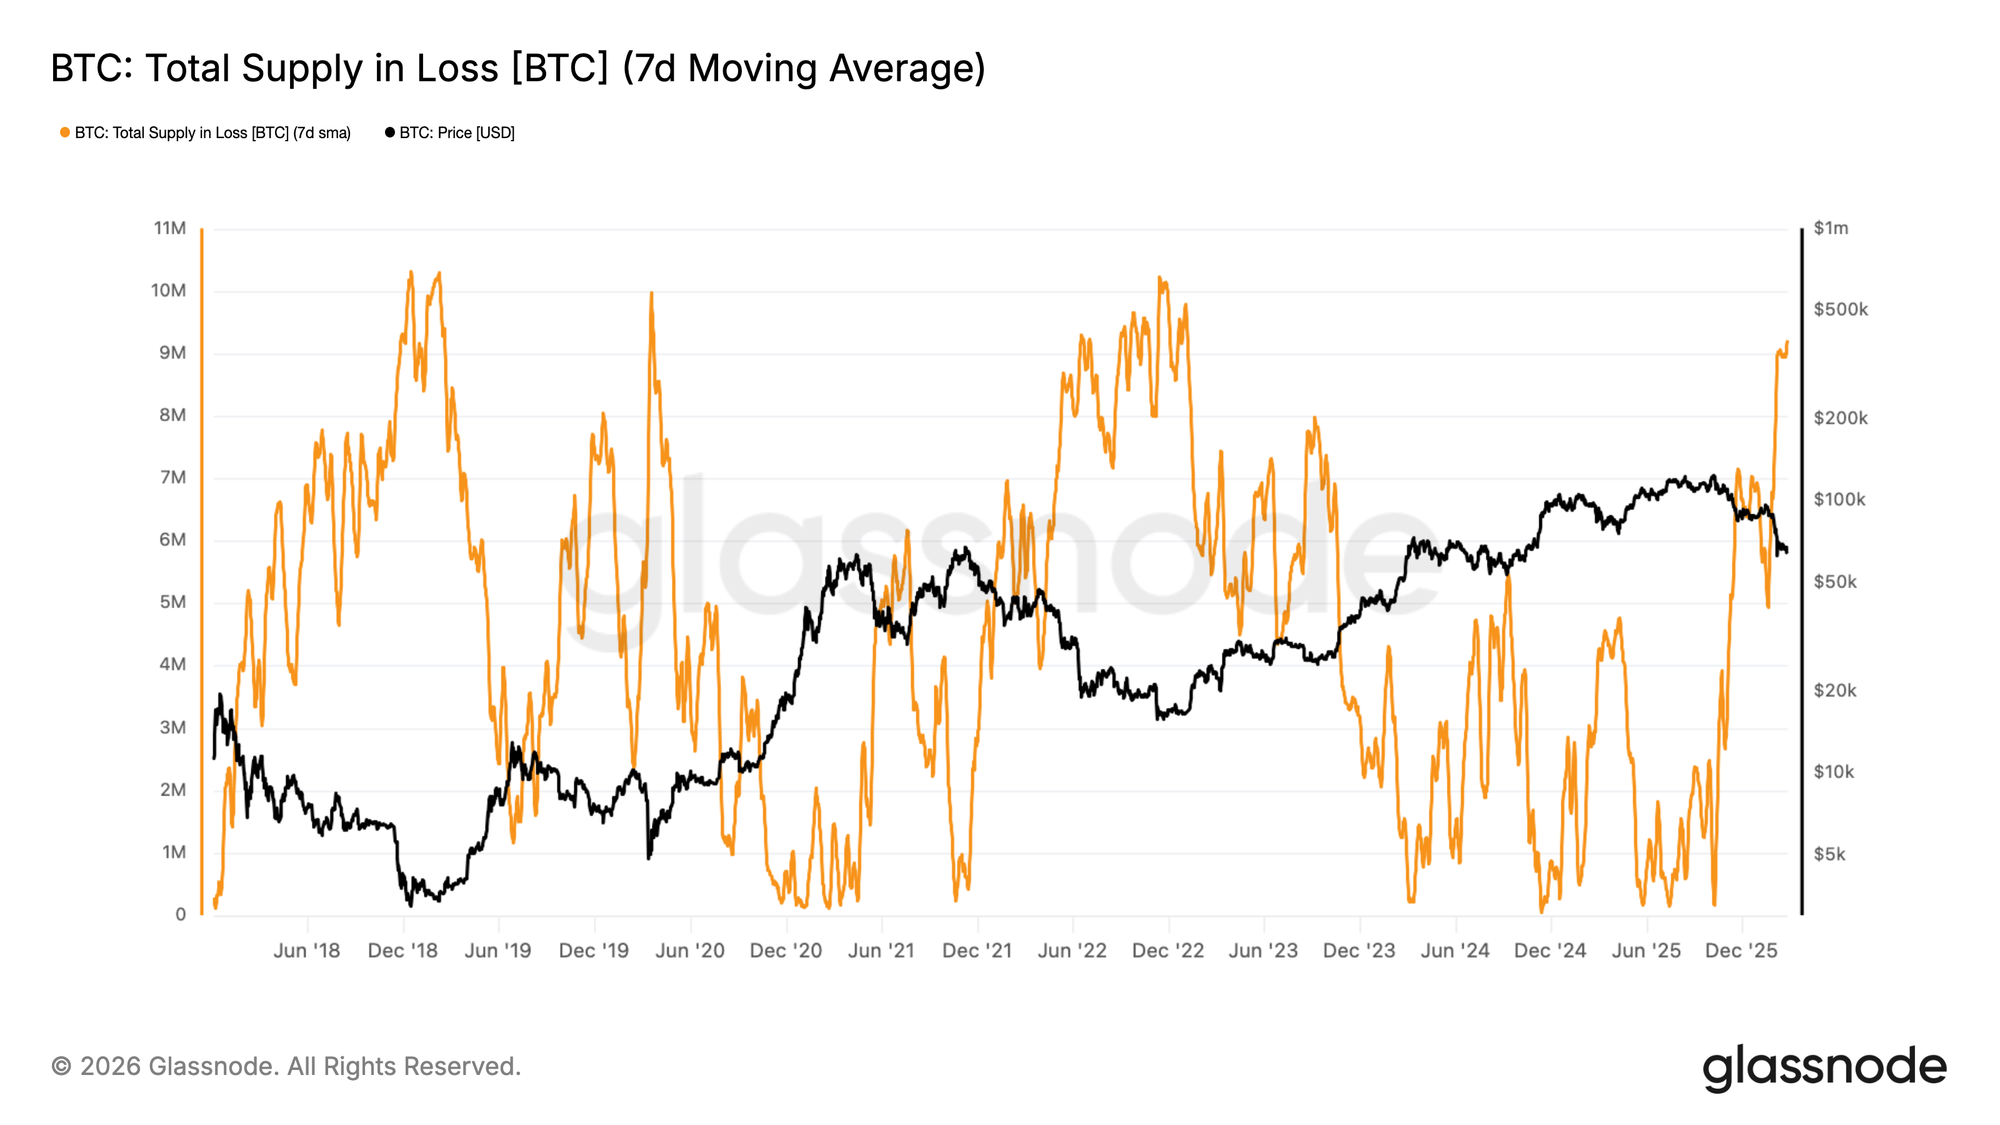
Extending this assessment of structural pressure, supply-side pain provides an additional lens into bear market depth. Total Supply in Loss measures the volume of coins whose acquisition price exceeds the current spot price, serving as a proxy for how widespread unrealized losses have become.

The 7-day moving average of this metric has risen to approximately 9.2M BTC underwater, indicating that nearly half of the circulating supply is now held at a loss. This aligns with prior bear market environments where drawdowns approached the 50% threshold and broad investor cohorts were under pressure.

While downside risk has not fully dissipated, such elevated levels of supply in loss historically characterize the latter stages of bear cycles rather than their early phase. In structural terms, the market appears closer to a potential bottoming range than to the initial onset of contraction, even as volatility and fragility persist.

Live Chart

Large Holders Remain Passive

Against this backdrop of widespread unrealized losses, the sustainability of the current range hinges on renewed accumulation. Having traded largely between $60k and $70k throughout February, the direction of the eventual breakout will depend on the intensity of demand from new buyers.

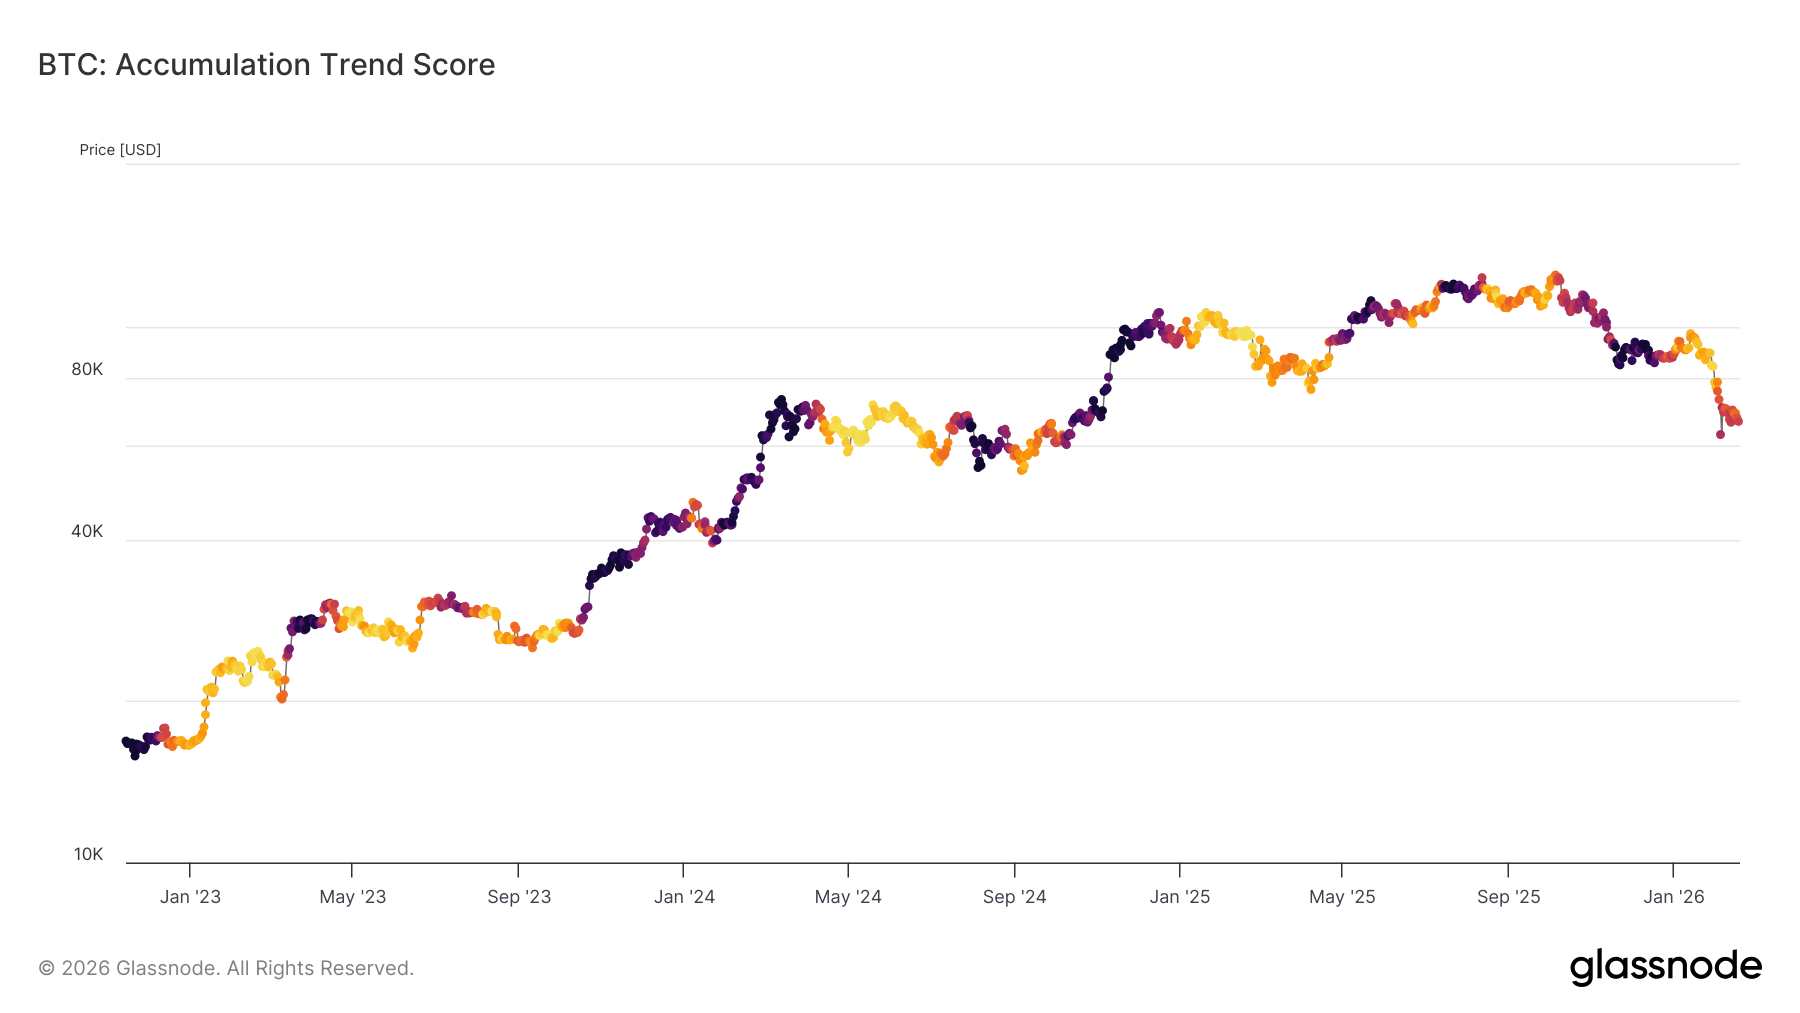
The Accumulation Trend Score offers a useful gauge of this behavior, measuring relative balance changes across wallet cohorts while assigning greater weight to larger entities. Since February 5th, Accumulation Trend Score has remained capped below 0.5, signaling a lack of aggressive accumulation, particularly among large holders.

This subdued participation suggests that, despite elevated supply in loss, conviction-driven buying has yet to materialize. Until larger wallets shift toward sustained accumulation, the probability of further downside contraction remains elevated before a more durable bottoming structure can form.

Live Chart

Transition to Excess Loss

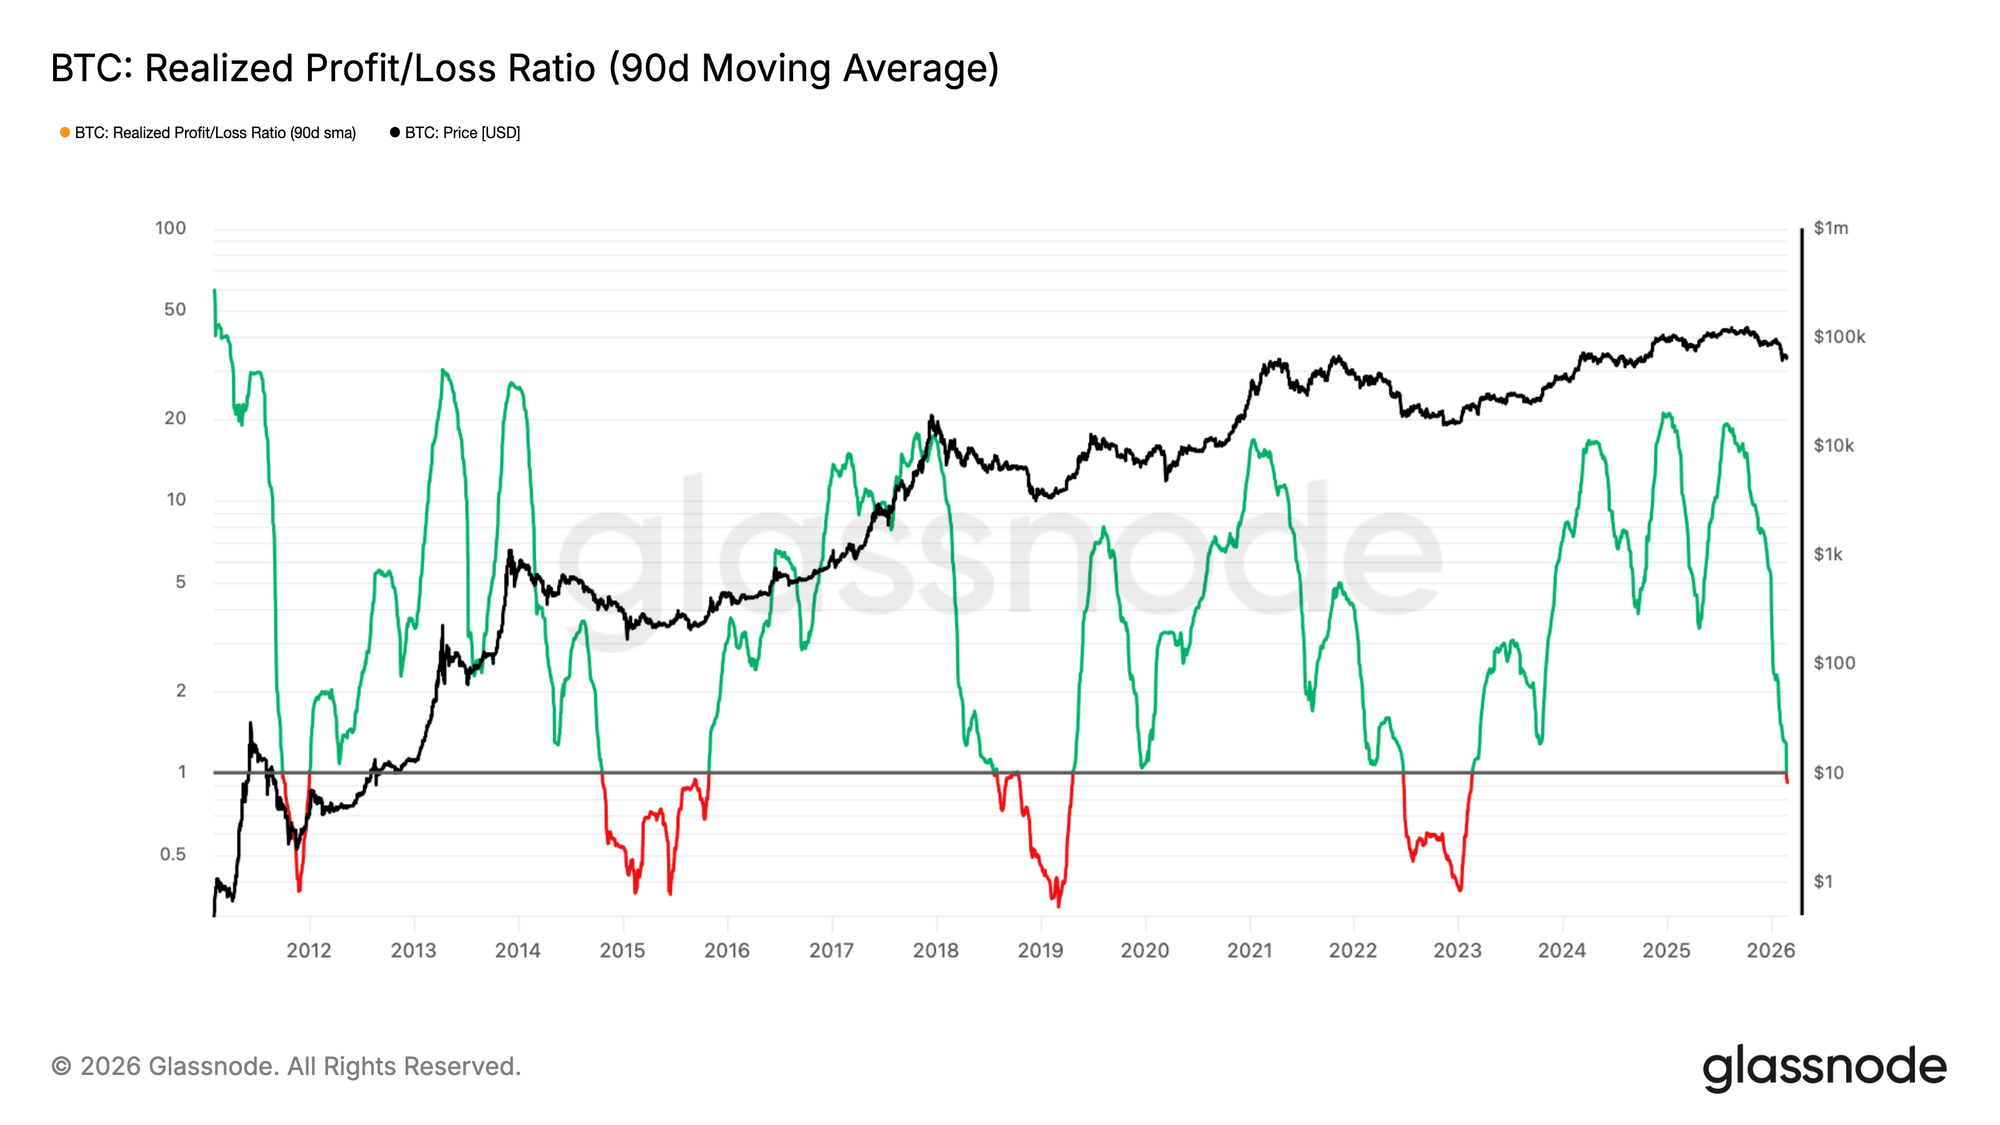
Reinforcing this muted accumulation backdrop, liquidity conditions have deteriorated further. The 90-day moving average of the Realized Profit/Loss Ratio, which compares the USD value of realized profits to realized losses, has now fallen below 1.0. This threshold is critical, as it marks the point where loss realization begins to dominate profit-taking, signaling a transition into an excess loss regime.

Historically, sustained breaks below 1.0 have persisted for six months or longer, reflecting prolonged periods of weak buy-side liquidity and constrained capital rotation. Only after a decisive reclaim of this level has the market typically entered a more constructive phase, characterized by renewed profitability and improving demand conditions.

Until the ratio stabilizes and trends back above 1, liquidity remains structurally impaired, limiting the probability of a durable recovery in the near term.

Live Chart

Off-Chain Insights

Spot CVD Bias Turns Sharply Negative

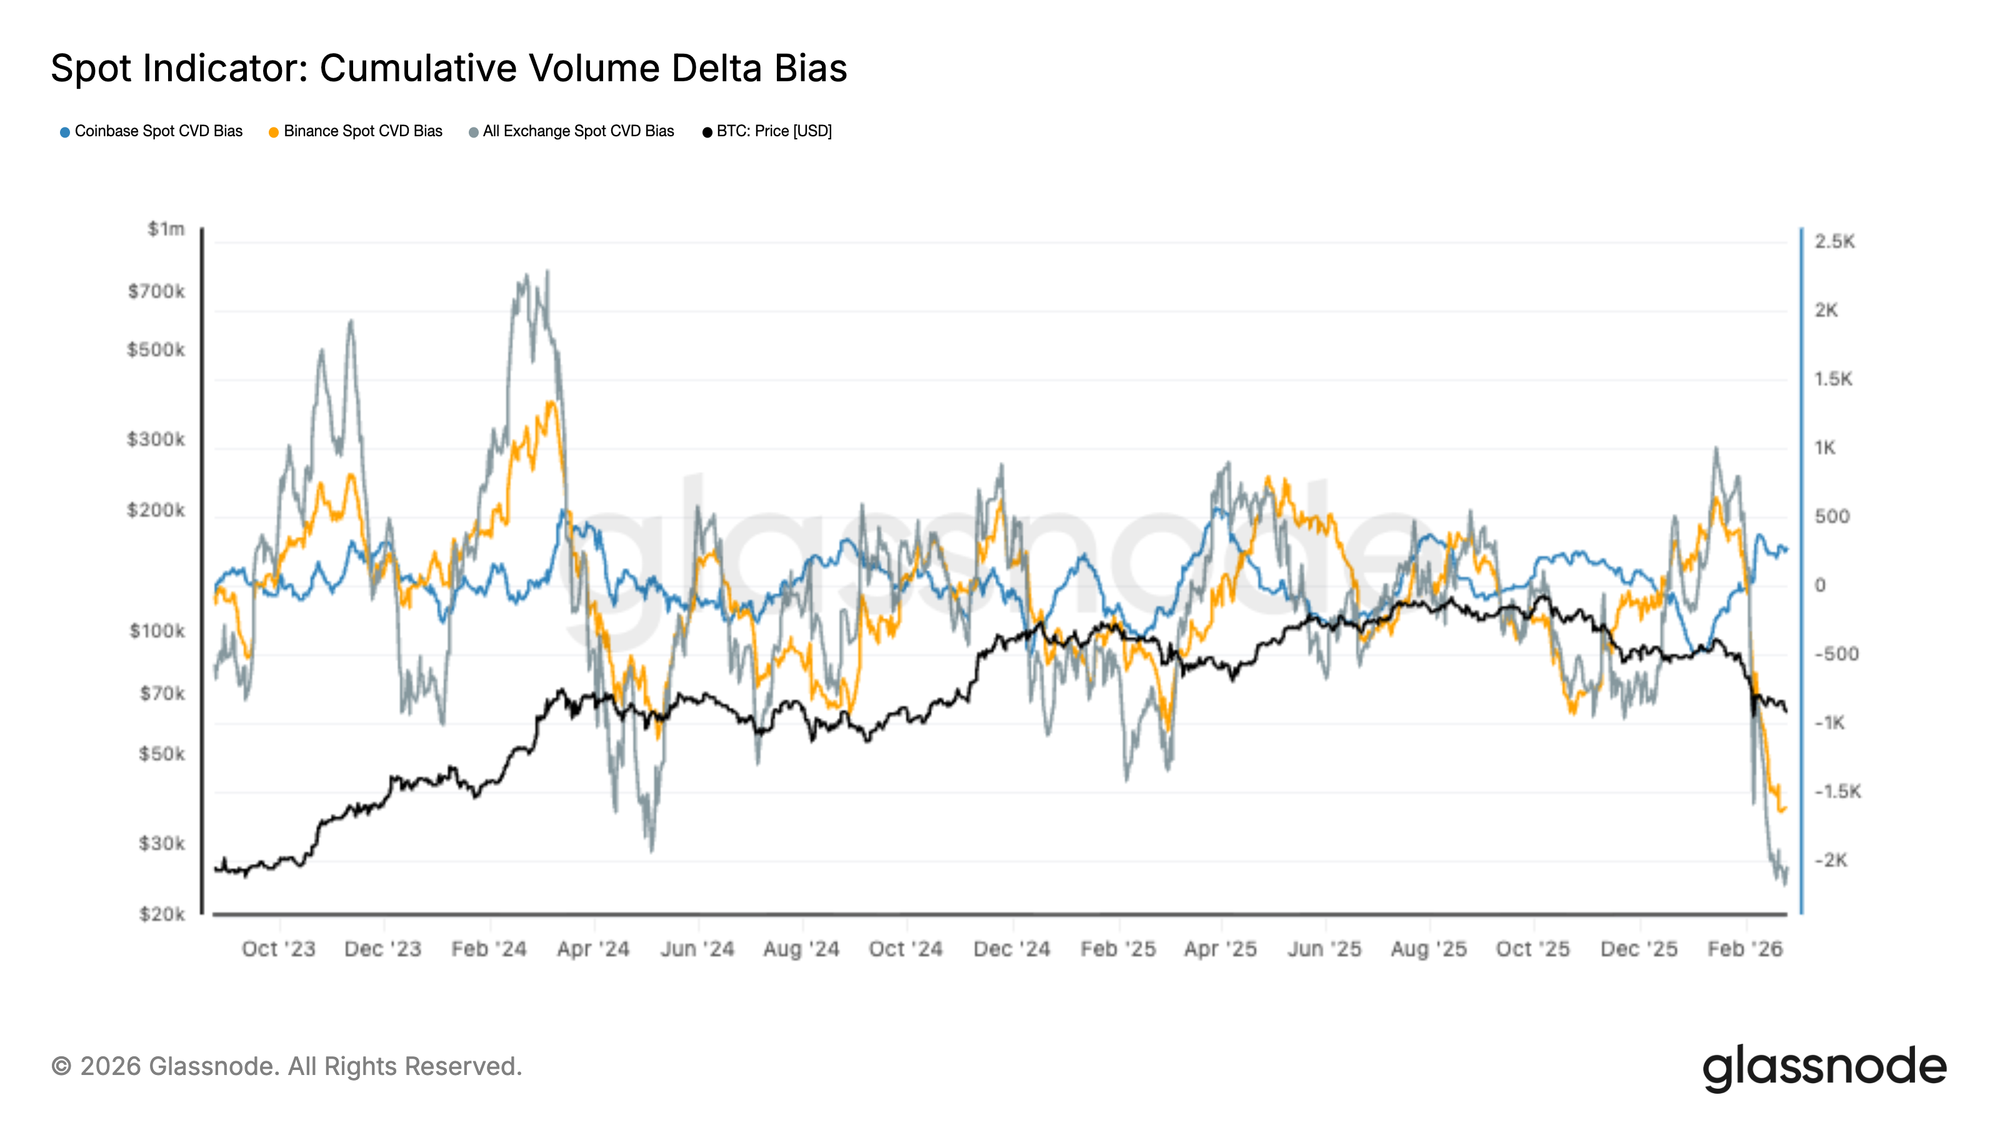
Spot markets have flipped decisively into sell-side dominance, with Cumulative Volume Delta (CVD) across all exchanges plunging to fresh cycle lows. Both Binance and aggregate spot flows show an aggressive wave of market sell orders, while Coinbase activity remains comparatively muted but unable to offset broader weakness.

The recent drawdown in price has coincided with one of the steepest negative CVD impulses of the past two years, suggesting the move lower is being driven by active distribution rather than passive liquidity gaps. Similar extremes in late 2023 and mid 2024 marked local exhaustion events, though follow-through depended on derivatives positioning and broader liquidity conditions.

With spot flows now deeply skewed to the sell side, the market appears reactive and fragile. Sustained recovery will likely require a clear shift back toward spot bid absorption, particularly across Binance and aggregate exchange flows, before constructive accumulation can be confirmed.

Live Chart

US Spot ETF Flows Extend Distribution Phase

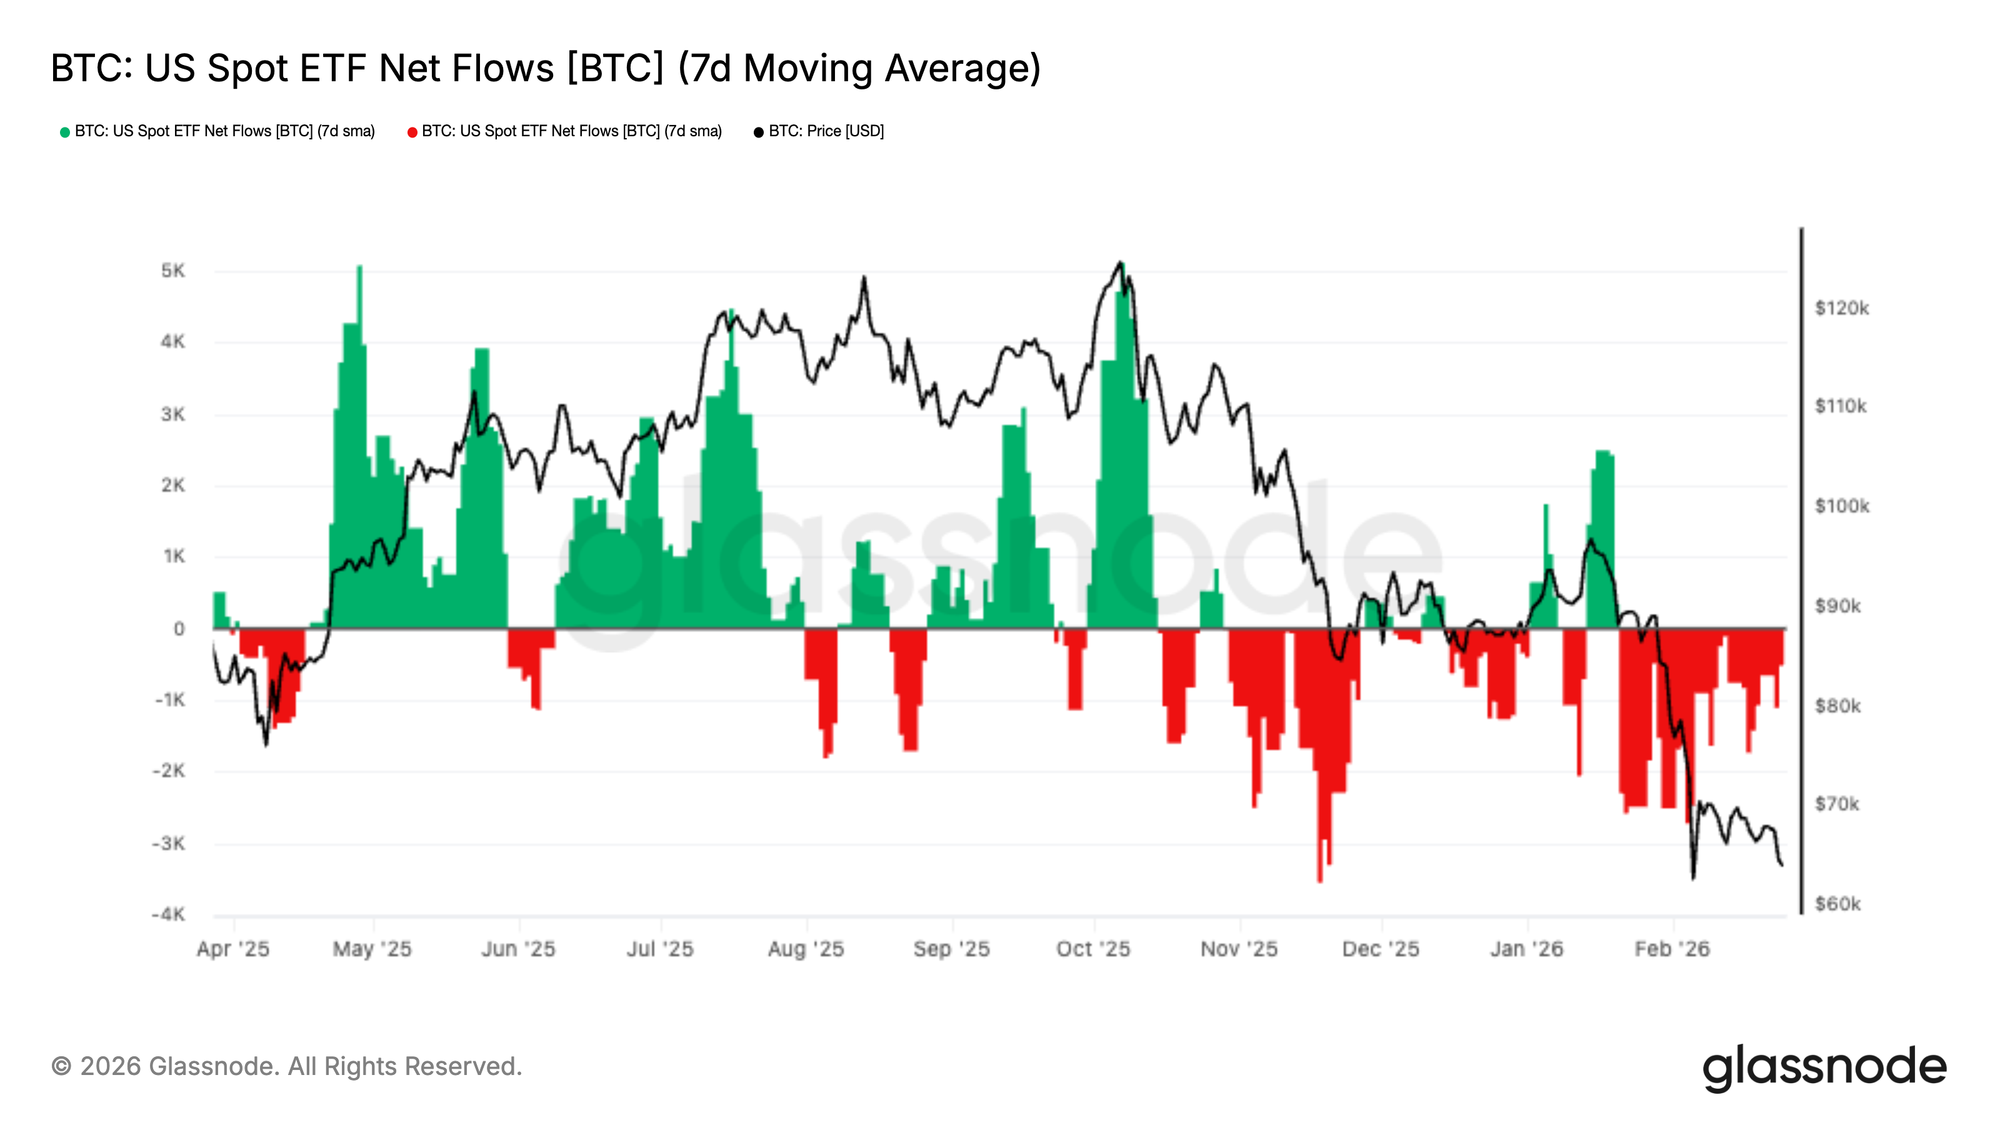
US Spot ETF flows have remained firmly in net outflow territory, with the 7-day moving average printing a persistent series of red bars since late November. Recent weeks have seen renewed acceleration in outflows, coinciding with BTC’s breakdown toward the $60k–$70k range.

Earlier in the cycle, strong inflow impulses consistently aligned with price expansions, particularly through May and October. In contrast, the current regime is characterized by sustained redemption pressure and a lack of meaningful bid support from ETF allocators.

This shift suggests institutional demand has cooled materially, removing a key structural tailwind that supported prior rallies. Until flows stabilize or return to sustained net inflows, price action is likely to remain reactive and vulnerable to further downside pressure.

Live Chart

Funding Rates Remain Neutral

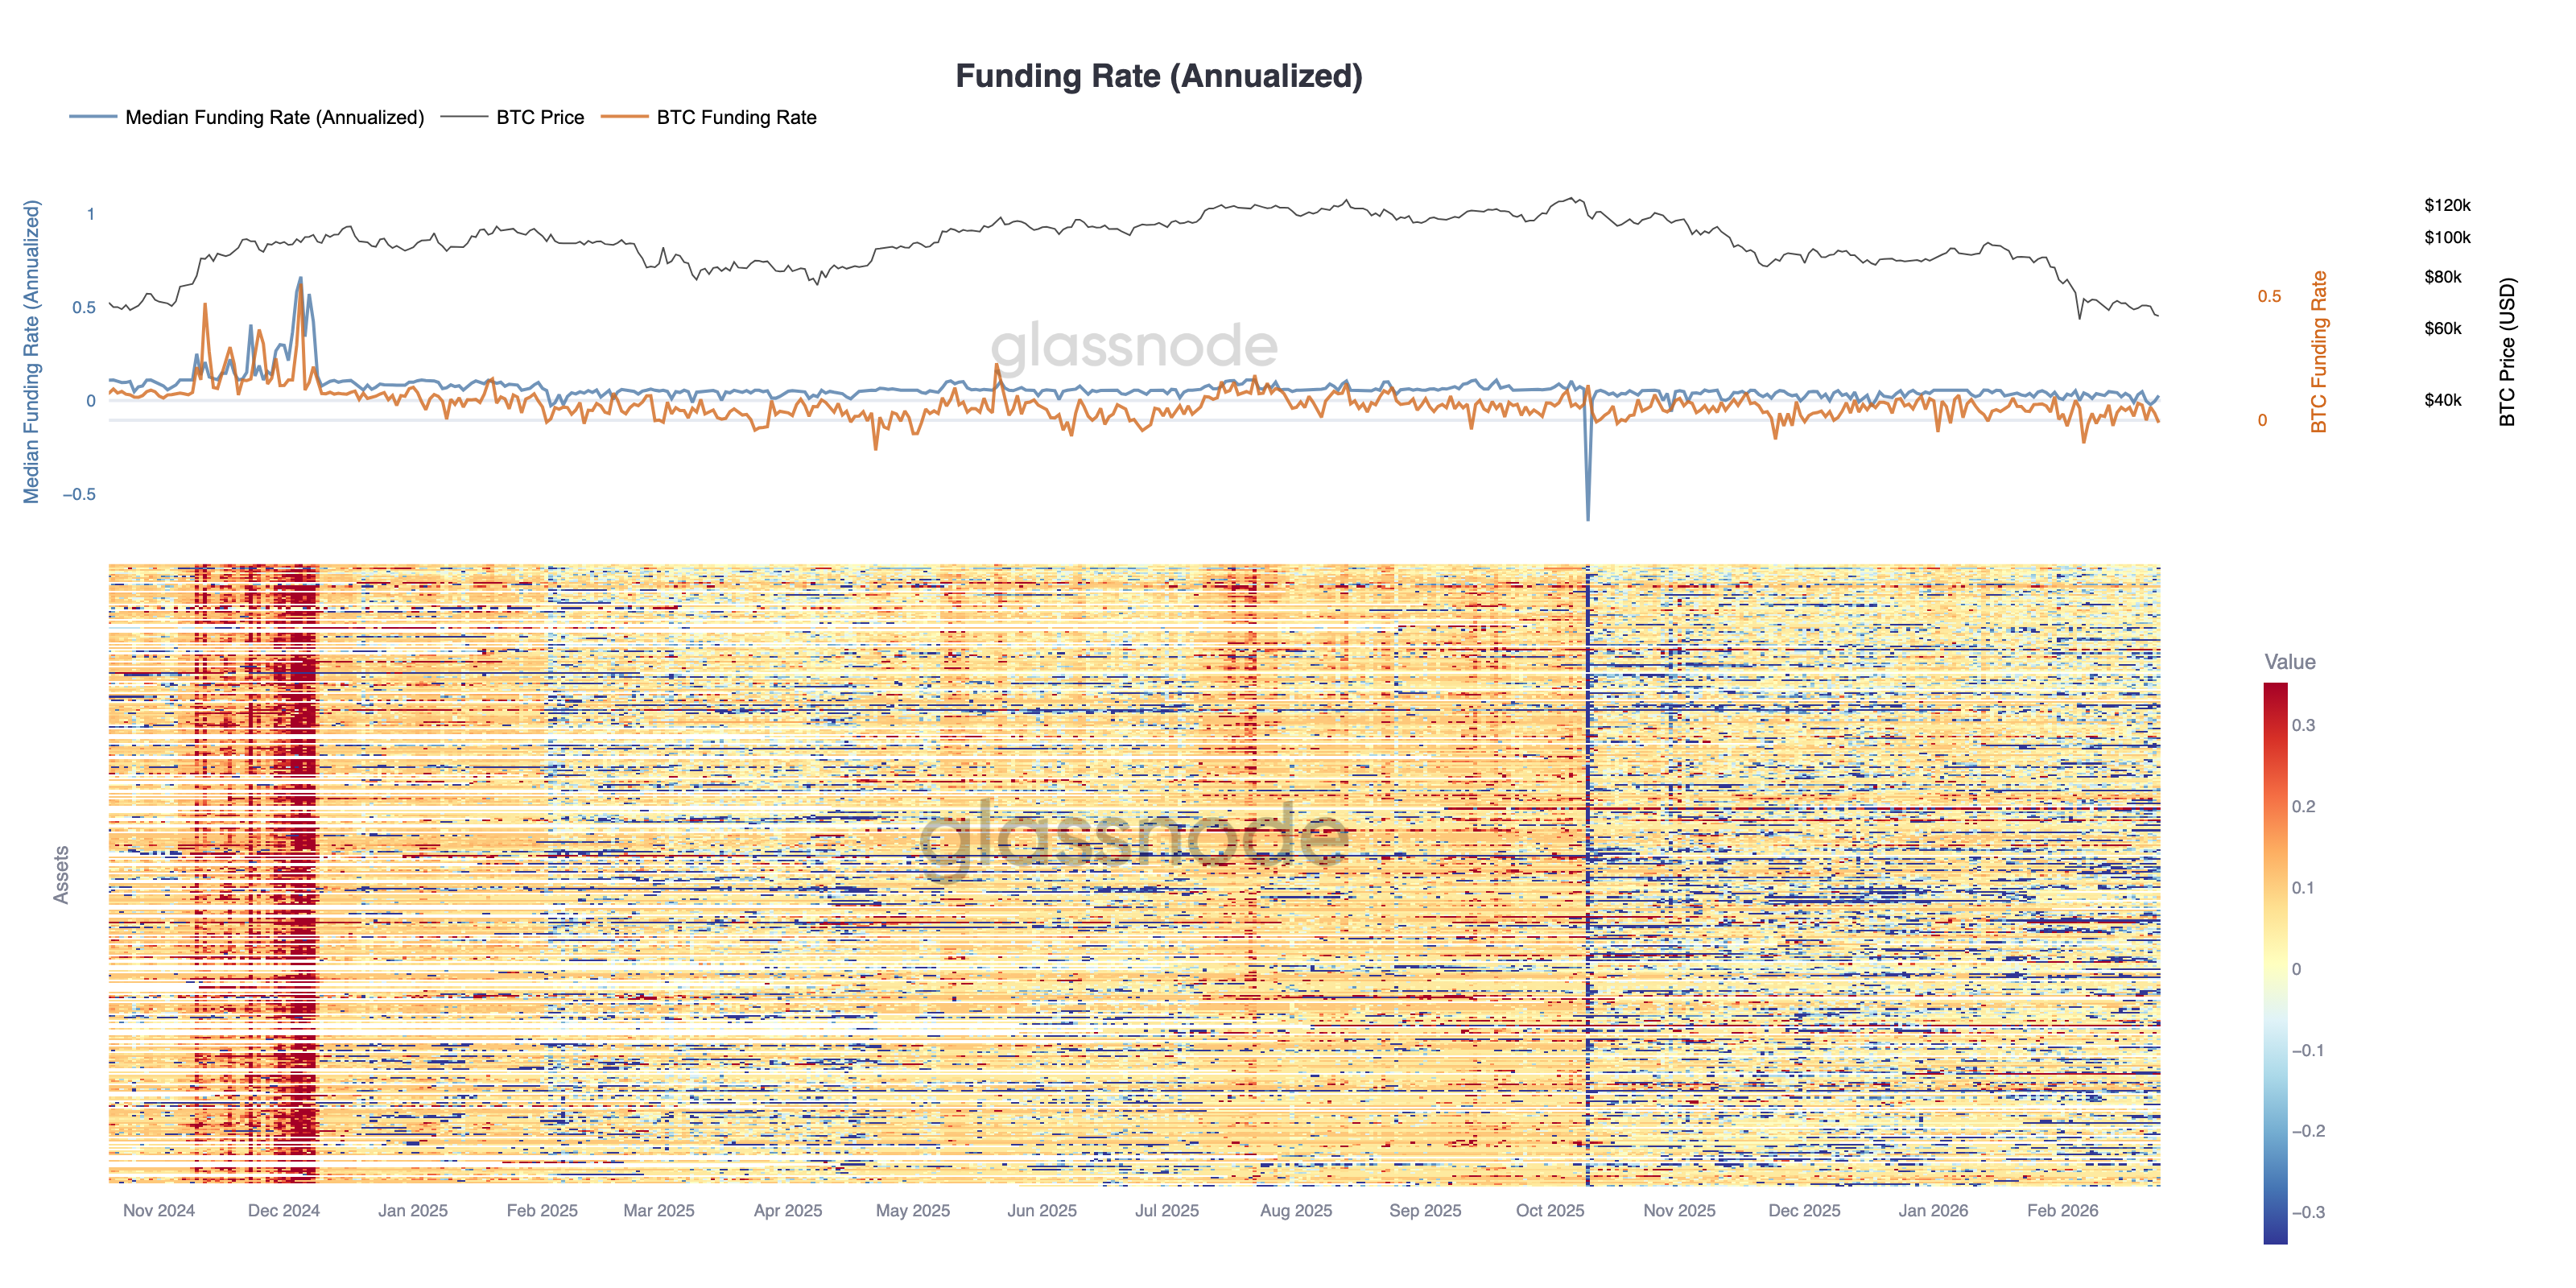
Perpetual futures funding has normalized materially, with the median annualized rate compressing back toward neutral after sustained positive readings through much of the prior rally. The recent price drawdown has coincided with a cooling in speculative positioning, as leveraged long exposure is gradually unwound.

The cross-asset heatmap highlights broad-based funding softness, with many instruments shifting from persistent positive prints to mixed or slightly negative territory. This stands in sharp contrast to late 2024, when elevated funding reflected crowded long positioning and aggressive directional conviction.

While the absence of extreme negative funding suggests limited panic-driven shorting, the lack of sustained positive prints also indicates muted risk appetite. Derivatives markets now appear more balanced, with leverage reduced and positioning less extended, leaving spot flows and structural demand as the key drivers for the next directional move.

Live Chart

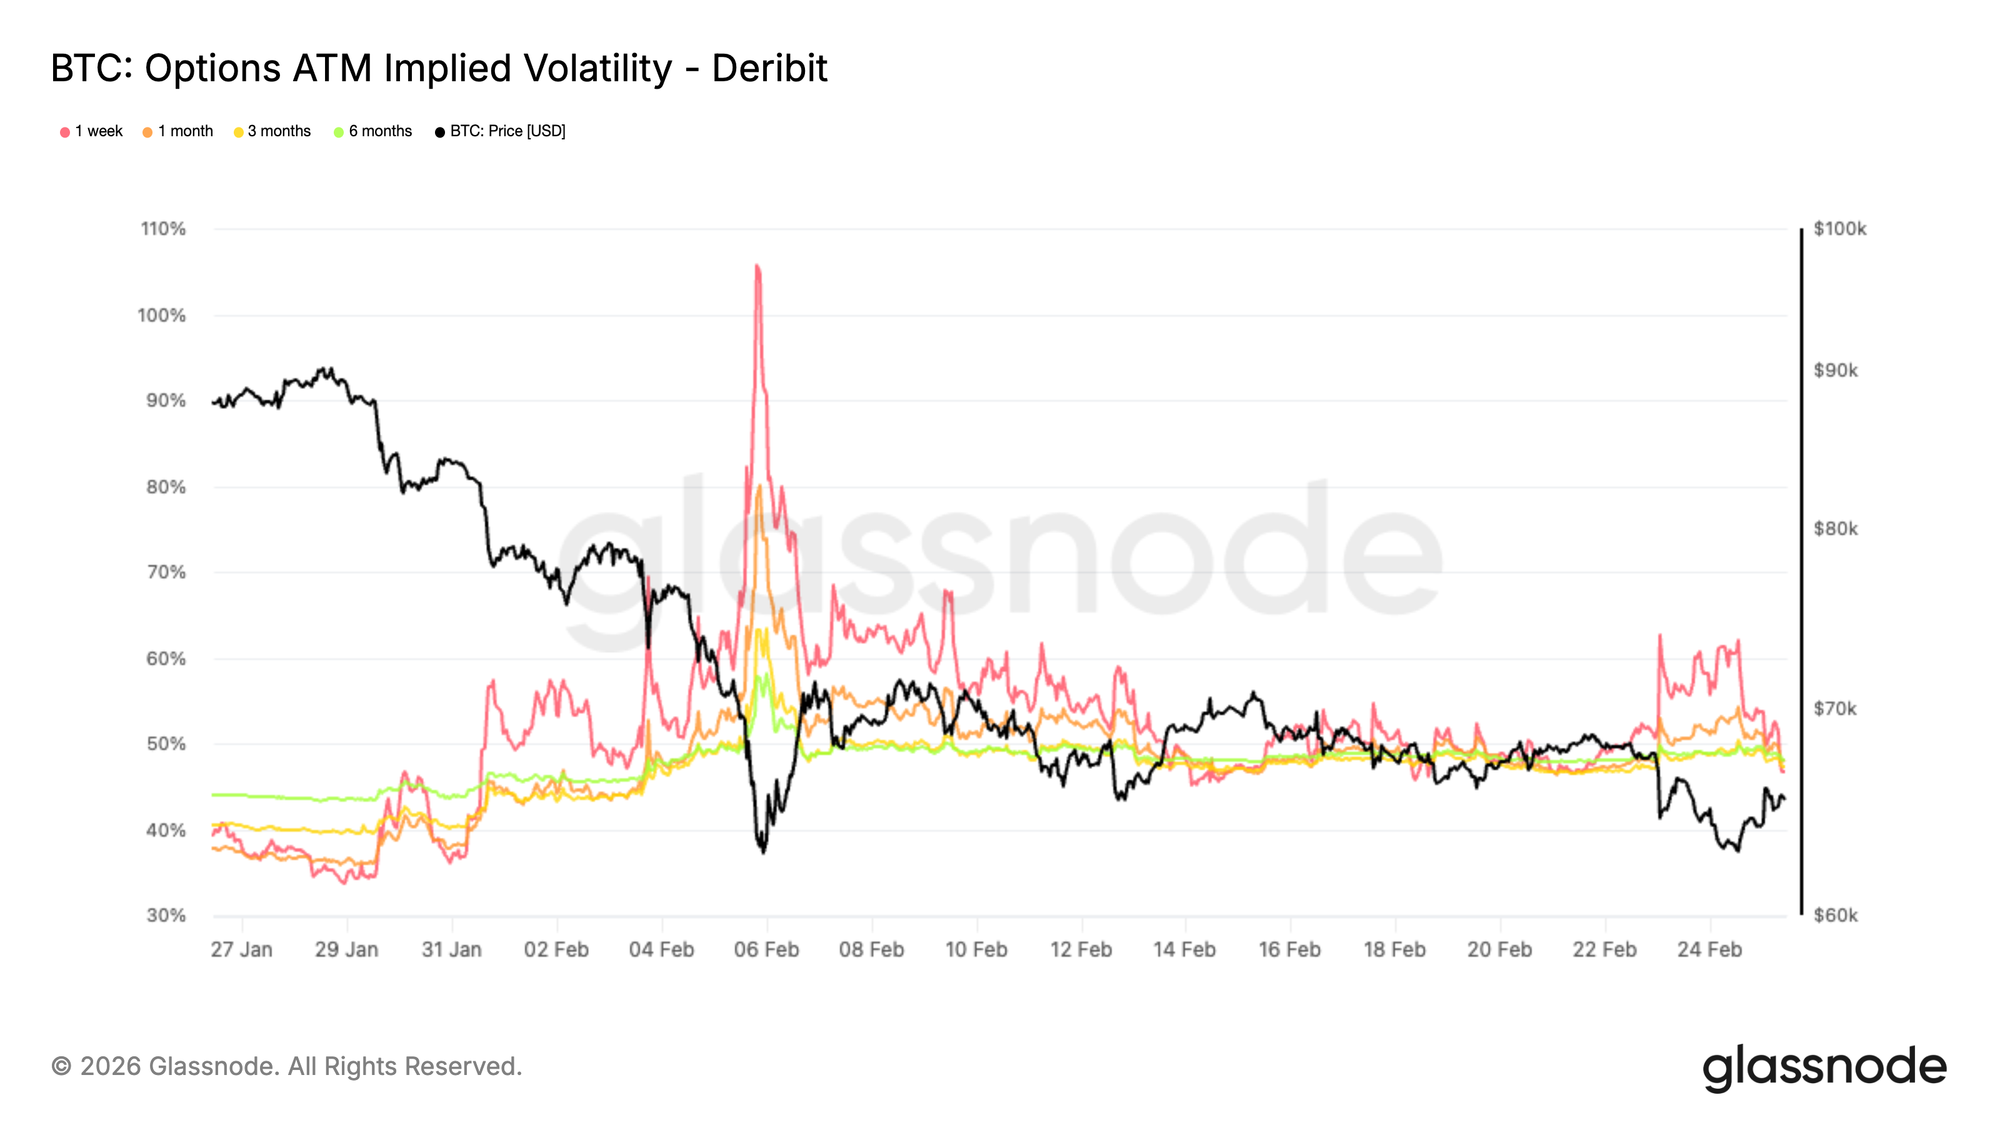
Implied Volatility Reacts but Fails to Expand

At the money implied volatility is elevated versus a month ago but not extreme, sitting around 47 percent across maturities.

In recent sessions, volatility briefly spiked as $BTC approached the 62K level, a zone that could have opened a move toward the high 50s if broken. One week ATM volatility jumped from 47 percent to 62 percent as traders rushed to hedge, recalling the sharp selloff earlier this month.

That repricing proved short lived. As price reclaimed 65K, one week volatility compressed back to 47 percent.

This rapid expansion and equally rapid compression highlights a highly reactive options market. Participants are quick to pay for short term protection near key levels, but just as quick to unwind it when the immediate threat fades.

The result is a mean reverting volatility backdrop, where fear spikes are not yet translating into sustained volatility expansion.

Live Chart

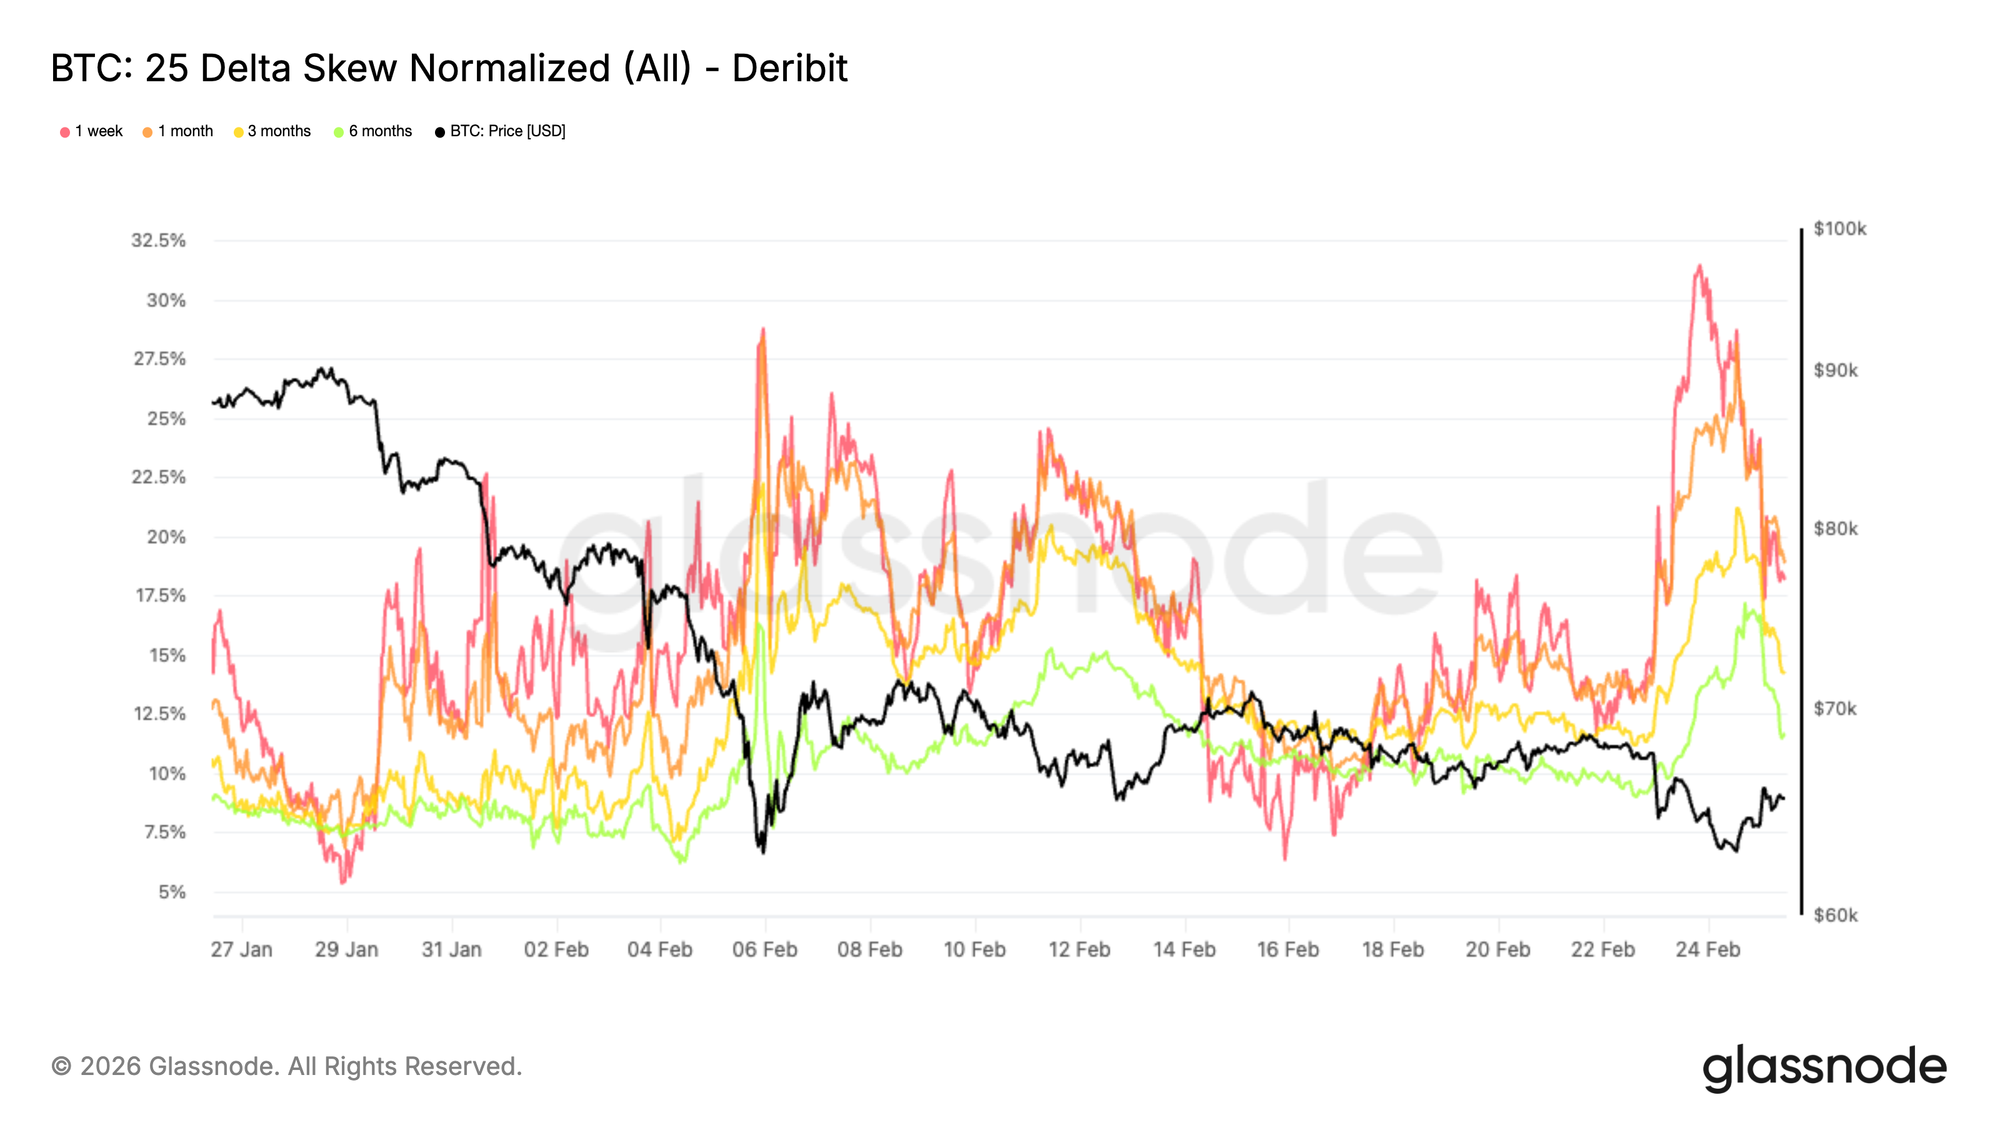
25 Delta Skew Signals Renewed Downside Fear

While implied volatility has remained contained overall, 25 delta skew tells a more defensive story. This metric measures the price difference between downside puts and upside calls, highlighting whether protection or upside exposure is in greater demand.

Skew has once again reached extreme asymmetry, approaching levels last seen on February 5 during the sharp drop toward 60K. At that time, the speed and amplitude of the move caught traders off guard, triggering late stage hedging and pushing puts to trade at a 28 percent premium over calls.

In recent sessions, put skew has climbed toward 30 percent. Each test of the lower end of the range has revived demand for protection, with participants using rebounds to rebuild downside hedges.

This persistent richness in puts reflects a market willing to pay up for insurance, reinforcing a clearly defensive positioning bias.

Live Chart

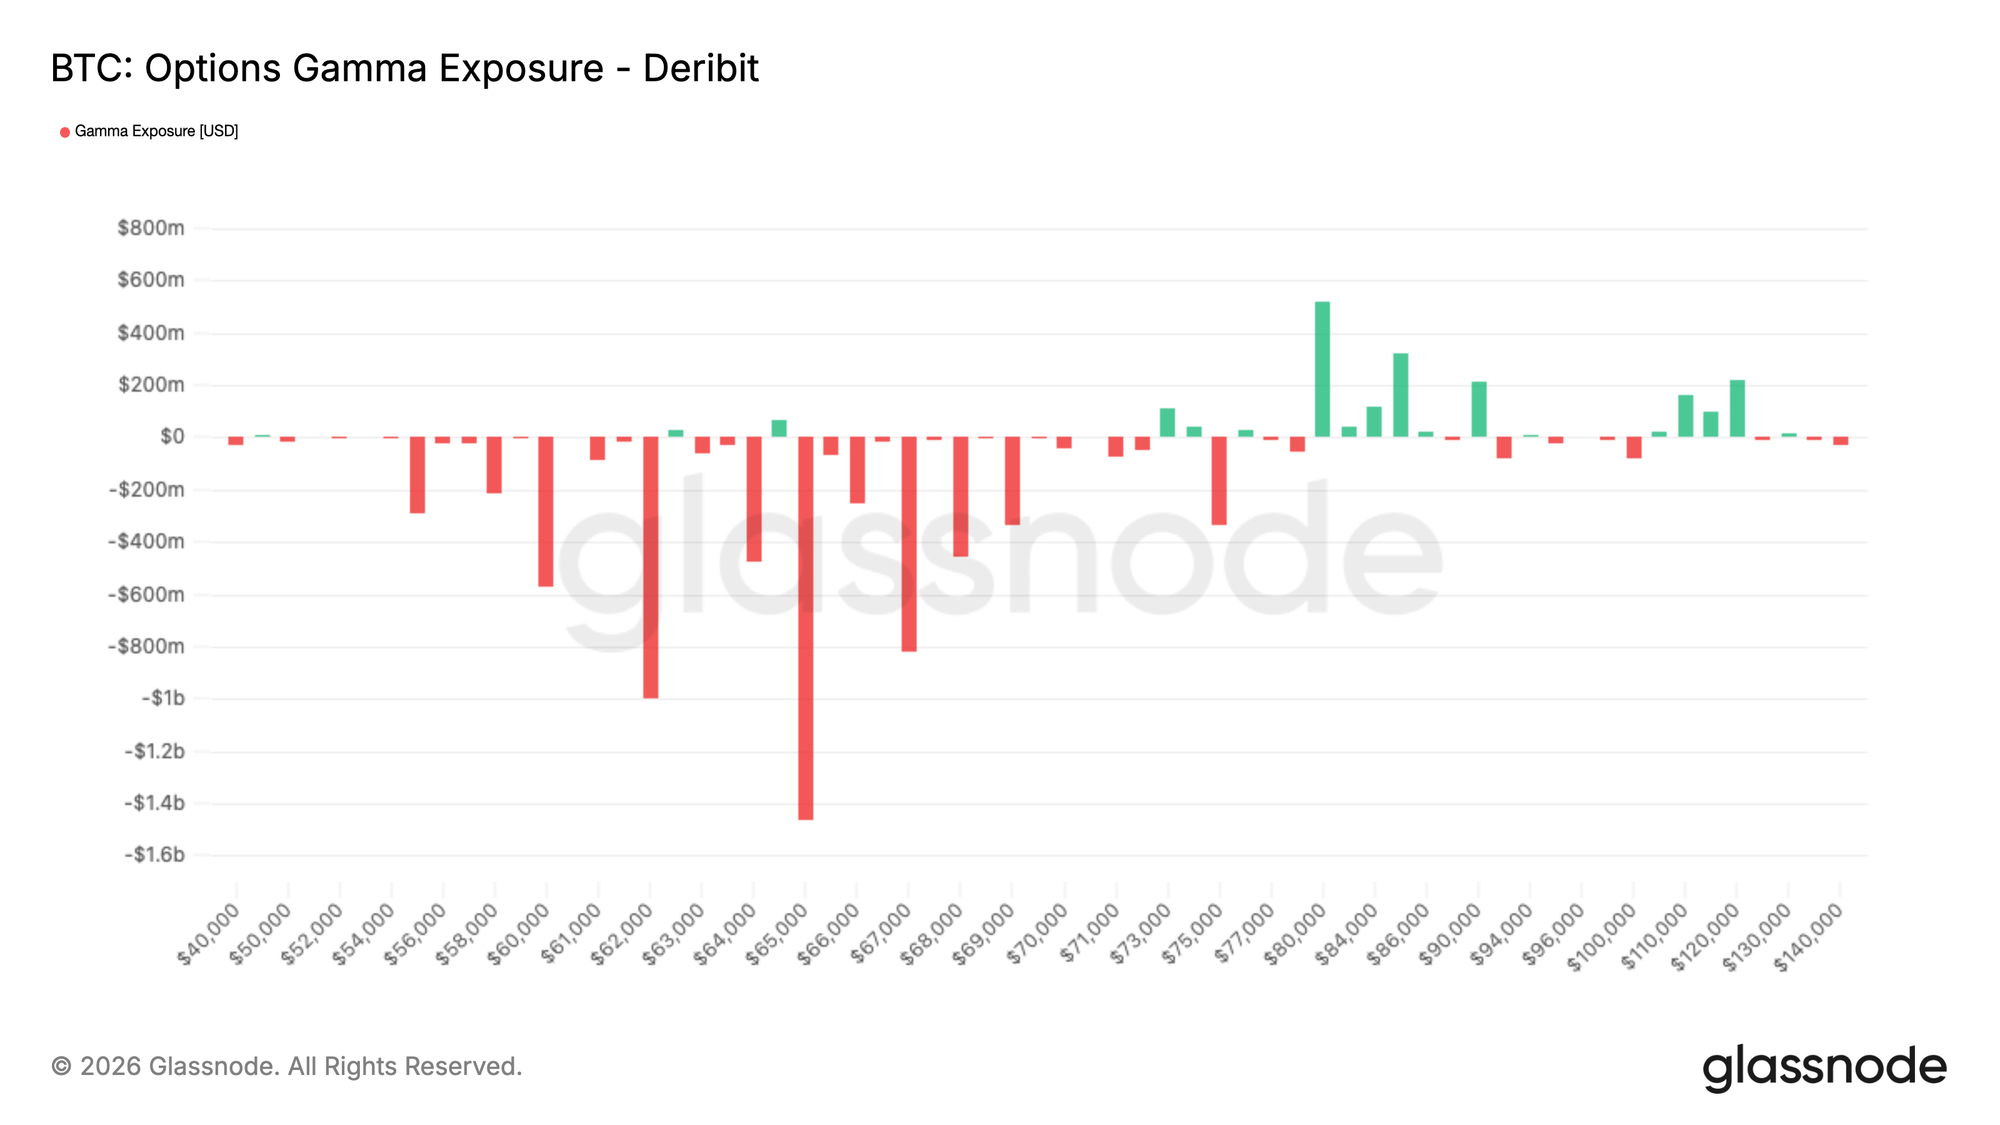
Options Gamma Exposure Remains Net Short

That persistent demand for protection is mirrored in current gamma positioning. Across expiries, the market sits inside a broad short gamma corridor between 70K and 55K, leaving the structure inherently fragile within this range.

The 65K strike stands out, with roughly 1.5 billion dollars of negative dealer gamma concentrated there. This pocket expires entirely this Friday, making it especially relevant in the short term. A move lower into expiry could trigger accelerated hedging flows as dealers sell futures to remain delta neutral. At the same time, once expiry passes, those hedges are unwound. Dealers would buy back futures, which can mechanically ease pressure and create temporary relief.

Further out, end of March expiries carry roughly 650 million dollars of negative gamma at 62K and 830 million dollars at 60K, extending structural sensitivity over the coming weeks.

Short gamma does not determine direction, but it increases the likelihood that moves, once underway, become sharper and more self reinforcing.

Live Chart

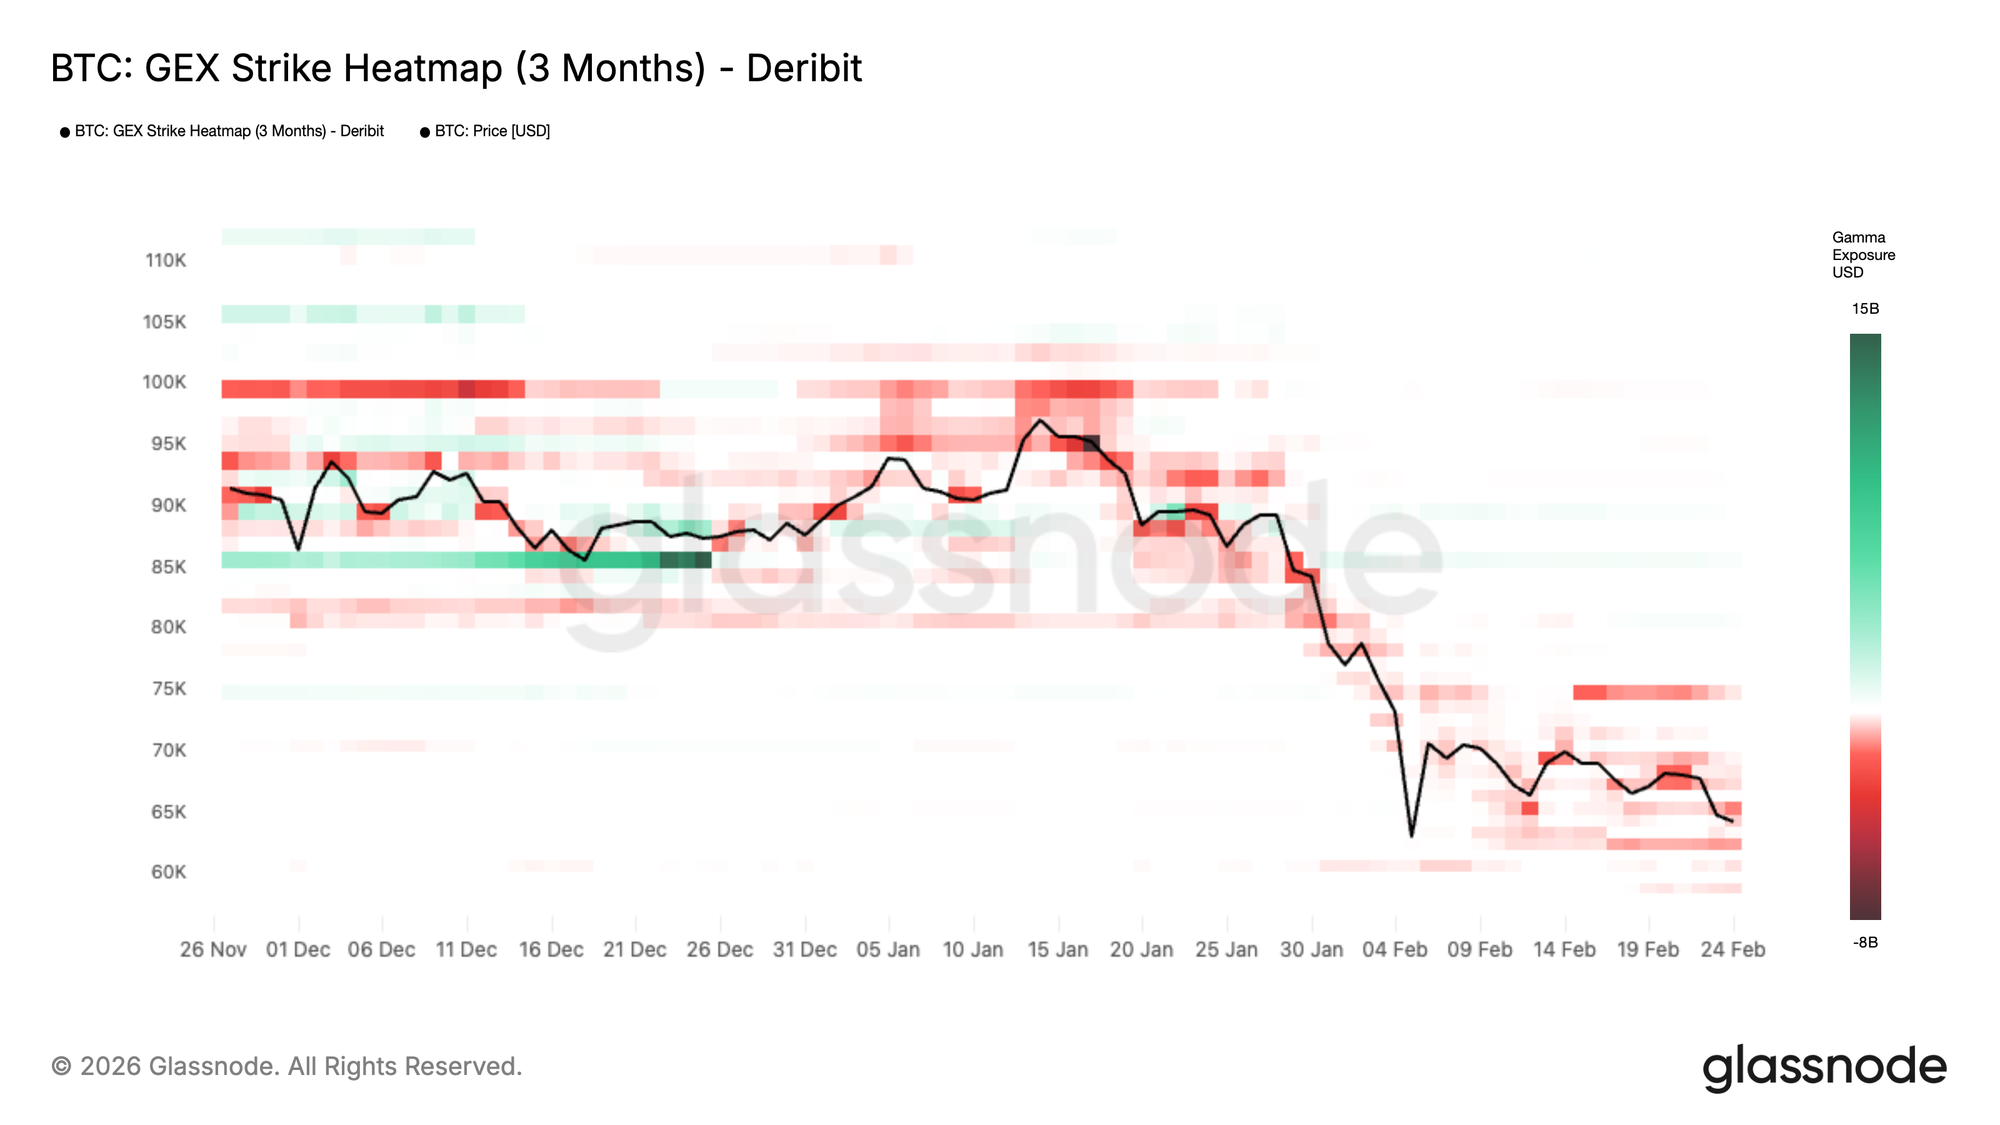
GEX Heatmap Highlights Structural Regime Shifts

While current positioning shows a net short gamma environment, the GEX Heatmap helps place this in a broader structural context.

This chart tracks how dealer gamma exposure has evolved over the past three months, highlighting zones where volatility is mechanically suppressed or amplified.

In December, clear positive gamma bands appeared around 85K, shown in green. These acted as classic gamma walls. Dealers were structurally long gamma, incentivized to sell strength and buy weakness. That flow dampened volatility and helped anchor price within a tight range. The wall did not break. It simply rolled off as year end options expired, removing the stabilizing effect and allowing the structure to reset.

More recently, the heatmap shifted toward deeper red bands during the January to February decline. Expanding negative gamma around and below spot signaled a regime where dealer hedging reinforced the move, allowing volatility to expand and momentum to accelerate.

Live Chart

Conclusion

Bitcoin remains in a structurally defensive consolidation phase. While price continues to find support within the $60k–$69k demand zone, on-chain profit compression, weak breadth, and moderated large-holder accumulation highlight fragile conviction beneath the surface.

Spot sell pressure and sustained ETF outflows confirm that structural demand remains constrained, even as derivatives positioning has reset and panic hedging has faded. The market is stabilizing, but not yet strengthening.

For a durable upside recovery to emerge, renewed spot absorption, sustained large-entity accumulation, and a clear shift in institutional flows will be required. Until then, range-bound price action between key valuation anchors remains the dominant structural theme.


Disclaimer: This report does not provide any investment advice. All data is provided for informational and educational purposes only. No investment decision shall be based on the information provided here, and you are solely responsible for your own investment decisions.

Exchange balances presented are derived from Glassnode’s comprehensive database of address labels, which are amassed through both officially published exchange information and proprietary clustering algorithms. While we strive to ensure the utmost accuracy in representing exchange balances, it is important to note that these figures might not always encapsulate the entirety of an exchange’s reserves, particularly when exchanges refrain from disclosing their official addresses. We urge users to exercise caution and discretion when utilizing these metrics. Glassnode shall not be held responsible for any discrepancies or potential inaccuracies.

Please read our Transparency Notice when using exchange data.

Пов'язані питання

QWhat is the current state of Bitcoin's price action and what does the consolidation phase indicate?

ABitcoin is in a sideways consolidation phase between $60k and $70k, reflecting a fragile equilibrium between seller exhaustion and support from long-term holders. This prolonged compression increases the risk of balance sheet stress for leveraged entities and suggests a high risk of renewed contraction if higher price levels (>$70k) are not reclaimed.

QHow does the 'Total Supply in Loss' metric characterize the current bear market, and what stage does it suggest the market is in?

AThe 'Total Supply in Loss' metric shows approximately 9.2M BTC (nearly half the circulating supply) is held at a loss. Historically, such elevated levels are characteristic of the latter stages of a bear cycle, suggesting the market is closer to a potential bottoming range rather than the early phase of contraction.

QWhat does the Accumulation Trend Score reveal about the behavior of large holders, and why is it significant?

AThe Accumulation Trend Score has remained below 0.5 since February 5th, indicating a lack of aggressive accumulation, particularly among large holders. This subdued participation shows conviction-driven buying has not materialized, elevating the probability of further downside before a durable bottom can form.

QWhat is the significance of the Realized Profit/Loss Ratio falling below 1.0, and what does it imply for market liquidity?

AThe Realized Profit/Loss Ratio falling below 1.0 marks a transition into an excess loss regime, where loss realization dominates profit-taking. This signals structurally impaired liquidity, typically persisting for six months or longer, and limits the probability of a durable near-term recovery until the ratio stabilizes above 1.0.

QHow have US Spot ETF flows and spot market dynamics (CVD) contributed to the current market weakness?

AUS Spot ETF flows have seen sustained net outflows since late November, removing a key institutional demand tailwind. Spot Cumulative Volume Delta (CVD) has plunged to cycle lows, showing aggressive sell-side dominance. This indicates the downturn is driven by active distribution, and recovery requires a shift back to spot bid absorption and sustained ETF inflows.

Пов'язані матеріали

Not Speculation but a Necessity: The 4 Unique Values of Prediction Markets

Polymarket's recent $4 billion funding round and soaring valuation of $15 billion highlight the explosive growth of prediction markets, with trading volume reaching $25.7 billion in March 2026—a 10.6% monthly increase. This analysis argues that prediction markets serve critical non-speculative functions, positioning them as essential tools rather than mere gambling platforms. Prediction markets offer four unique values: entertainment consumption, insurance-like protection, risk hedging, and truth discovery. Firstly, they stimulate economic activity by engaging users in event-based betting, similar to the broader sports industry. Secondly, they act as a form of decentralized insurance, allowing users to hedge against specific, well-defined risks (e.g., weather events) transparently and without traditional overhead costs. Thirdly, institutions and individuals use these markets to hedge against geopolitical and commodity price risks, as demonstrated during the U.S.-Iran conflict and the launch of 24/7 commodity markets on platforms like Kalshi. Finally, prediction markets counter media bias by aggregating crowd-sourced information, often achieving 30% higher accuracy than surveys due to users' vested interests. Experts like Bitwise’s Jeff Park and SIG’s Jeff Yass emphasize the markets' role in risk transfer and financial innovation. As these platforms evolve, they are poised to become trillion-dollar markets, offering more reliable, decentralized mechanisms for information pricing and risk management.

marsbit41 хв тому

Not Speculation but a Necessity: The 4 Unique Values of Prediction Markets

marsbit41 хв тому

Interview with Jeff Hoffman: How Web3 and AI Are Reshaping the Trillion-Dollar Social Travel Market

Interview with Jeff Hoffman: Web3 and AI Reshaping the Trillion-Dollar Social Travel Market Jeff Hoffman, co-founder of Priceline, discusses how Web3 and AI are transforming the social travel industry. He highlights that the current travel market is fragmented and inefficient, dominated by traditional online travel agencies (OTAs) that act as intermediaries with opaque models. Web3 introduces direct connections, transparency, and faster settlements, shifting value back to travelers. Key trends driving this change include demand for flexible rewards, digital payments, and trust in communities over ads. Hoffman joined Staynex not for its Web3 label, but because it addresses industry inefficiencies by integrating booking, payments, AI-driven itineraries, and rewards into a single ecosystem. This Web2.5 model combines Web2 scale with Web3 incentives. He emphasizes the team’s focus on execution over hype as a key reason for his involvement. Looking ahead, blockchain will enable transparent rewards and seamless cross-border payments, while AI provides personalization. Together, they will turn travel into a continuous relationship rather than a transaction. Hoffman predicts traditional OTAs will persist, but value will shift to platforms that own payment, loyalty, and community networks. Social travel represents a significant, underestimated opportunity in Web3.

marsbit1 год тому

Interview with Jeff Hoffman: How Web3 and AI Are Reshaping the Trillion-Dollar Social Travel Market

marsbit1 год тому

Торгівля

Спот
Ф'ючерси

Популярні статті

Що таке $S$

Розуміння SPERO: Комплексний огляд Вступ до SPERO Оскільки ландшафт інновацій продовжує еволюціонувати, виникнення технологій web3 та криптовалютних проектів відіграє ключову роль у формуванні цифрового майбутнього. Один з проектів, який привернув увагу в цій динамічній сфері, — це SPERO, позначений як SPERO,$$s$. Ця стаття має на меті зібрати та представити детальну інформацію про SPERO, щоб допомогти ентузіастам та інвесторам зрозуміти його основи, цілі та інновації в рамках web3 та крипто-сектору. Що таке SPERO,$$s$? SPERO,$$s$ — це унікальний проект у криптопросторі, який прагне використати принципи децентралізації та технології блокчейн для створення екосистеми, що сприяє залученню, корисності та фінансовій інклюзії. Проект розроблений для полегшення взаємодії між користувачами новими способами, надаючи їм інноваційні фінансові рішення та послуги. У своїй основі SPERO,$$s$ прагне надати можливості індивідам, забезпечуючи інструменти та платформи, які покращують користувацький досвід у криптовалютному просторі. Це включає в себе можливість більш гнучких методів транзакцій, сприяння ініціативам, що підтримуються спільнотою, та створення шляхів для фінансових можливостей через децентралізовані додатки (dApps). Основна концепція SPERO,$$s$ обертається навколо інклюзивності, прагнучи зменшити розриви в традиційній фінансовій системі, використовуючи переваги технології блокчейн. Хто є творцем SPERO,$$s$? Особистість творця SPERO,$$s$ залишається дещо невідомою, оскільки є обмежені публічно доступні ресурси, що надають детальну інформацію про його засновників. Ця відсутність прозорості може бути наслідком зобов'язання проекту до децентралізації — етики, яку багато проектів web3 поділяють, ставлячи колективні внески вище за індивідуальне визнання. Зосереджуючи обговорення навколо спільноти та її колективних цілей, SPERO,$$s$ втілює суть наділення без виділення конкретних осіб. Таким чином, розуміння етики та місії SPERO є більш важливим, ніж ідентифікація єдиного творця. Хто є інвесторами SPERO,$$s$? SPERO,$$s$ підтримується різноманітними інвесторами, починаючи від венчурних капіталістів до ангельських інвесторів, які прагнуть сприяти інноваціям у крипто-секторі. Зосередження цих інвесторів зазвичай узгоджується з місією SPERO — пріоритет надається проектам, які обіцяють технологічний прогрес у суспільстві, фінансову інклюзію та децентралізоване управління. Ці інвесторські фонди зазвичай зацікавлені в проектах, які не лише пропонують інноваційні продукти, але й позитивно впливають на спільноту блокчейн та її екосистеми. Підтримка з боку цих інвесторів підкріплює SPERO,$$s$ як значного конкурента в швидко змінюваній сфері крипто-проектів. Як працює SPERO,$$s$? SPERO,$$s$ використовує багатогранну структуру, яка відрізняє його від традиційних криптовалютних проектів. Ось деякі ключові особливості, які підкреслюють його унікальність та інноваційність: Децентралізоване управління: SPERO,$$s$ інтегрує моделі децентралізованого управління, надаючи користувачам можливість активно брати участь у процесах прийняття рішень щодо майбутнього проекту. Цей підхід сприяє відчуттю власності та відповідальності серед членів спільноти. Корисність токена: SPERO,$$s$ використовує свій власний криптовалютний токен, розроблений для виконання різних функцій в екосистемі. Ці токени дозволяють здійснювати транзакції, отримувати винагороди та полегшувати послуги, що пропонуються на платформі, підвищуючи загальну залученість та корисність. Шарова архітектура: Технічна архітектура SPERO,$$s$ підтримує модульність та масштабованість, що дозволяє безперешкодно інтегрувати додаткові функції та додатки в міру розвитку проекту. Ця адаптивність є надзвичайно важливою для збереження актуальності в постійно змінюваному крипто-ландшафті. Залучення спільноти: Проект підкреслює ініціативи, що підтримуються спільнотою, використовуючи механізми, які стимулюють співпрацю та зворотний зв'язок. Підтримуючи сильну спільноту, SPERO,$$s$ може краще задовольняти потреби користувачів та адаптуватися до ринкових тенденцій. Фокус на інклюзію: Пропонуючи низькі комісії за транзакції та зручні інтерфейси, SPERO,$$s$ прагне залучити різноманітну базу користувачів, включаючи осіб, які раніше не брали участі в крипто-просторі. Це зобов'язання до інклюзії узгоджується з його загальною місією наділення через доступність. Хронологія SPERO,$$s$ Розуміння історії проекту надає важливі уявлення про його розвиток та етапи. Нижче наведено пропоновану хронологію, що відображає значні події в еволюції SPERO,$$s$: Етап концептуалізації та ідеації: Початкові ідеї, що стали основою SPERO,$$s$, були сформовані, тісно пов'язані з принципами децентралізації та фокусом на спільноті в індустрії блокчейн. Запуск білого паперу проекту: Після концептуального етапу був випущений комплексний білий папір, що детально описує бачення, цілі та технологічну інфраструктуру SPERO,$$s$, щоб залучити інтерес та зворотний зв'язок від спільноти. Створення спільноти та ранні залучення: Активні зусилля були спрямовані на створення спільноти ранніх прихильників та потенційних інвесторів, що полегшило обговорення цілей проекту та отримання підтримки. Подія генерації токенів: SPERO,$$s$ провів подію генерації токенів (TGE) для розподілу своїх рідних токенів серед ранніх прихильників та встановлення початкової ліквідності в екосистемі. Запуск початкового dApp: Перший децентралізований додаток (dApp), пов'язаний з SPERO,$$s$, став доступним, дозволяючи користувачам взаємодіяти з основними функціями платформи. Постійний розвиток та партнерства: Безперервні оновлення та вдосконалення пропозицій проекту, включаючи стратегічні партнерства з іншими учасниками блокчейн-простору, сформували SPERO,$$s$ у конкурентоспроможного та еволюціонуючого гравця на крипто-ринку. Висновок SPERO,$$s$ є свідченням потенціалу web3 та криптовалют для революціонізації фінансових систем та наділення індивідів. Завдяки зобов'язанню до децентралізованого управління, залучення спільноти та інноваційно спроектованих функцій, він прокладає шлях до більш інклюзивного фінансового ландшафту. Як і з будь-якими інвестиціями в швидко змінюваному крипто-просторі, потенційним інвесторам та користувачам рекомендується ретельно досліджувати та обдумано взаємодіяти з поточними подіями в SPERO,$$s$. Проект демонструє інноваційний дух крипто-індустрії, запрошуючи до подальшого дослідження його численних можливостей. Хоча подорож SPERO,$$s$ ще триває, його основні принципи можуть справді вплинути на майбутнє того, як ми взаємодіємо з технологією, фінансами та один з одним у взаємопов'язаних цифрових екосистемах.

73 переглядів усьогоОпубліковано 2024.12.17Оновлено 2024.12.17

Що таке $S$

Що таке AGENT S

Агент S: Майбутнє автономної взаємодії в Web3 Вступ У постійно змінюваному ландшафті Web3 та криптовалюти інновації постійно переосмислюють, як люди взаємодіють з цифровими платформами. Один з таких новаторських проектів, Агент S, обіцяє революціонізувати взаємодію людини з комп'ютером через свою відкриту агентну структуру. Прокладаючи шлях для автономних взаємодій, Агент S прагне спростити складні завдання, пропонуючи трансформаційні застосування в штучному інтелекті (ШІ). Це детальне дослідження заглиблюється в складності проекту, його унікальні особливості та наслідки для сфери криптовалюти. Що таке Агент S? Агент S є революційною відкритою агентною структурою, спеціально розробленою для вирішення трьох основних викликів в автоматизації комп'ютерних завдань: Набуття специфічних знань у галузі: Структура інтелектуально навчається з різних зовнішніх джерел знань та внутрішнього досвіду. Цей подвійний підхід дозволяє їй створити багатий репозиторій специфічних знань у галузі, покращуючи її продуктивність у виконанні завдань. Планування на довгих горизонтах завдань: Агент S використовує планування з підкріпленням досвіду, стратегічний підхід, який полегшує ефективний розподіл та виконання складних завдань. Ця функція значно підвищує її здатність ефективно та результативно управляти кількома підзавданнями. Обробка динамічних, неоднорідних інтерфейсів: Проект представляє Інтерфейс Агент-Комп'ютер (ACI), інноваційне рішення, яке покращує взаємодію між агентами та користувачами. Використовуючи багатомодальні великі мовні моделі (MLLMs), Агент S може безперешкодно орієнтуватися та маніпулювати різноманітними графічними інтерфейсами користувача. Завдяки цим новаторським функціям Агент S надає надійну структуру, яка вирішує складнощі, пов'язані з автоматизацією людської взаємодії з машинами, прокладаючи шлях для численних застосувань у ШІ та за його межами. Хто є творцем Агент S? Хоча концепція Агент S є фундаментально новаторською, конкретна інформація про його творця залишається невідомою. Творець наразі невідомий, що підкреслює або початкову стадію проекту, або стратегічний вибір зберегти засновників у таємниці. Незважаючи на анонімність, акцент залишається на можливостях та потенціалі структури. Хто є інвесторами Агент S? Оскільки Агент S є відносно новим у криптографічній екосистемі, детальна інформація про його інвесторів та фінансових спонсорів не задокументована. Відсутність публічно доступних відомостей про інвестиційні фонди або організації, що підтримують проект, викликає питання щодо його фінансової структури та дорожньої карти розвитку. Розуміння підтримки є критично важливим для оцінки стійкості проекту та потенційного впливу на ринок. Як працює Агент S? В основі Агент S лежить передова технологія, яка дозволяє йому ефективно функціонувати в різних умовах. Його операційна модель побудована навколо кількох ключових функцій: Взаємодія з комп'ютером, подібна до людської: Структура пропонує розширене планування ШІ, прагнучи зробити взаємодії з комп'ютерами більш інтуїтивними. Імітуючи людську поведінку при виконанні завдань, вона обіцяє підвищити досвід користувачів. Наративна пам'ять: Використовується для використання високорівневого досвіду, Агент S використовує наративну пам'ять для відстеження історій завдань, тим самим покращуючи свої процеси прийняття рішень. Епізодична пам'ять: Ця функція надає користувачам покрокові інструкції, дозволяючи структурі пропонувати контекстуальну підтримку в міру виконання завдань. Підтримка OpenACI: Завдяки можливості працювати локально, Агент S дозволяє користувачам зберігати контроль над своїми взаємодіями та робочими процесами, узгоджуючи з децентралізованою етикою Web3. Легка інтеграція з зовнішніми API: Його універсальність і сумісність з різними платформами ШІ забезпечують те, що Агент S може безперешкодно вписатися в існуючі технологічні екосистеми, роблячи його привабливим вибором для розробників та організацій. Ці функціональні можливості колективно сприяють унікальному положенню Агент S у крипто-просторі, оскільки він автоматизує складні, багатоступеневі завдання з мінімальним втручанням людини. У міру розвитку проекту його потенційні застосування в Web3 можуть переосмислити, як відбуваються цифрові взаємодії. Хронологія Агент S Розробка та етапи Агент S можуть бути узагальнені в хронології, яка підкреслює його значні події: 27 вересня 2024 року: Концепція Агент S була представлена в комплексній науковій статті під назвою “Відкрита агентна структура, яка використовує комп'ютери як людина”, що демонструє основи проекту. 10 жовтня 2024 року: Наукова стаття була опублікована на arXiv, пропонуючи детальне дослідження структури та її оцінки продуктивності на основі бенчмарку OSWorld. 12 жовтня 2024 року: Було випущено відеопрезентацію, що надає візуальне уявлення про можливості та особливості Агент S, ще більше залучаючи потенційних користувачів та інвесторів. Ці маркери в хронології не лише ілюструють прогрес Агент S, але й вказують на його прихильність до прозорості та залучення громади. Ключові моменти про Агент S У міру розвитку структури Агент S кілька ключових характеристик виділяються, підкреслюючи її новаторський характер та потенціал: Інноваційна структура: Розроблена для забезпечення інтуїтивного використання комп'ютерів, подібного до людської взаємодії, Агент S пропонує новий підхід до автоматизації завдань. Автономна взаємодія: Здатність автономно взаємодіяти з комп'ютерами через GUI означає стрибок до більш інтелектуальних та ефективних обчислювальних рішень. Автоматизація складних завдань: Завдяки своїй надійній методології він може автоматизувати складні, багатоступеневі завдання, роблячи процеси швидшими та менш схильними до помилок. Безперервне вдосконалення: Механізми навчання дозволяють Агенту S покращуватися на основі минулого досвіду, постійно підвищуючи свою продуктивність та ефективність. Універсальність: Його адаптивність до різних операційних середовищ, таких як OSWorld та WindowsAgentArena, забезпечує його здатність служити широкому спектру застосувань. Оскільки Агент S займає своє місце в ландшафті Web3 та криптовалюти, його потенціал покращити можливості взаємодії та автоматизувати процеси означає значний прогрес у технологіях ШІ. Завдяки своїй інноваційній структурі Агент S є прикладом майбутнього цифрових взаємодій, обіцяючи більш безперешкодний та ефективний досвід для користувачів у різних галузях. Висновок Агент S представляє собою сміливий крок вперед у поєднанні ШІ та Web3, з можливістю переосмислити, як ми взаємодіємо з технологією. Хоча проект все ще на ранніх стадіях, можливості для його застосування є величезними та переконливими. Завдяки своїй комплексній структурі, що вирішує критичні виклики, Агент S прагне вивести автономні взаємодії на передній план цифрового досвіду. У міру того, як ми заглиблюємося в сфери криптовалюти та децентралізації, проекти, подібні до Агент S, безсумнівно, відіграватимуть ключову роль у формуванні майбутнього технологій та співпраці людини з комп'ютером.

525 переглядів усьогоОпубліковано 2025.01.14Оновлено 2025.01.14

Що таке AGENT S

Як купити S

Ласкаво просимо до HTX.com! Ми зробили покупку Sonic (S) простою та зручною. Дотримуйтесь нашої покрокової інструкції, щоб розпочати свою криптовалютну подорож.Крок 1: Створіть обліковий запис на HTXВикористовуйте свою електронну пошту або номер телефону, щоб зареєструвати обліковий запис на HTX безплатно. Пройдіть безпроблемну реєстрацію й отримайте доступ до всіх функцій.ЗареєструватисьКрок 2: Перейдіть до розділу Купити крипту і виберіть спосіб оплатиКредитна/дебетова картка: використовуйте вашу картку Visa або Mastercard, щоб миттєво купити Sonic (S).Баланс: використовуйте кошти з балансу вашого рахунку HTX для безперешкодної торгівлі.Треті особи: ми додали популярні способи оплати, такі як Google Pay та Apple Pay, щоб підвищити зручність.P2P: Торгуйте безпосередньо з іншими користувачами на HTX.Позабіржова торгівля (OTC): ми пропонуємо індивідуальні послуги та конкурентні обмінні курси для трейдерів.Крок 3: Зберігайте свої Sonic (S)Після придбання Sonic (S) збережіть його у своєму обліковому записі на HTX. Крім того, ви можете відправити його в інше місце за допомогою блокчейн-переказу або використовувати його для торгівлі іншими криптовалютами.Крок 4: Торгівля Sonic (S)Легко торгуйте Sonic (S) на спотовому ринку HTX. Просто увійдіть до свого облікового запису, виберіть торгову пару, укладайте угоди та спостерігайте за ними в режимі реального часу. Ми пропонуємо зручний досвід як для початківців, так і для досвідчених трейдерів.

1.3k переглядів усьогоОпубліковано 2025.01.15Оновлено 2025.03.21

Як купити S

Обговорення

Ласкаво просимо до спільноти HTX. Тут ви можете бути в курсі останніх подій розвитку платформи та отримати доступ до професійної ринкової інформації. Нижче представлені думки користувачів щодо ціни S (S).

活动图片