Violent Attacks On Crypto Holders Escalate Worldwide, Data Shows

bitcoinistОпубліковано о 2026-01-06Востаннє оновлено о 2026-01-06

Анотація

Data shows a significant escalation in violent "wrench attacks" – physical robberies and kidnappings targeting cryptocurrency holders to force asset transfers – both in frequency and severity worldwide. Security researcher Haseeb Qureshi analyzed an incident database maintained by Jameson Lopp, finding 269 categorized attacks, with over half classified as "Serious" and 5% as "Fatal." The data indicates attacks are becoming more violent over time, with 2025 showing the highest incident count. Approximately 45% of the variation in attacks is explained by crypto market capitalization, meaning higher prices correlate with more incidents. However, when normalized per user (using Coinbase active users as a proxy), attack rates spiked in earlier market cycles, fell after 2019, and have recently risen again toward 2021 levels. Geographically, Western Europe and North America have the most incidents, but Latin America and Africa have significantly higher fatality rates. Notably, zero fatal attacks have occurred in North America. Researchers warn these events are transitioning from rare occurrences to a recurring risk for crypto participants.

Violent “wrench attacks” against crypto holders, physical robberies and kidnappings meant to force victims to hand over coins, appear to be rising in absolute terms and trending more severe, according to a new visualization built from a long-running incident database maintained by security researcher Jameson Lopp.

Dragonfly partner Haseeb Qureshi said he analyzed Lopp’s dataset and built an interactive dashboard to stress-test a question many traders and builders have been asking quietly for years: is simply holding crypto becoming physically more dangerous? “You’re not imagining it: the number of attacks has been increasing over time,” Qureshi wrote on X. “Not only that, the attacks are getting more violent.”
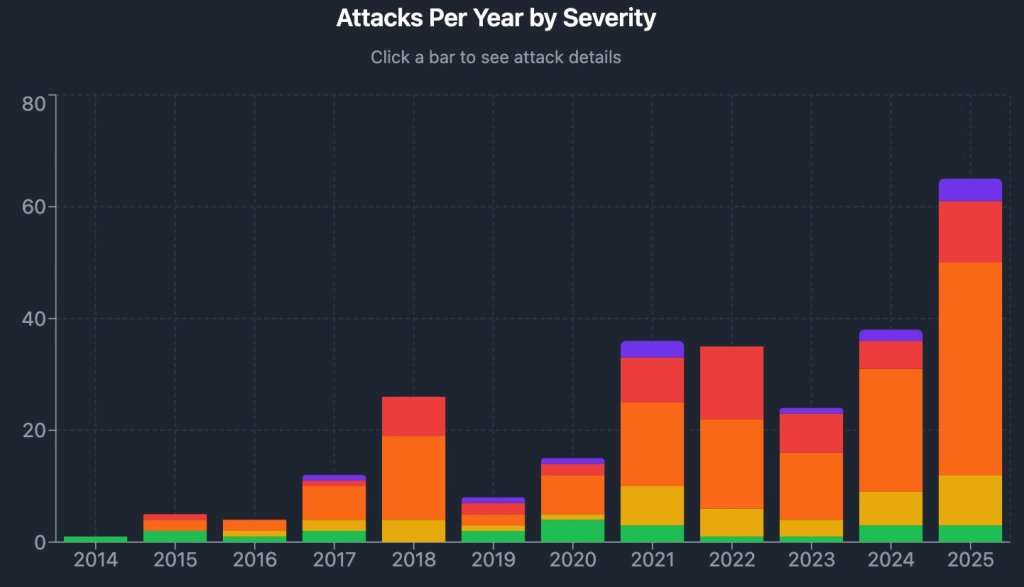
Attacks per year by severity | Source: X @hosseeb

The dashboard breaks reported incidents into five severity bands — Minor, Moderate, Serious, Severe, and Fatal and the distribution skews heavily toward the sharp end of the spectrum. Of 269 categorized incidents shown, 137 (51%) were labeled “Serious,” 57 (21%) “Severe,” and 13 (5%) “Fatal,” with the remainder split between 39 (14%) “Moderate” and 23 (9%) “Minor.”

The year-by-year bars show the later years carrying a larger share of “Severe” and “Fatal” outcomes than the early history of the dataset, with 2025 appearing as the highest-incident year on the chart.
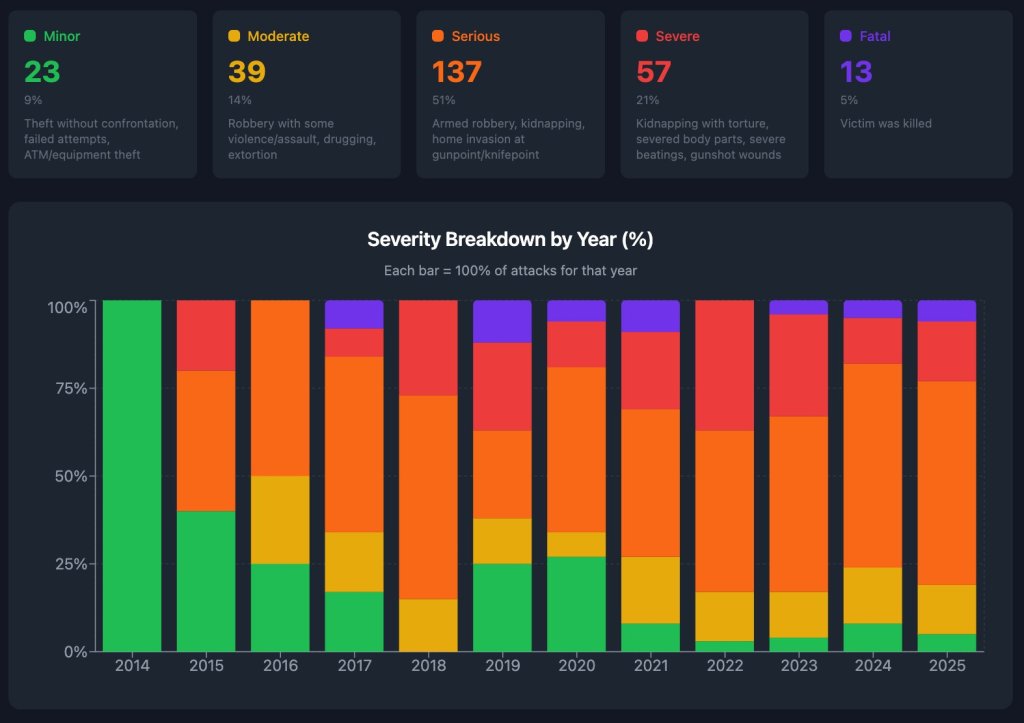
Severity breakdown by year | Source: X @hosseeb

Qureshi’s analysis also puts a number on the most intuitive driver: price. Charting incidents against total crypto market capitalization, he reported a simple regression with an R2 of 0.45 — implying roughly 45% of the variation in reported violence is explained by market cap alone. In plain terms, higher prices coincide with more attacks.

But the more consequential question for everyday holders is not raw counts; it’s risk per person. Because comprehensive “number of crypto users” data is hard to pin down, Qureshi used Coinbase monthly active users as a proxy, and separately normalized incidents by market cap to approximate attacks per dollar of wealth.

The resulting “normalized attack rates” chart tells a less linear story: per-user attack rates spiked in earlier market eras (notably around 2015 and again in 2018), then fell sharply after 2019, before ticking higher in the most recent observations. “So is that it?” Qureshi asked. “Proof crypto is becoming more physically dangerous?”
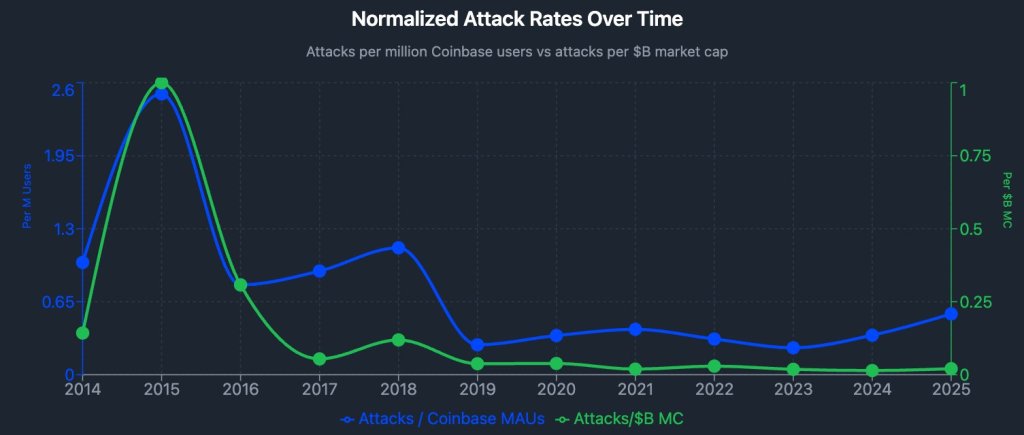
Normalized attack rate over time | Source: X @hosseeb

On his telling, not quite. Coinbase MAUs, he noted, expanded dramatically over the decade, while normalized attack rates did not rise proportionally, suggesting a meaningful “population effect” behind the higher headline totals. Still, the per-user line has moved up from its post-2019 lows, roughly back toward the levels seen during the 2021 cycle, even as the “attacks per $ of market cap” line remains comparatively flat in recent years.

Geography adds another uncomfortable layer. A regional table in the dashboard shows Western Europe (73 attacks) and North America (64) as the two largest buckets by incident count, with Asia-Pacific also substantial (53). But the most lethal outcomes cluster elsewhere: Latin America shows a 21% fatality rate and Africa 17%, versus 0% in North America. Qureshi underscored that point directly: “Notably, there have been 0 fatalities in North America ever,” he wrote, adding that the “lion’s share” of fatalities are in Latin America and Africa.
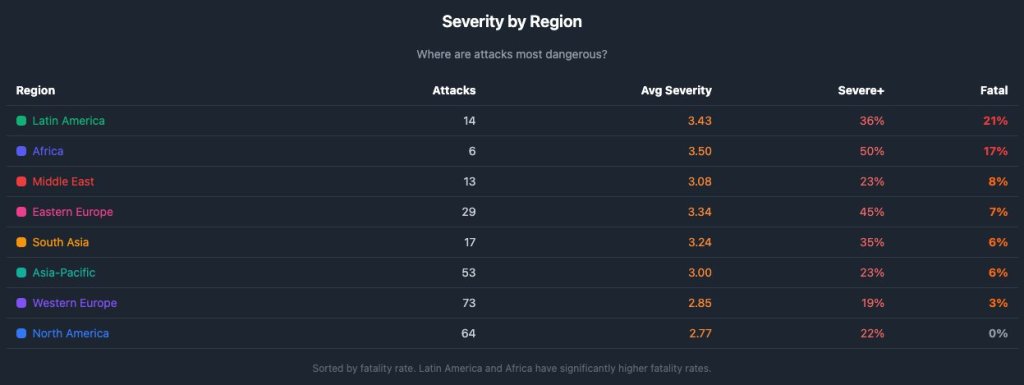
Severity by region | Source: X @hosseeb

Lopp, who has maintained the underlying “Bitcoin Wrench Attack” archive for years, has warned the workload and frequency are becoming harder to treat as isolated incidents. “When an event goes from being rare to happening every few days, it’s no longer newsworthy — it’s just a fact of life,” he wrote in a Dec. 21 post cited in the thread, while inviting others to help maintain the database.

At press time, the total crypto market cap stood at $3.12 trillion.
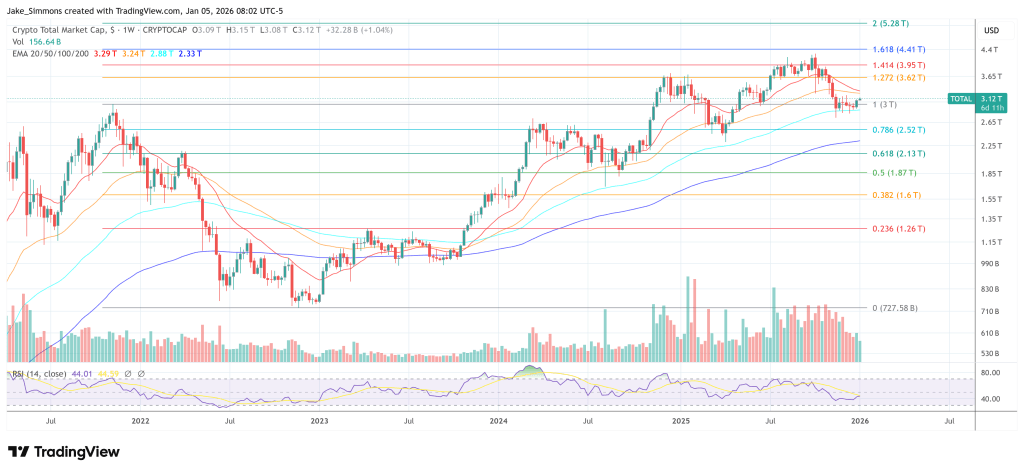
Total crypto market cap recovers above the 2021 high, 1-week chart | Source: TOTAL on TradingView.com

Пов'язані питання

QAccording to the analysis, what is the relationship between crypto market capitalization and violent attacks?

AThe analysis shows a correlation between higher crypto prices and increased attacks, with a regression R2 of 0.45 indicating that approximately 45% of the variation in reported violence is explained by market cap alone.

QWhich regions have the highest fatality rates in crypto-related attacks, according to the data?

ALatin America has a 21% fatality rate and Africa has a 17% fatality rate in crypto-related attacks, while North America has recorded 0% fatalities.

QWhat does the normalized attack rate analysis reveal about per-user risk over time?

AThe normalized attack rate shows that risk per user spiked in earlier market eras (2015 and 2018), fell sharply after 2019, but has recently ticked higher toward 2021 levels, though it didn't rise proportionally to the dramatic expansion of crypto users.

QHow are the severity of attacks distributed across the 269 incidents analyzed?

AThe severity distribution is heavily skewed toward serious outcomes: 51% were 'Serious', 21% 'Severe', 5% 'Fatal', 14% 'Moderate', and 9% 'Minor'.

QWhat trend does Jameson Lopp observe regarding the frequency of these attacks?

AJameson Lopp notes that attacks have moved from being rare events to happening every few days, making them 'no longer newsworthy' but rather 'a fact of life' in the crypto space.

Пов'язані матеріали

As Consensus Accelerates, What Are Young Investors Betting On?

Title: As Consensus Forms Faster, What Are Young Investors Betting On? In the rapid evolution of tech investment, a new generation of young investors is navigating a landscape where AI, robotics, commercial aerospace, and quantum computing are advancing simultaneously. Traditional investment logic based on financial models is giving way to a need for deep technical understanding and the ability to act before industry consensus forms. An analysis of trends from the "WAIC FUTURE TECH" list of young investment leaders reveals key shifts in focus. The first major trend is the movement of AI from the digital screen into the physical world. Investment is shifting from large language models and chatbots towards embodied AI, robotics, AI hardware, and edge computing. While demonstrations generate excitement, the real challenge lies in achieving scalable, reliable, and cost-effective delivery in complex real-world environments like factories and logistics. Success depends not just on algorithms but on the integration of sensors, actuators, and control systems. Second, the competitive focus for large models is moving beyond raw capability toward building an "intelligence flywheel." The goal is to create self-reinforcing systems where user interaction generates data, improving the model, which in turn enhances the user experience and attracts more engagement. Companies that successfully embed AI into workflows to create these closed-loop systems can build lasting value that isn't easily erased by the next model upgrade. Third, facing a potential bottleneck in high-quality human-generated data, investors are looking at new underlying technologies. Reinforcement learning and self-play, as demonstrated by AlphaGo Zero, offer paths for AI to generate its own experience. Scientific foundation models, which aim to build general AI capabilities for fields like life sciences and materials discovery, represent a non-consensus direction that could unlock new frontiers of knowledge and data. Finally, in deep-tech areas like quantum computing, commercial aerospace, and space-based infrastructure, patient capital is essential. These fields have long, uncertain development and validation cycles involving complex engineering, supply chains, and regulations. Investment here requires a long-term view, focusing on foundational team capabilities and the eventual emergence of market demand, even if commercial returns are distant. Collectively, these trends illustrate how young investors are adapting to a new era. They are learning to make earlier, technically-informed judgments, balance hype with real-world viability, and provide the patient capital needed to build the deep-tech foundations of the future.

marsbit27 хв тому

As Consensus Accelerates, What Are Young Investors Betting On?

marsbit27 хв тому

Can Japan Buy Growth with AI? Will the Bond Market Believe It?

Japan's cabinet has introduced the 2026 Basic Policy on Economic and Fiscal Management and Reform, shifting its primary fiscal target. The new framework moves away from the traditional annual primary balance goal and instead prioritizes a stable reduction of the debt-to-GDP ratio. This change is tied to a strategy of increased "responsible proactive fiscal" spending, aiming to boost long-term growth through investments in strategic sectors like AI, semiconductors, energy, and robotics. The government estimates total public and private investment in 62 key technologies could exceed 370 trillion yen by 2040. The market reaction has been mixed and cautious. While equity markets may respond to policy signals, bond markets are focused on fiscal credibility. Concerns center on whether the weakening of the clear primary balance anchor could lead to looser fiscal discipline. If investors doubt that these strategic investments will generate sufficient productivity gains, tax revenue, and nominal growth to outpace rising interest costs, they may demand higher yields on Japanese Government Bonds (JGBs). Recent volatility in the yen and JGB yields, with the 10-year yield briefly reaching 2.9%, reflects this skepticism. The success of this new framework hinges on two factors: whether Japan can achieve a nominal growth rate consistently higher than its long-term interest rates, and whether future budgets demonstrate disciplined control over bond issuance. The government's narrative is that strategic investment is essential to break Japan's cycle of low growth, aging, and labor shortages. However, the bond market will continuously assess the credibility of this plan, pricing the risk that it may represent fiscal expansion rather than a viable growth strategy.

marsbit1 год тому

Can Japan Buy Growth with AI? Will the Bond Market Believe It?

marsbit1 год тому

Misjudged A-Shares: Resilience, Expectations, and Confidence

China's A-share market recently faced selling pressure, especially in tech sectors, initially triggered by a global tech sell-off that began in South Korea. However, the article argues this is a case of "mistaken injury" and highlights the market's underlying resilience. This resilience stems from three main pillars: **1) Tech Sector Fundamentals:** Unlike Korea's market dominated by a few memory chip stocks, China's tech sector is diversified across computing, communications, electronics, and semiconductors, supported by dual narratives of global AI supply chains and domestic substitution. Core areas like optical modules and fiber optics continue to show strong earnings growth. **2) "National Team" Support:** State-backed institutions and large corporations have made significant market purchases and announced buybacks, providing liquidity and signaling confidence. This is seen as a stabilizing policy signal, often associated with market bottoms. **3) Broader Market Pillars:** Other major sectors are showing endogenous recovery momentum. Consumer stocks benefit from stabilizing CPI and signs of sector recovery (e.g., liquor price hikes). Cyclical sectors like aluminum have high earnings, potential price increases due to tight supply, and low valuations. The financial sector offers stable dividends and low valuations. The conclusion is that the sell-off was driven by external contagion, not a collapse in fundamentals. With strong policy support and recovering momentum across key sectors, the A-share market possesses the toughness to regain stability.

marsbit1 год тому

Misjudged A-Shares: Resilience, Expectations, and Confidence

marsbit1 год тому

Торгівля

Спот
活动图片





