Violent Attacks On Crypto Holders Escalate Worldwide, Data Shows

bitcoinistОпубліковано о 2026-01-06Востаннє оновлено о 2026-01-06

Анотація

Data shows a significant escalation in violent "wrench attacks" – physical robberies and kidnappings targeting cryptocurrency holders to force asset transfers – both in frequency and severity worldwide. Security researcher Haseeb Qureshi analyzed an incident database maintained by Jameson Lopp, finding 269 categorized attacks, with over half classified as "Serious" and 5% as "Fatal." The data indicates attacks are becoming more violent over time, with 2025 showing the highest incident count. Approximately 45% of the variation in attacks is explained by crypto market capitalization, meaning higher prices correlate with more incidents. However, when normalized per user (using Coinbase active users as a proxy), attack rates spiked in earlier market cycles, fell after 2019, and have recently risen again toward 2021 levels. Geographically, Western Europe and North America have the most incidents, but Latin America and Africa have significantly higher fatality rates. Notably, zero fatal attacks have occurred in North America. Researchers warn these events are transitioning from rare occurrences to a recurring risk for crypto participants.

Violent “wrench attacks” against crypto holders, physical robberies and kidnappings meant to force victims to hand over coins, appear to be rising in absolute terms and trending more severe, according to a new visualization built from a long-running incident database maintained by security researcher Jameson Lopp.

Dragonfly partner Haseeb Qureshi said he analyzed Lopp’s dataset and built an interactive dashboard to stress-test a question many traders and builders have been asking quietly for years: is simply holding crypto becoming physically more dangerous? “You’re not imagining it: the number of attacks has been increasing over time,” Qureshi wrote on X. “Not only that, the attacks are getting more violent.”
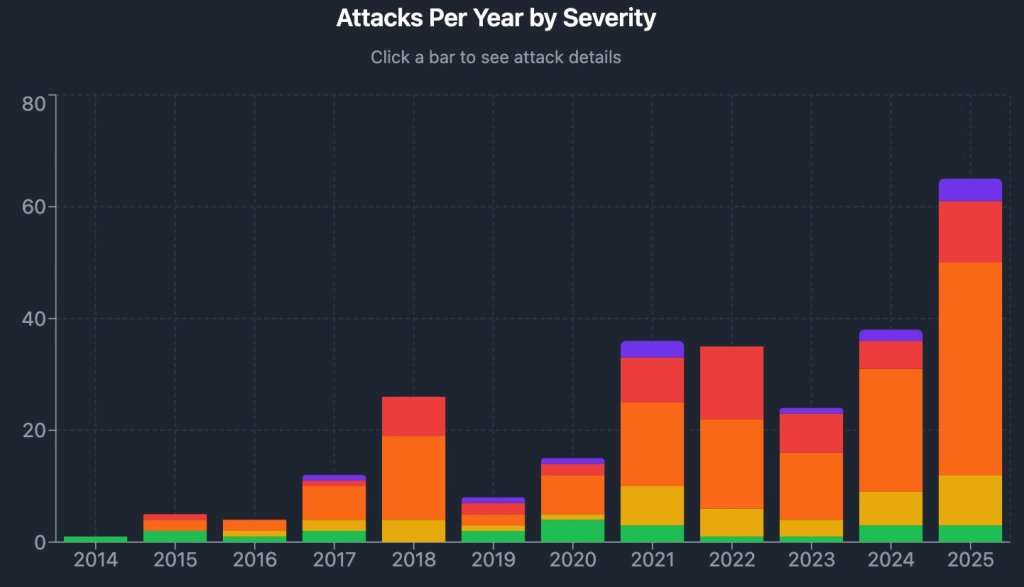
Attacks per year by severity | Source: X @hosseeb

The dashboard breaks reported incidents into five severity bands — Minor, Moderate, Serious, Severe, and Fatal and the distribution skews heavily toward the sharp end of the spectrum. Of 269 categorized incidents shown, 137 (51%) were labeled “Serious,” 57 (21%) “Severe,” and 13 (5%) “Fatal,” with the remainder split between 39 (14%) “Moderate” and 23 (9%) “Minor.”

The year-by-year bars show the later years carrying a larger share of “Severe” and “Fatal” outcomes than the early history of the dataset, with 2025 appearing as the highest-incident year on the chart.
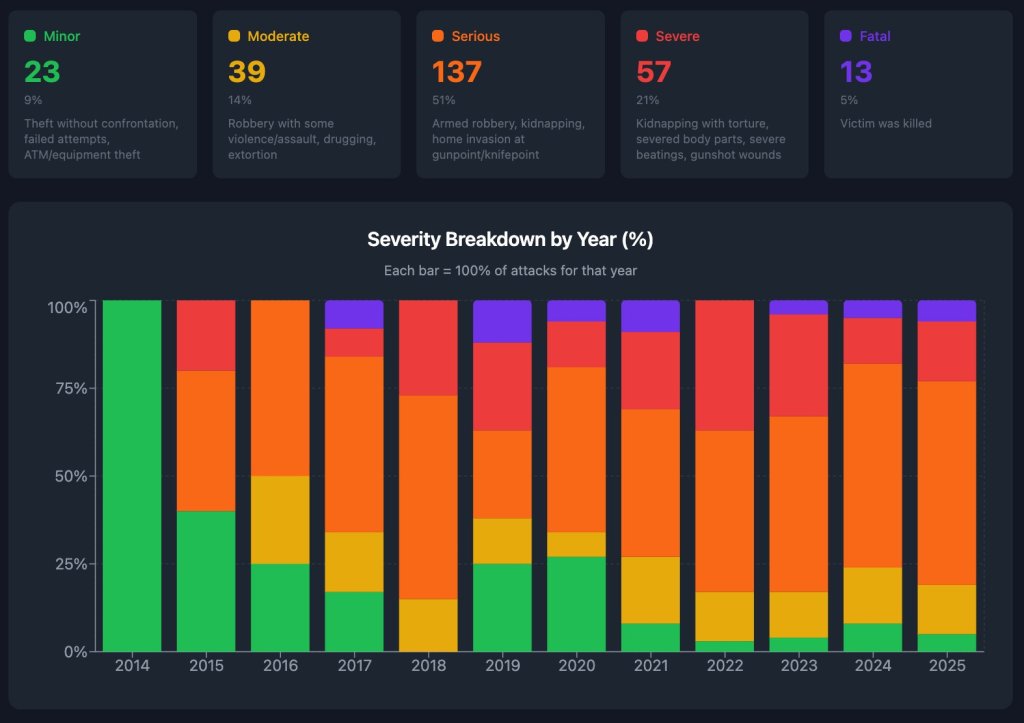
Severity breakdown by year | Source: X @hosseeb

Qureshi’s analysis also puts a number on the most intuitive driver: price. Charting incidents against total crypto market capitalization, he reported a simple regression with an R2 of 0.45 — implying roughly 45% of the variation in reported violence is explained by market cap alone. In plain terms, higher prices coincide with more attacks.

But the more consequential question for everyday holders is not raw counts; it’s risk per person. Because comprehensive “number of crypto users” data is hard to pin down, Qureshi used Coinbase monthly active users as a proxy, and separately normalized incidents by market cap to approximate attacks per dollar of wealth.

The resulting “normalized attack rates” chart tells a less linear story: per-user attack rates spiked in earlier market eras (notably around 2015 and again in 2018), then fell sharply after 2019, before ticking higher in the most recent observations. “So is that it?” Qureshi asked. “Proof crypto is becoming more physically dangerous?”
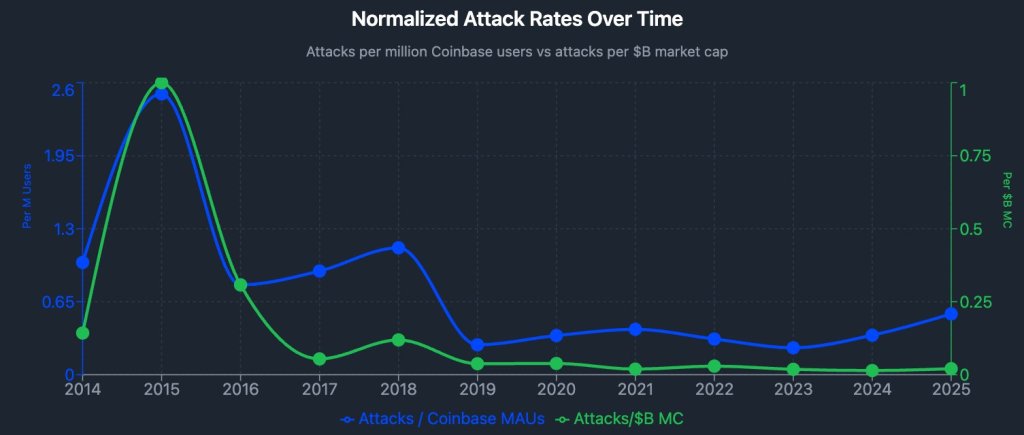
Normalized attack rate over time | Source: X @hosseeb

On his telling, not quite. Coinbase MAUs, he noted, expanded dramatically over the decade, while normalized attack rates did not rise proportionally, suggesting a meaningful “population effect” behind the higher headline totals. Still, the per-user line has moved up from its post-2019 lows, roughly back toward the levels seen during the 2021 cycle, even as the “attacks per $ of market cap” line remains comparatively flat in recent years.

Geography adds another uncomfortable layer. A regional table in the dashboard shows Western Europe (73 attacks) and North America (64) as the two largest buckets by incident count, with Asia-Pacific also substantial (53). But the most lethal outcomes cluster elsewhere: Latin America shows a 21% fatality rate and Africa 17%, versus 0% in North America. Qureshi underscored that point directly: “Notably, there have been 0 fatalities in North America ever,” he wrote, adding that the “lion’s share” of fatalities are in Latin America and Africa.
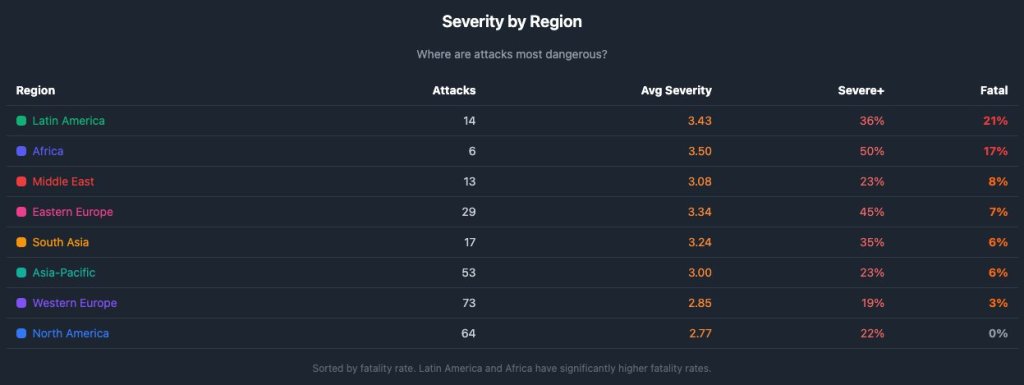
Severity by region | Source: X @hosseeb

Lopp, who has maintained the underlying “Bitcoin Wrench Attack” archive for years, has warned the workload and frequency are becoming harder to treat as isolated incidents. “When an event goes from being rare to happening every few days, it’s no longer newsworthy — it’s just a fact of life,” he wrote in a Dec. 21 post cited in the thread, while inviting others to help maintain the database.

At press time, the total crypto market cap stood at $3.12 trillion.
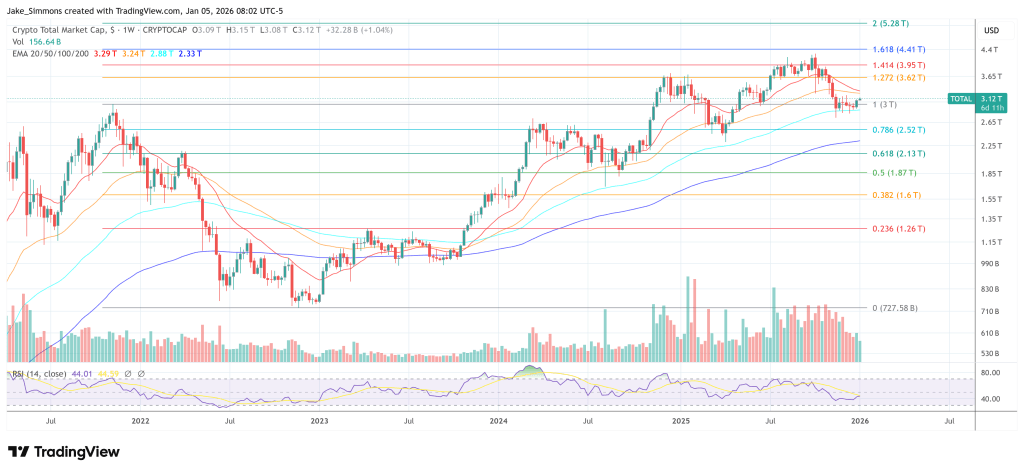
Total crypto market cap recovers above the 2021 high, 1-week chart | Source: TOTAL on TradingView.com

Пов'язані питання

QAccording to the analysis, what is the relationship between crypto market capitalization and violent attacks?

AThe analysis shows a correlation between higher crypto prices and increased attacks, with a regression R2 of 0.45 indicating that approximately 45% of the variation in reported violence is explained by market cap alone.

QWhich regions have the highest fatality rates in crypto-related attacks, according to the data?

ALatin America has a 21% fatality rate and Africa has a 17% fatality rate in crypto-related attacks, while North America has recorded 0% fatalities.

QWhat does the normalized attack rate analysis reveal about per-user risk over time?

AThe normalized attack rate shows that risk per user spiked in earlier market eras (2015 and 2018), fell sharply after 2019, but has recently ticked higher toward 2021 levels, though it didn't rise proportionally to the dramatic expansion of crypto users.

QHow are the severity of attacks distributed across the 269 incidents analyzed?

AThe severity distribution is heavily skewed toward serious outcomes: 51% were 'Serious', 21% 'Severe', 5% 'Fatal', 14% 'Moderate', and 9% 'Minor'.

QWhat trend does Jameson Lopp observe regarding the frequency of these attacks?

AJameson Lopp notes that attacks have moved from being rare events to happening every few days, making them 'no longer newsworthy' but rather 'a fact of life' in the crypto space.

Пов'язані матеріали

After the Fed's Interest Rate Decision and Comments from Kevin Walsh, Experts Gathered and Shared Their Latest Insights!

Following the Fed's decision to hold interest rates steady, experts highlight a potential shift towards more independent policymaking within the FOMC, as three members dissented. Market strategists note the slight decline in bond yields and a weaker dollar post-announcement, but caution that a rate hike in September remains possible. Experts like Mark Hackett point to the three dissenting votes as a sign of growing committee independence. While markets initially rallied in relief, the final direction hinges on Fed Chair Kevin Warsh's upcoming press conference. Analysts, including Audrey Childs-Freeman, interpret the dissent as the Fed maintaining a hawkish stance. They suggest the Fed will continue monitoring data, with a summer scenario of high bond yields supporting the dollar still in play. Chris Anstey emphasizes that markets will closely watch the 10-year Treasury yield during Warsh's conference. A continued rise could signal investor fears that the Fed is not acting aggressively enough on inflation, posing a challenge for the Chair. The long-term yield is also viewed as critical for mortgages and economic management. Diane Swonk of KPMG argues a September rate hike is likely, stating that an increase now would have been more appropriate given nearly five years of high inflation. She warns that prolonged high prices risk becoming embedded in the economic system. *This is not investment advice.

cryptonews.ru32 хв тому

After the Fed's Interest Rate Decision and Comments from Kevin Walsh, Experts Gathered and Shared Their Latest Insights!

cryptonews.ru32 хв тому

USDT Supply Shrinks by $5.5 Billion While Stablecoin Turnover Hits Record High

The supply of stablecoins has contracted for the first time in years, with total market capitalization falling 4.3% from its May peak to $308.5 billion. Despite this decline, June saw a record $1.83 trillion in adjusted transaction volume for stablecoins, a 60% increase from May. This divergence suggests a shift in usage patterns: less capital is sitting idle, while the remaining supply circulates more rapidly through payment and trading systems. Specifically, the supply of Tether's USDT decreased from approximately $189.54 billion to $184 billion between May 1 and July 29, while Circle's USDC supply fell from $77.27 billion to $72.41 billion. Part of this capital appears to have moved into tokenized Treasury products, a sector whose value has grown to over $16 billion, partly driven by regulations like the 2025 GENIUS Act that prohibit interest payments on payment-focused stablecoins. Transaction velocity is emerging as a key metric, with stablecoins now turning over about six times per month—double the rate from two years ago. USDC, despite having a smaller supply than USDT, processed about $1.21 trillion in adjusted volume in June, leading in settlement activity. While a significant portion of on-chain volume may not represent genuine economic payments, identifiable real-world payments have grown sharply, reaching an estimated $390 billion in 2025. The data indicates stablecoins are evolving from static collateral into active financial infrastructure.

cryptonews.ru57 хв тому

USDT Supply Shrinks by $5.5 Billion While Stablecoin Turnover Hits Record High

cryptonews.ru57 хв тому

Торгівля

Спот
活动图片