Unsteady Ground, Room to Bounce

insights.glassnodeОпубліковано о 2026-03-04Востаннє оновлено о 2026-03-04

Анотація

Bitcoin remains in a tenuous consolidation below the $70k resistance level, with weakening buy-side momentum and declining realized profits. The Percent of Supply in Profit has fallen to levels historically associated with early bear markets. Short-term holder cost basis near $70k presents a key resistance zone. However, signs of stabilization are emerging: spot and ETF selling pressure is moderating, derivatives leverage is compressing, and options markets show fading downside fear with growing upside call interest around the $75k strike. The market appears to be transitioning from a stressed regime toward a more balanced state, though a sustained recovery depends on renewed spot demand.

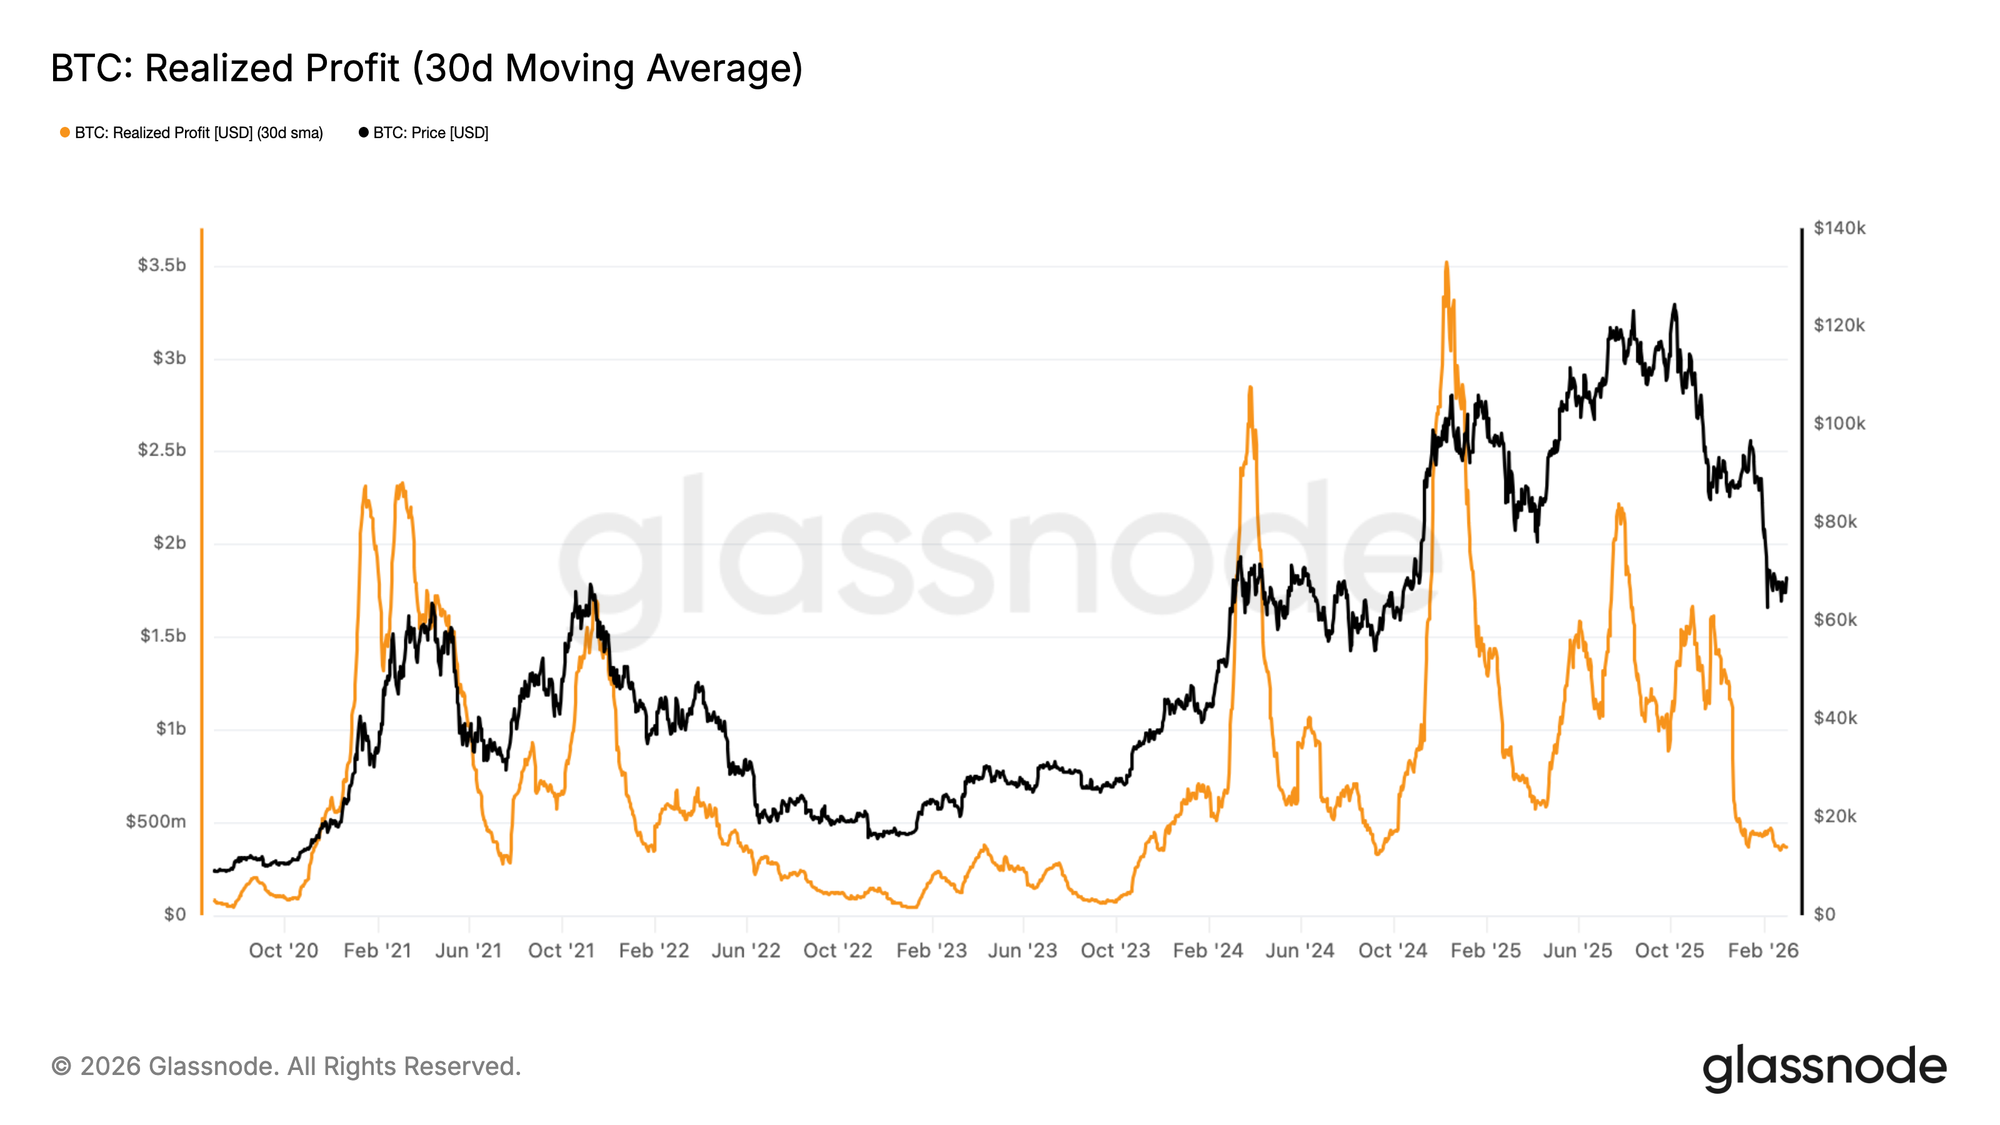
Since early February, Bitcoin has repeatedly failed to post a weekly close above $70k, establishing this region as a meaningful near-term resistance level. To assess whether this price rejection reflects a genuine deterioration in demand, we turn to the 30-day Simple Moving Average (30D-SMA) of Realized Profit, a metric that aggregates the USD-denominated profit locked in by on-chain participants at the moment coins are spent, smoothed to filter short-term noise.

As price stabilized beneath the $70K threshold, this indicator contracted sharply from above $1B per day to approximately $370M per day, a decline of roughly 63%. This compression in monthly-averaged realized profit signals that the cohort of buyers willing to transact at a premium has materially thinned, with buy-side liquidity now at its weakest since the August–September 2024 period.
Taken together, the evidence suggests that upside momentum has stalled, leaving the price in a state of directionless consolidation until fresh demand catalysts emerge.
Live Chart

Regime Detection in Bear Market

Sideways price action is a recurring structure across both bull and bear market cycles, therefore context is everything. Two periods of horizontal consolidation can carry vastly different implications depending on the underlying demand regime, making it essential to look beneath price for corroborating evidence.

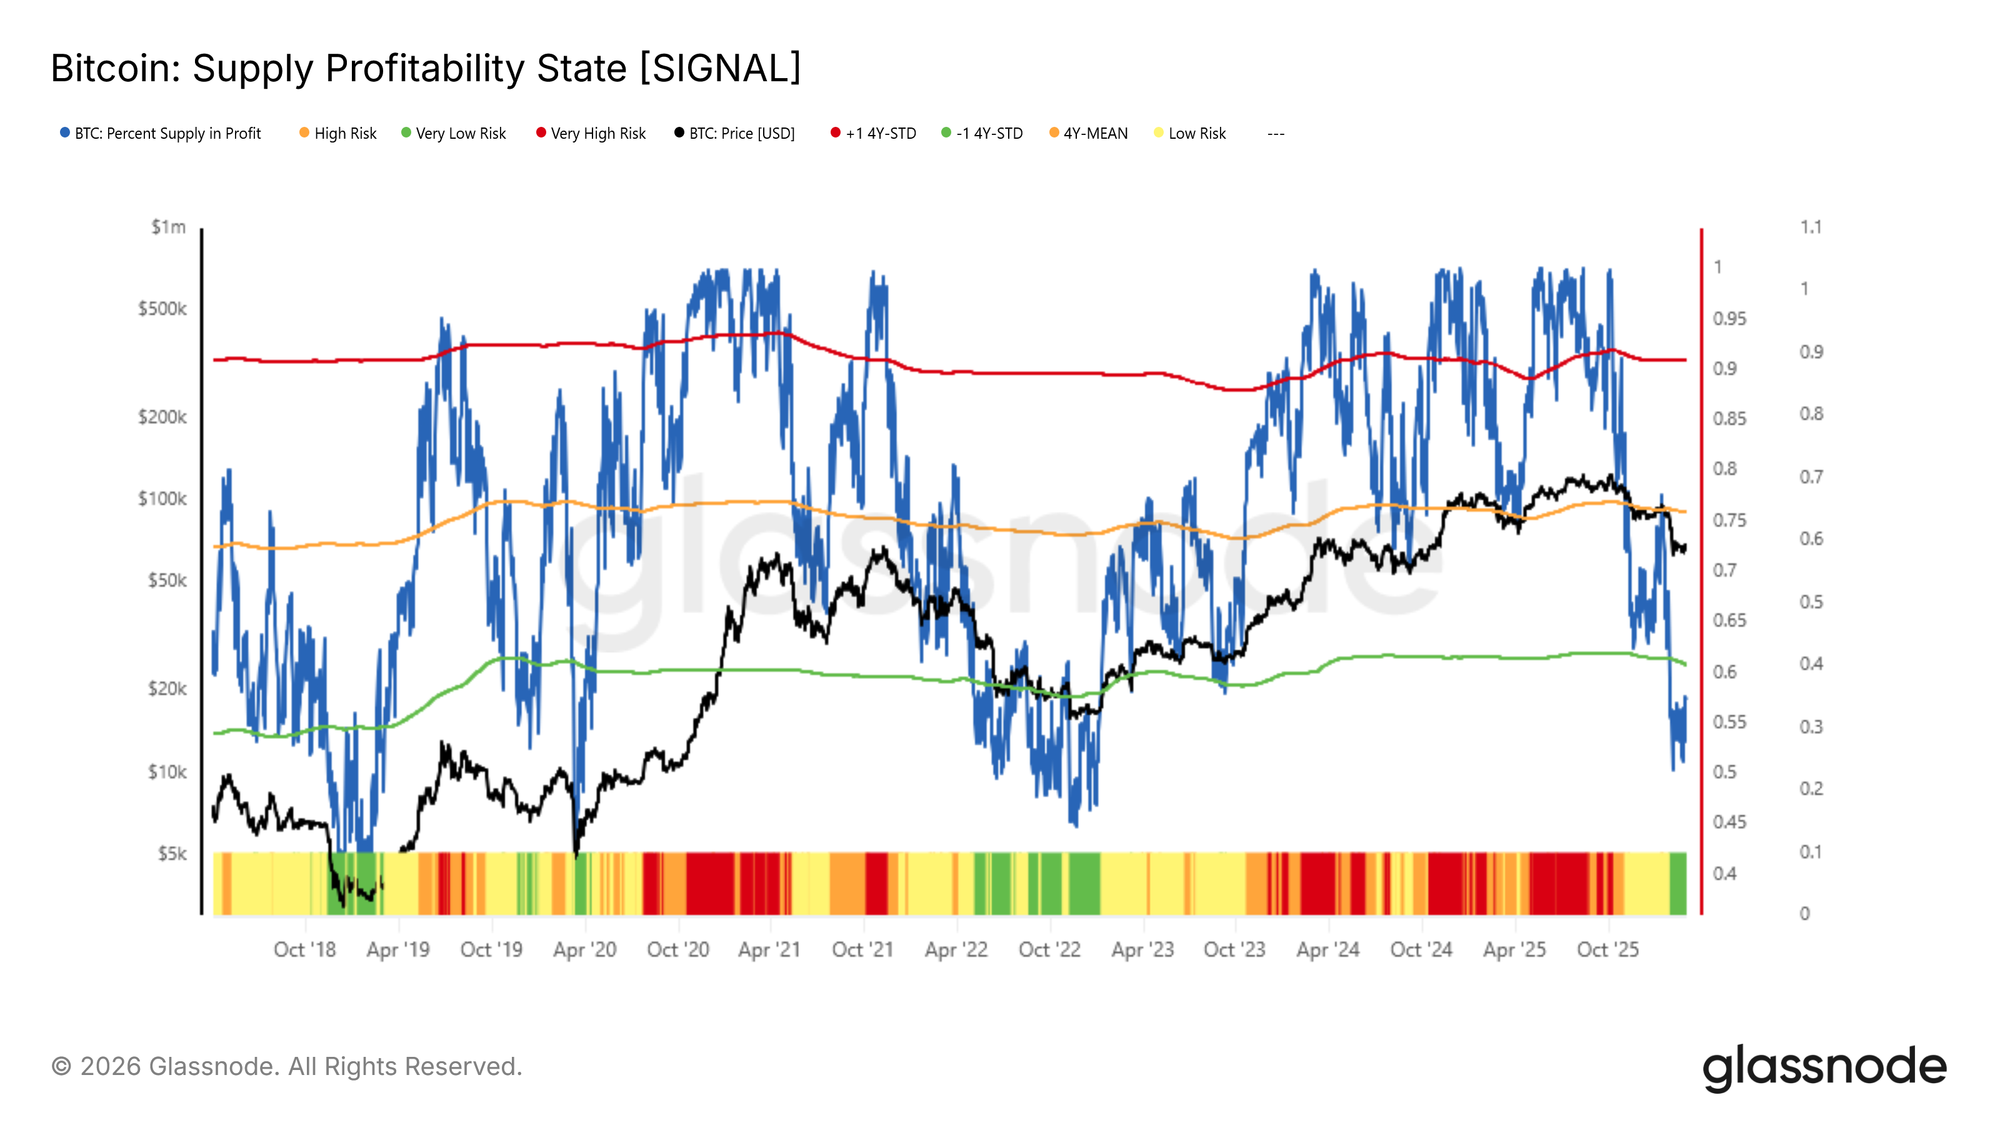
One effective lens for this purpose is the Percent of Supply in Profit, which measures the share of circulating Bitcoin supply held at an unrealized gain relative to each coin's on-chain acquisition cost.

When broadly elevated, this metric reflects widespread investor confidence; when it deteriorates, it signals a growing cohort of underwater holders, a condition historically associated with sustained selling pressure.

Since early February, this indicator has broken below its -1 standard deviation threshold near 60%, and currently sits at approximately 57%. Readings at this level have historically coincided with the early stages of deep bear markets, most notably May 2022 and November 2018. This suggests the present consolidation may be less a springboard for recovery, and more a continuation of the prevailing adverse market regime in mid-term.
Live Chart

Short-Term Relief Rallies and the Cost Basis Ceiling

Despite the headwinds posed by diminishing buy-side liquidity and a market regime starved of broad unrealized profitability, the multi-week sideways consolidation is not without a constructive interpretation. A local equilibrium of this nature can, and often does, precede short-term relief rallies.

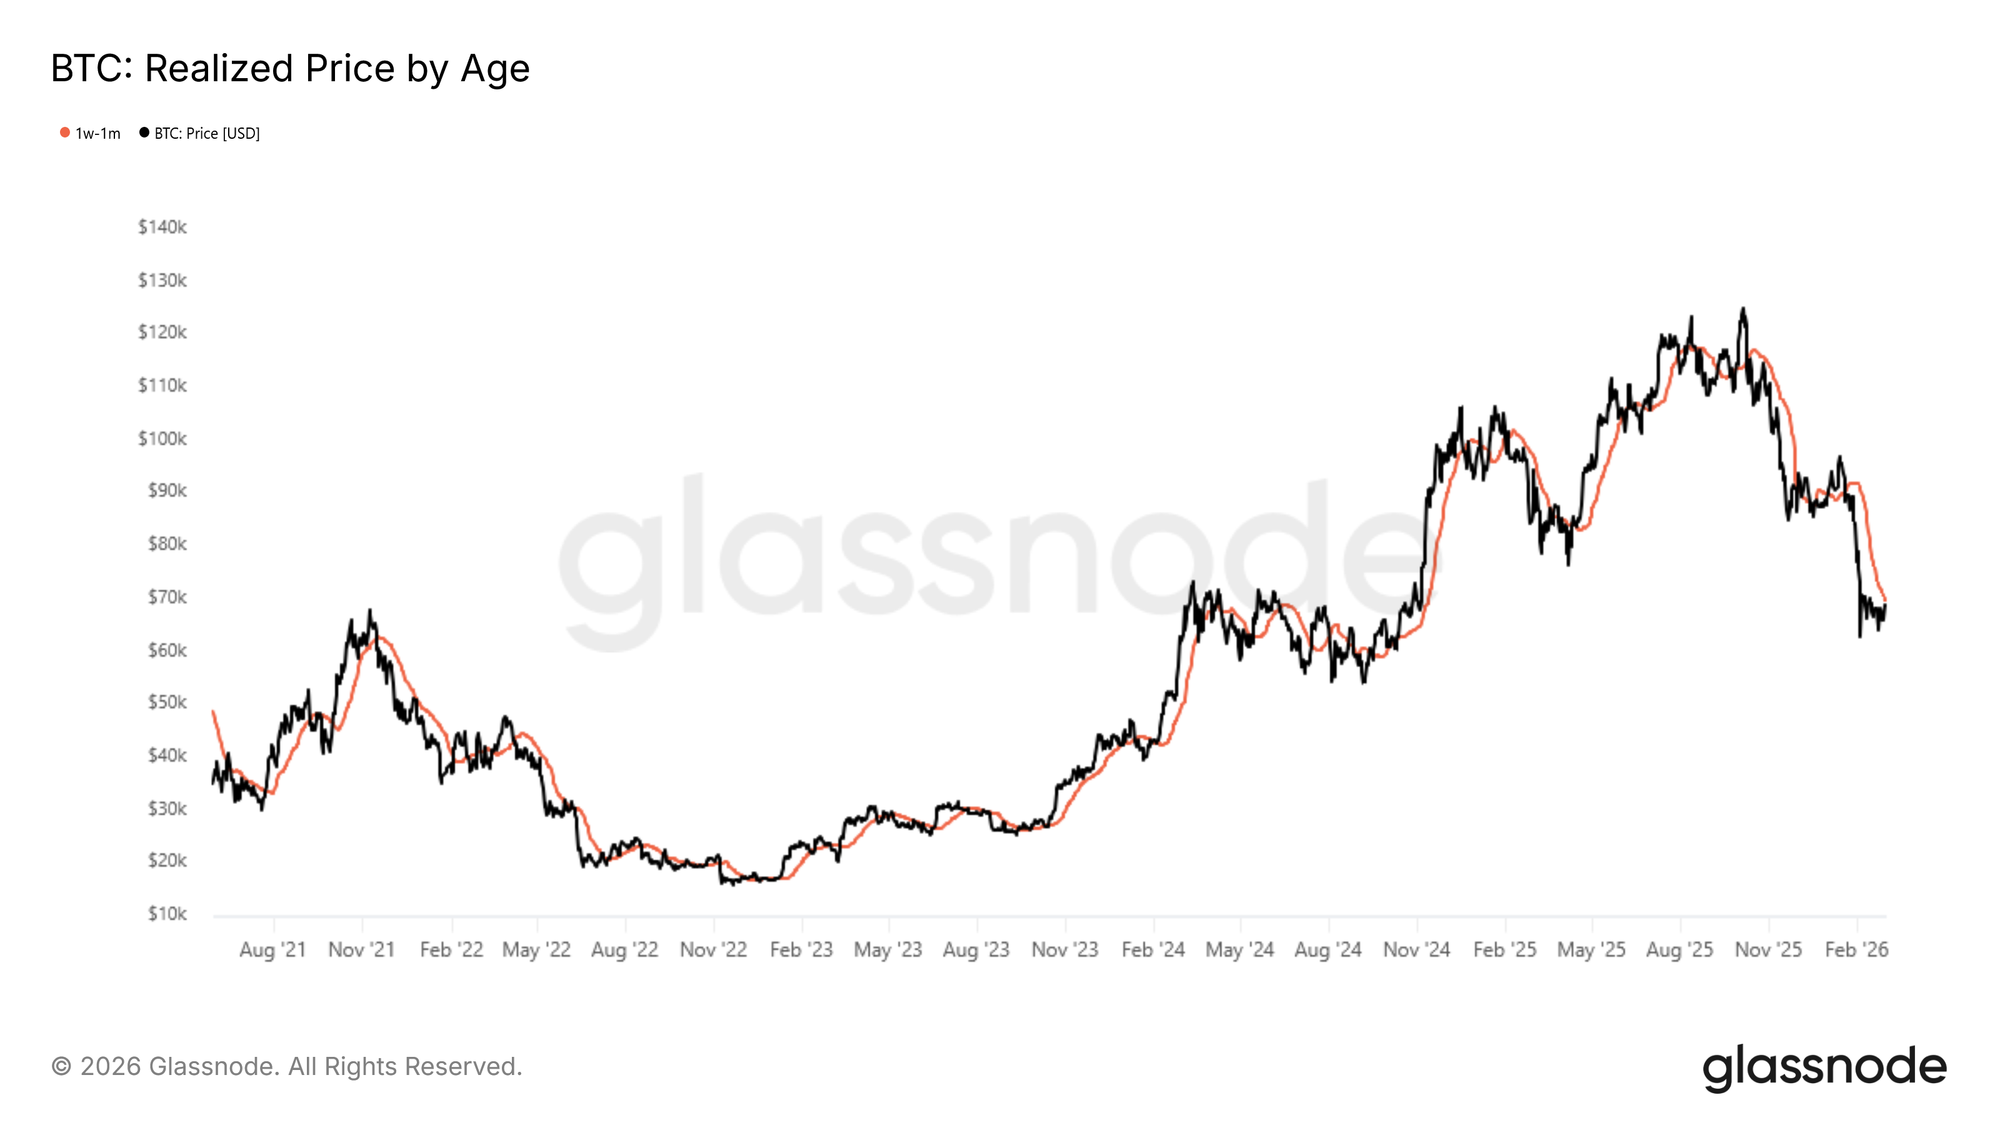
A practical on-chain tool for gauging the potential exhaustion point of such rallies is the Short-Term Holder Cost Basis, specifically for coins aged between one week and one month. This cohort represents the most recent wave of market participants, whose acquisition price acts as a key behavioral anchor: in the deeper stages of a bear market, local bounces tend to stall as these recent buyers approach breakeven, incentivizing them to exit positions or lock in thin profit margins before conditions deteriorate further.

Currently, the cost basis of this 1W–1M holder cohort sits near $70k, meaning the ±2% zone surrounding this level — roughly $68.5k to $71.5k— represents a significant potential resistance and distribution zone for any near-term price recovery.
Live Chart

Off-Chain Insights

Spot Flows Shows Signs of Recovery

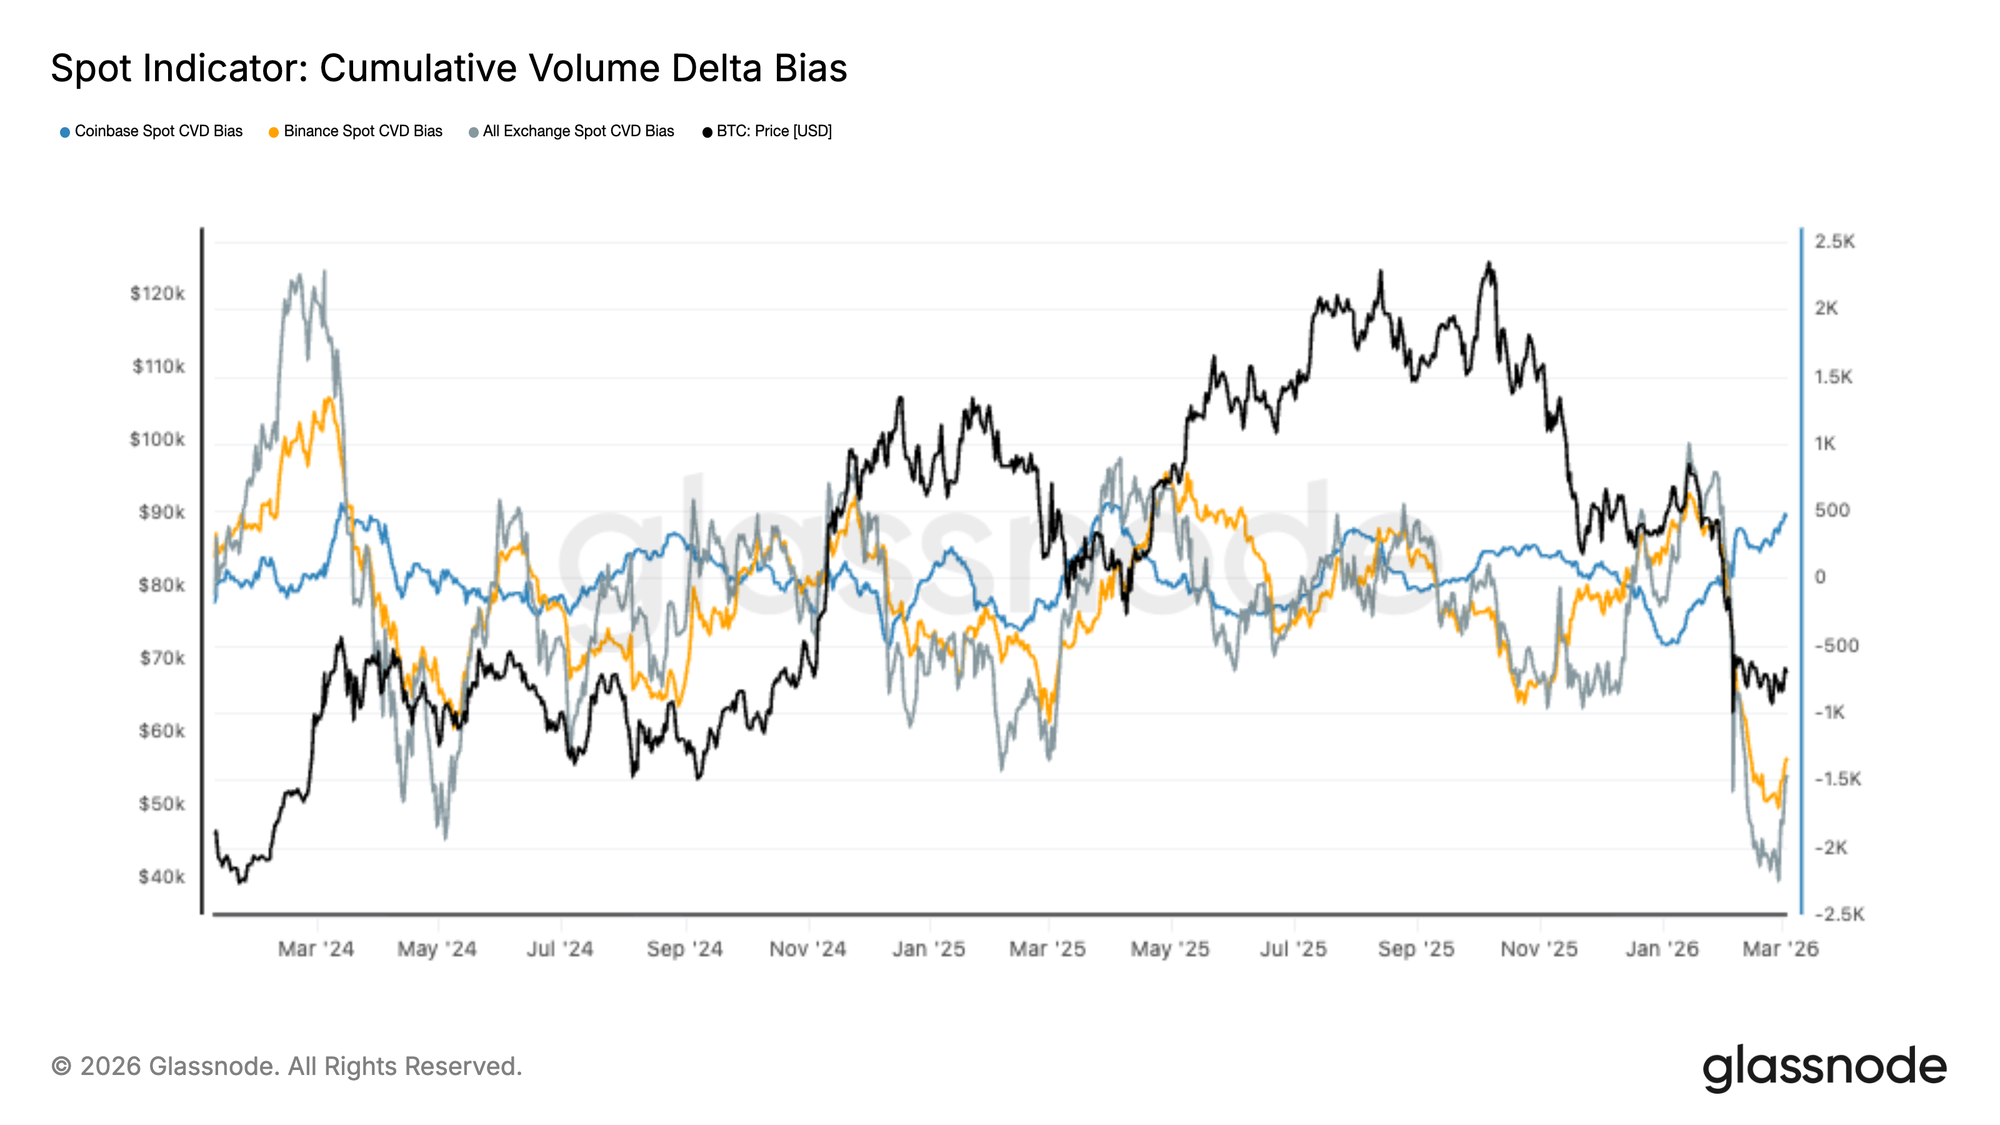
Spot markets recently experienced a sharp wave of sell-side dominance, with Cumulative Volume Delta (CVD) across major exchanges plunging to deeply negative levels as aggressive market sell orders drove the latest price drawdown.

Over the past few days, however, the pace of selling appears to be moderating. Coinbase spot CVD has begun to rebound, suggesting early signs of renewed bid-side activity, while Binance and aggregate exchange flows remain weak but are no longer accelerating lower.

This shift hints that the most intense phase of spot-driven distribution may be easing. Nevertheless, a sustained recovery will likely require broader improvement in spot bid absorption across multiple exchanges before stronger accumulation dynamics can take hold.
Live Chart

ETF Outflows Ease as Early Inflows Reappear

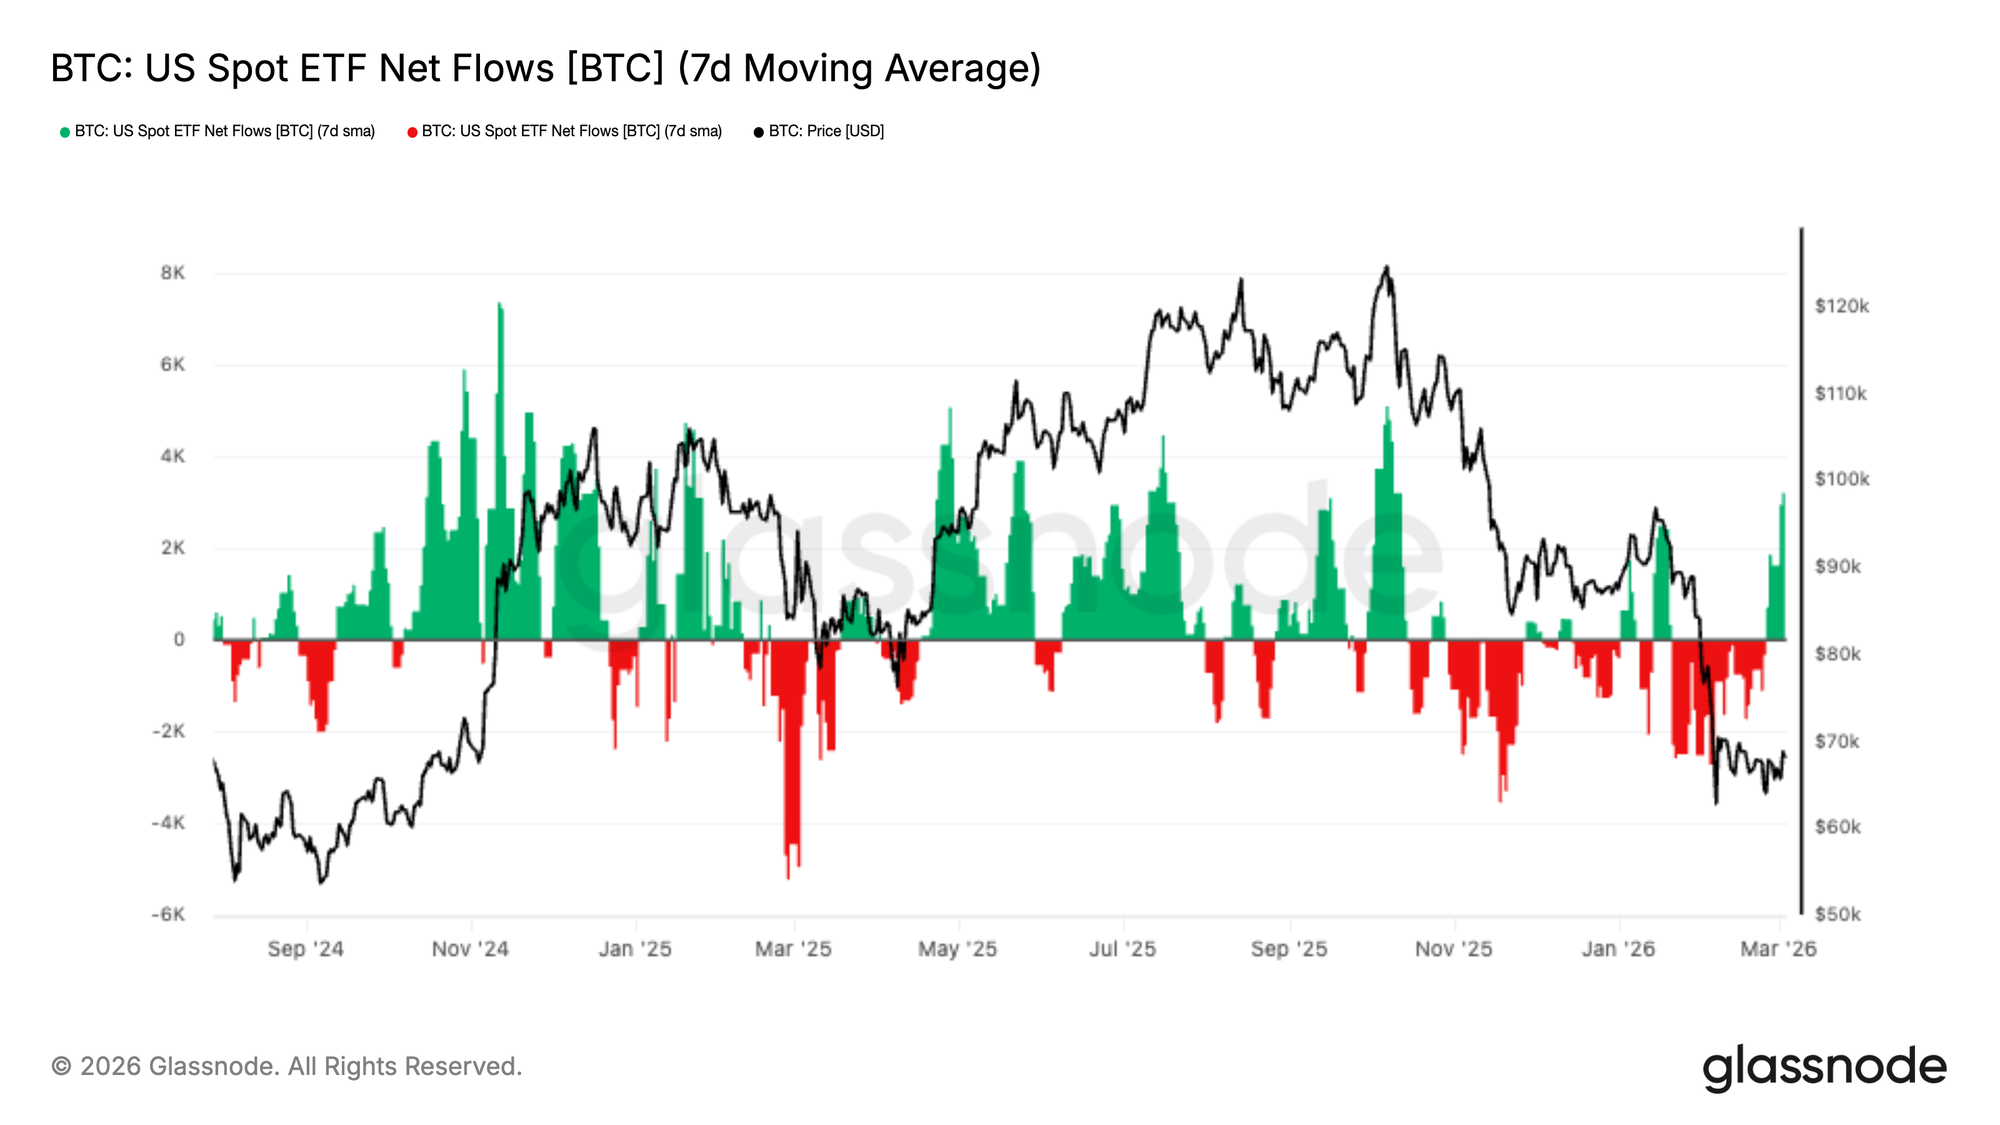
US Spot Bitcoin ETFs experienced sustained outflows during the recent market decline, reflecting persistent institutional de-risking as prices moved lower. The 7-day moving average of net flows remained negative for several weeks, reinforcing the broader risk-off environment across regulated investment channels.

Over the past few days, however, flows have begun to stabilize, with the first signs of renewed inflows emerging. This shift suggests that institutional selling pressure may be moderating as Bitcoin consolidates near recent lows.

While it is too early to confirm a durable reversal in demand, a continued recovery in ETF inflows would signal improving institutional sentiment and could provide an important source of spot-side support for the market.
Live Chart

Perpetual Premium Continues to Compress

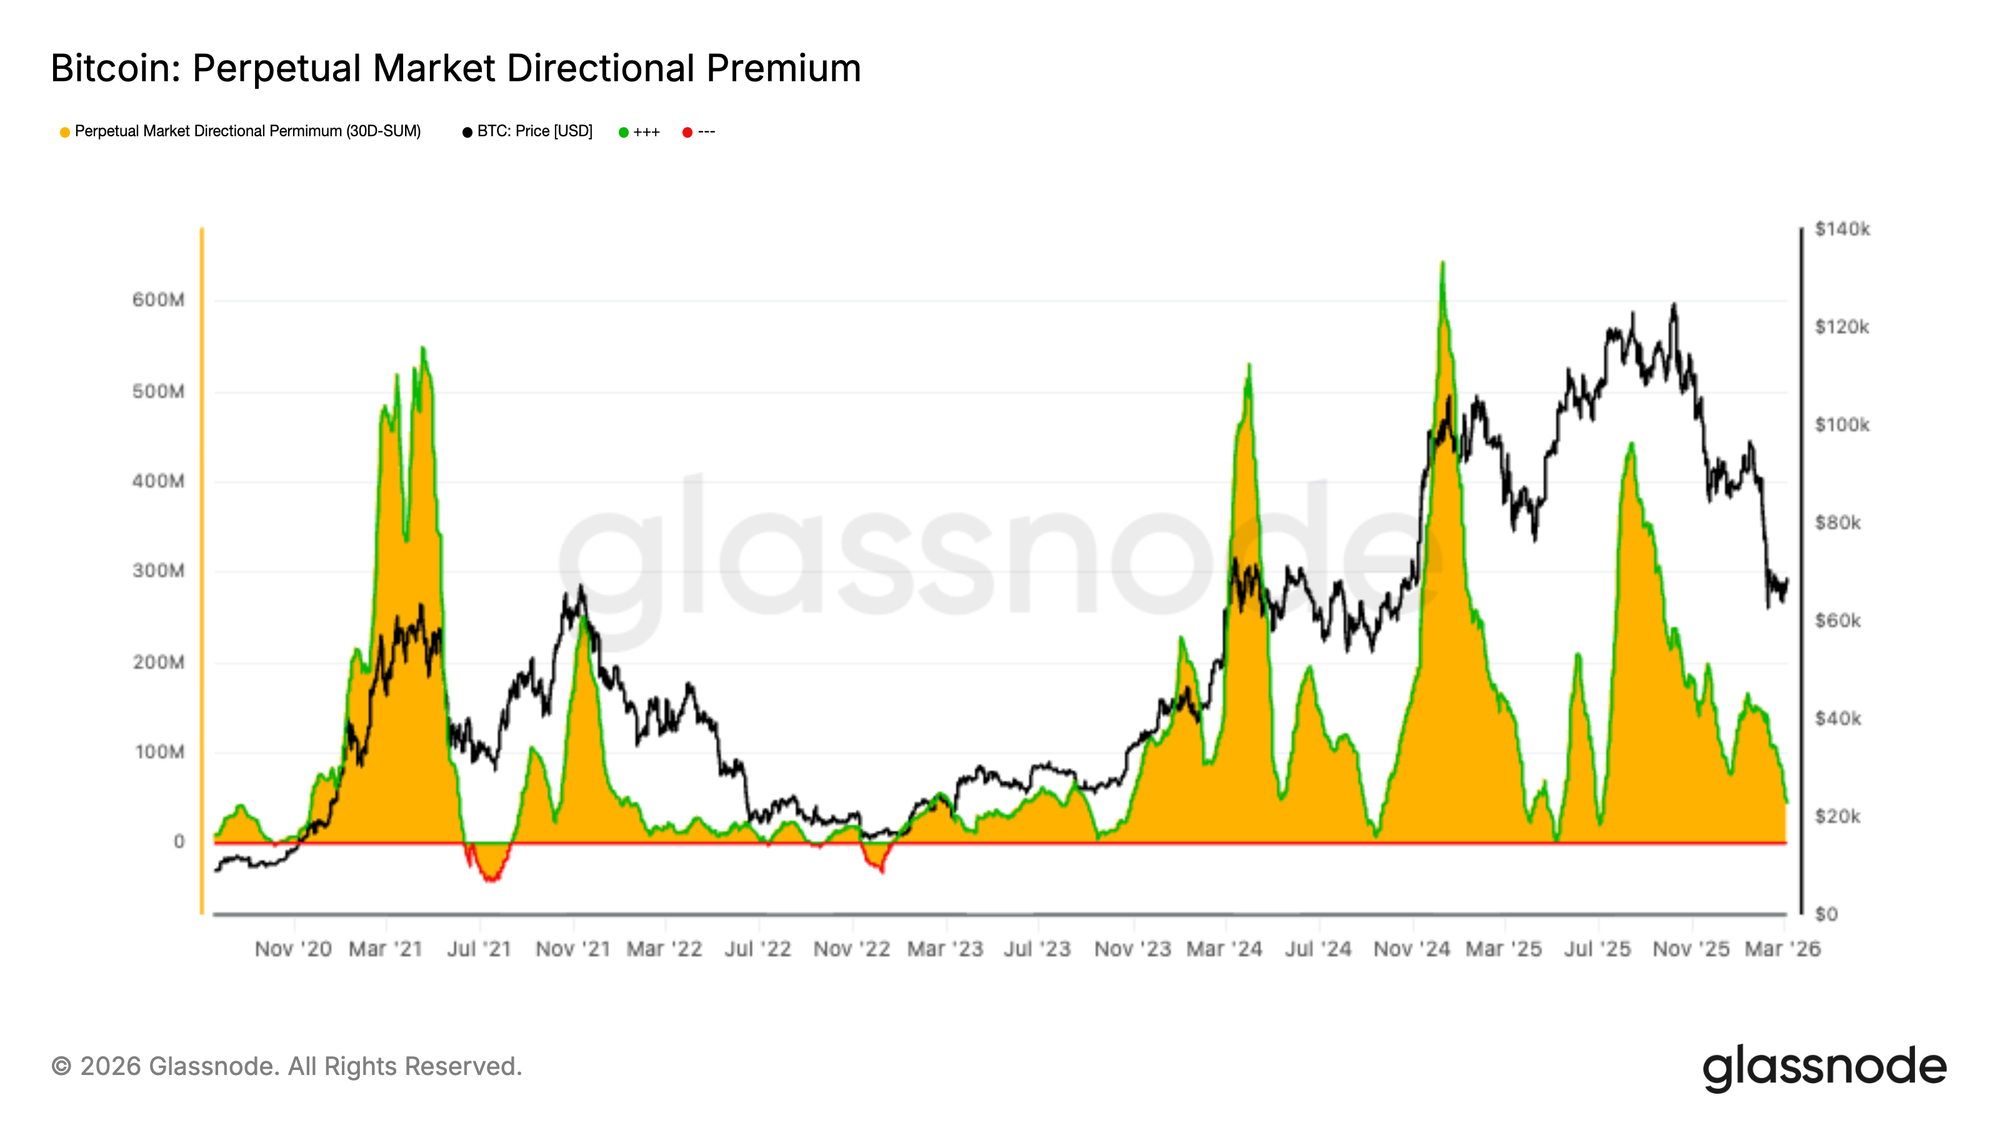
The Perpetual Market Directional Premium continues to trend lower, reflecting a sustained reduction in bullish positioning across perpetual futures markets. The metric has declined steadily in recent weeks as leverage and directional conviction have cooled alongside the broader market pullback.

Over the past few days, the premium has compressed further toward cycle lows, signalling that speculative long exposure is continuing to unwind. This dynamic suggests that derivatives traders remain cautious, with demand for leveraged upside exposure notably subdued.

While the decline reflects weakening bullish momentum, it also indicates that excess leverage is being flushed from the system. A stabilization in the premium could signal that derivatives positioning is approaching a more neutral footing.
Live Chart

Volatility Compression Signals Stabilization

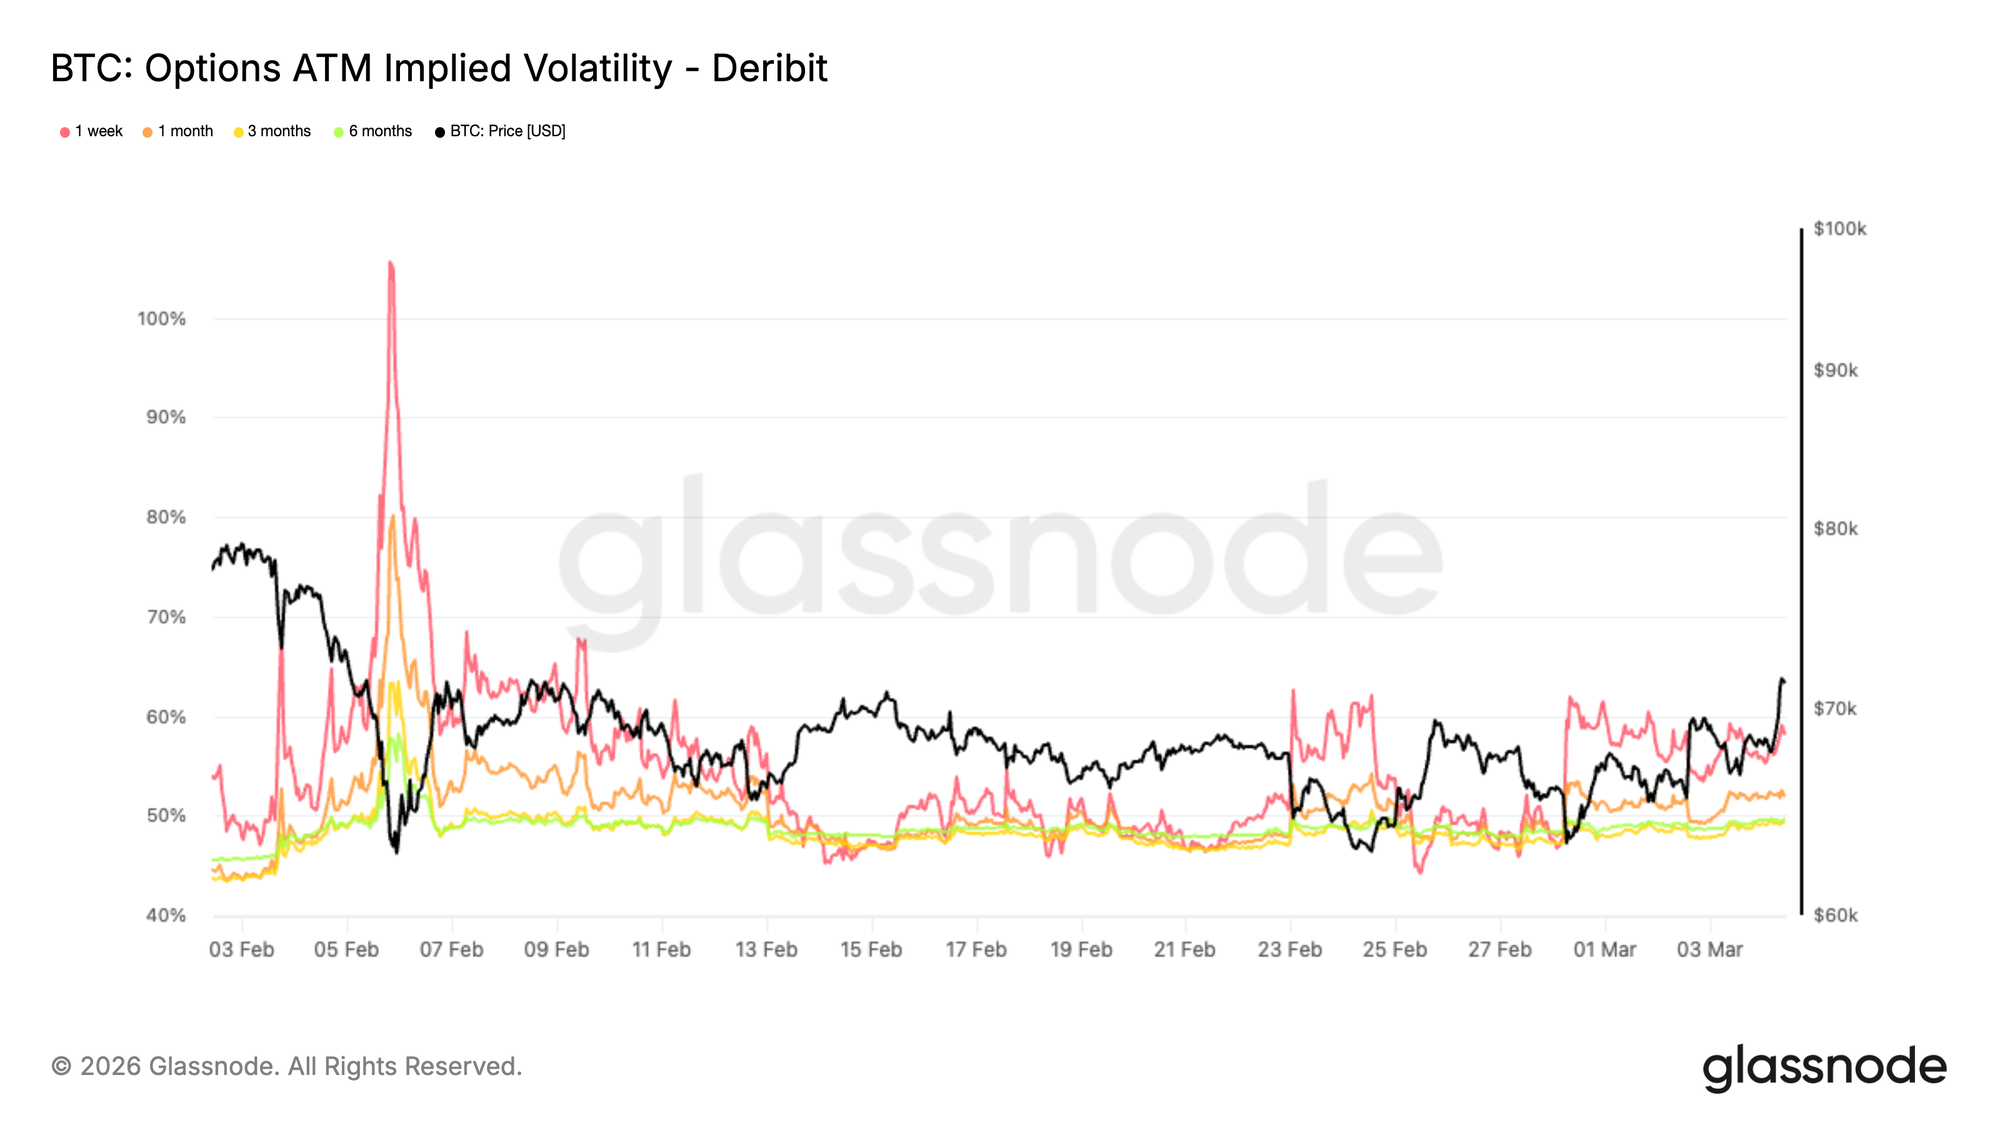
Implied volatility has continued to compress following the spike observed in early February. Across the main tenors, ATM IV has moved materially lower, indicating that traders are no longer aggressively pricing tail risk.

This shift reflects a stabilization in sentiment after a period of forced deleveraging and liquidation-driven volatility. As panic pricing fades, options markets begin transitioning from stress conditions toward a more neutral volatility regime.

Lower implied volatility also changes positioning dynamics. When volatility declines while price stabilizes, long option holders face increasing theta decay, making directional conviction more important.

For now, volatility compression suggests the market is moving away from crisis pricing and into a consolidation phase where positioning, rather than panic hedging, becomes the dominant driver of price action.
Live Chart

Skew Normalization Reflects Fading Downside Fear

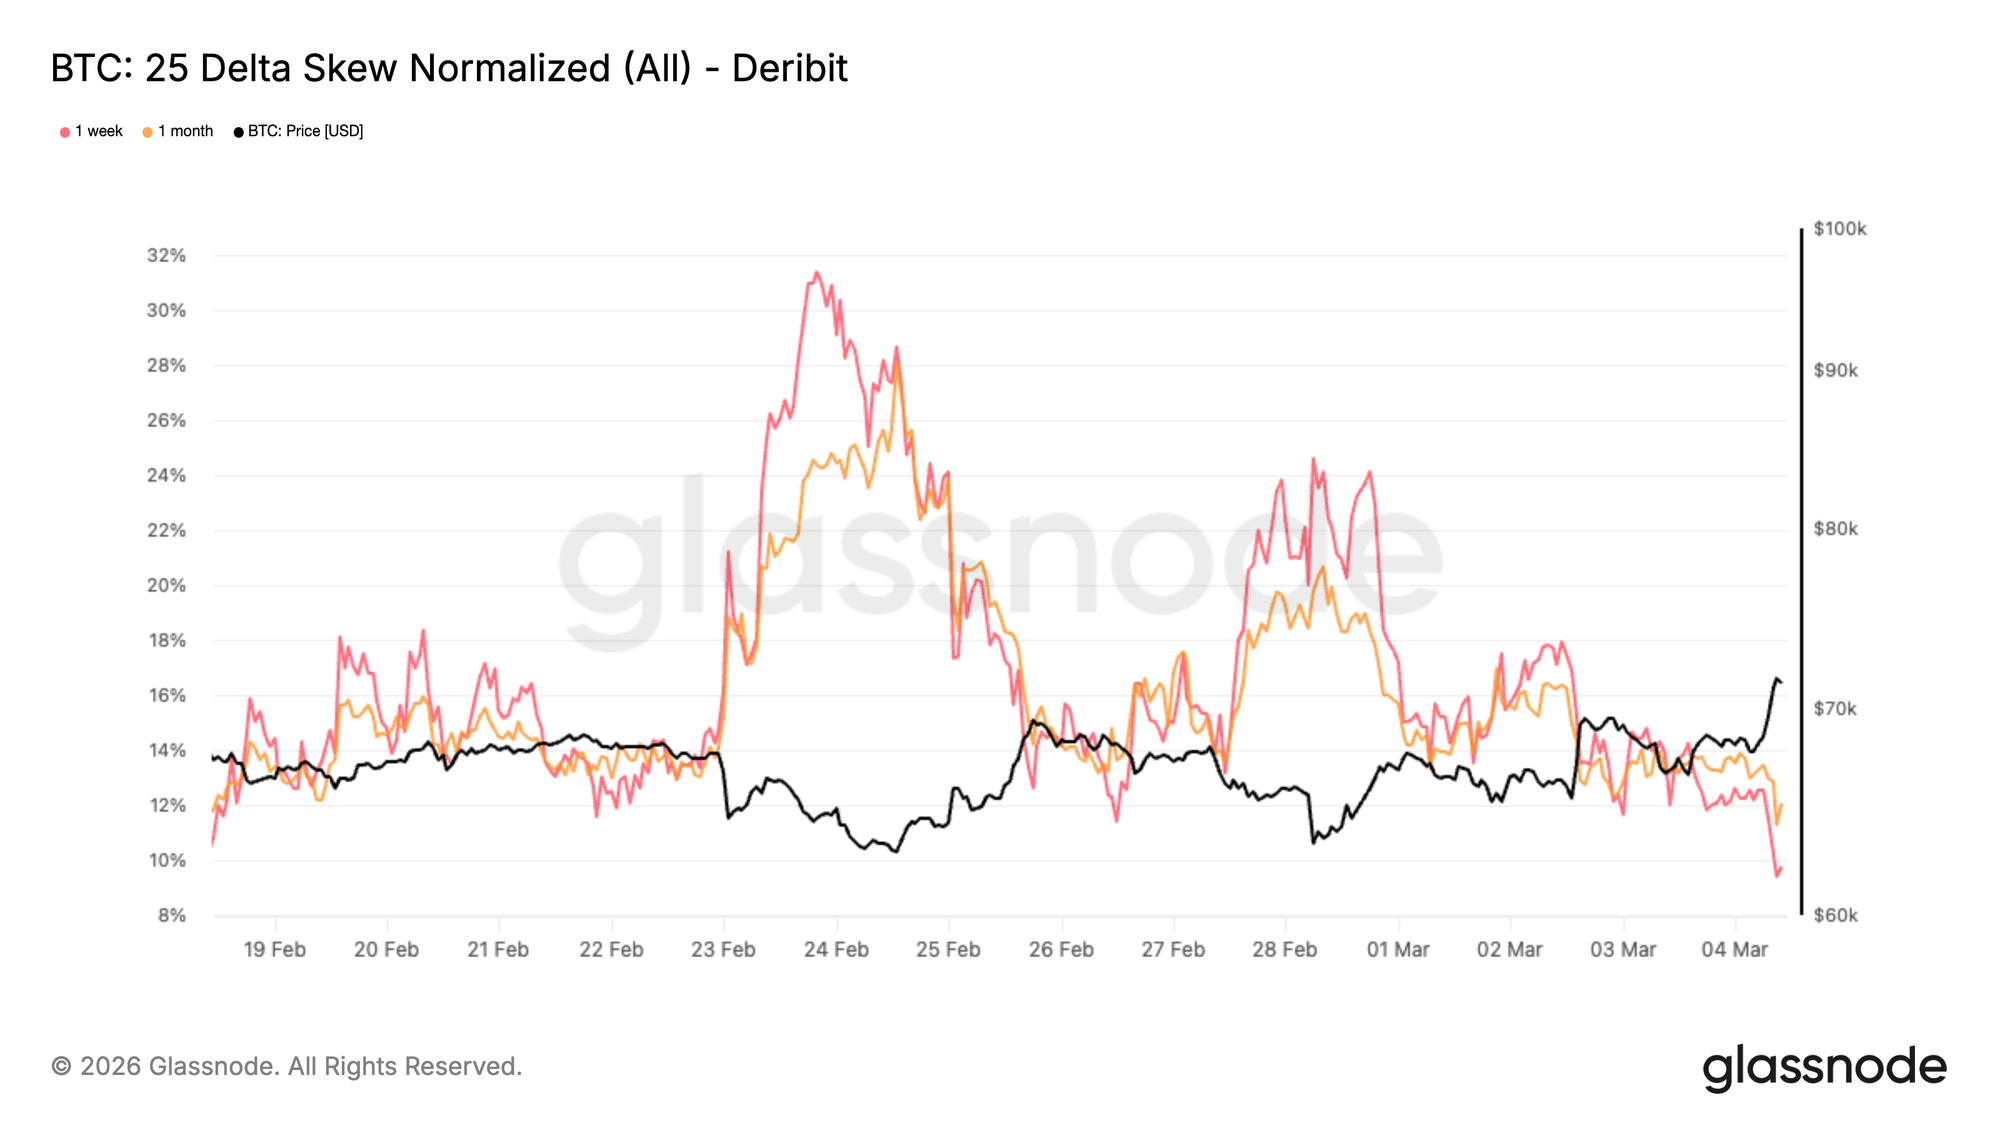
Skew has compressed materially from the extreme levels observed during the February sell-off. Over the past two weeks, as the chart shows, each move lower in BTC price has triggered a progressively milder reaction in the options market. Traders have been far less aggressive in bidding for downside protection, gradually pulling the skew lower. During the peak of the sell-off, put demand surged and pushed skew deep into put territory as traders rushed to hedge against further downside. That urgency has clearly eased.

Rather than a full normalization, what we are seeing is a repricing of risk: skew has moved from the mid-20s to the low-10s, still reflecting demand for protection but at far less stressed levels. This shift suggests that the immediate need for downside hedging is fading. Some protective positioning is being unwound, while interest in upside exposure is slowly reappearing.

Historically, this type of skew compression tends to occur when markets move out of stress phases and begin transitioning into more balanced positioning environments.
Live Chart

Options Flow Rotates Toward Upside Calls

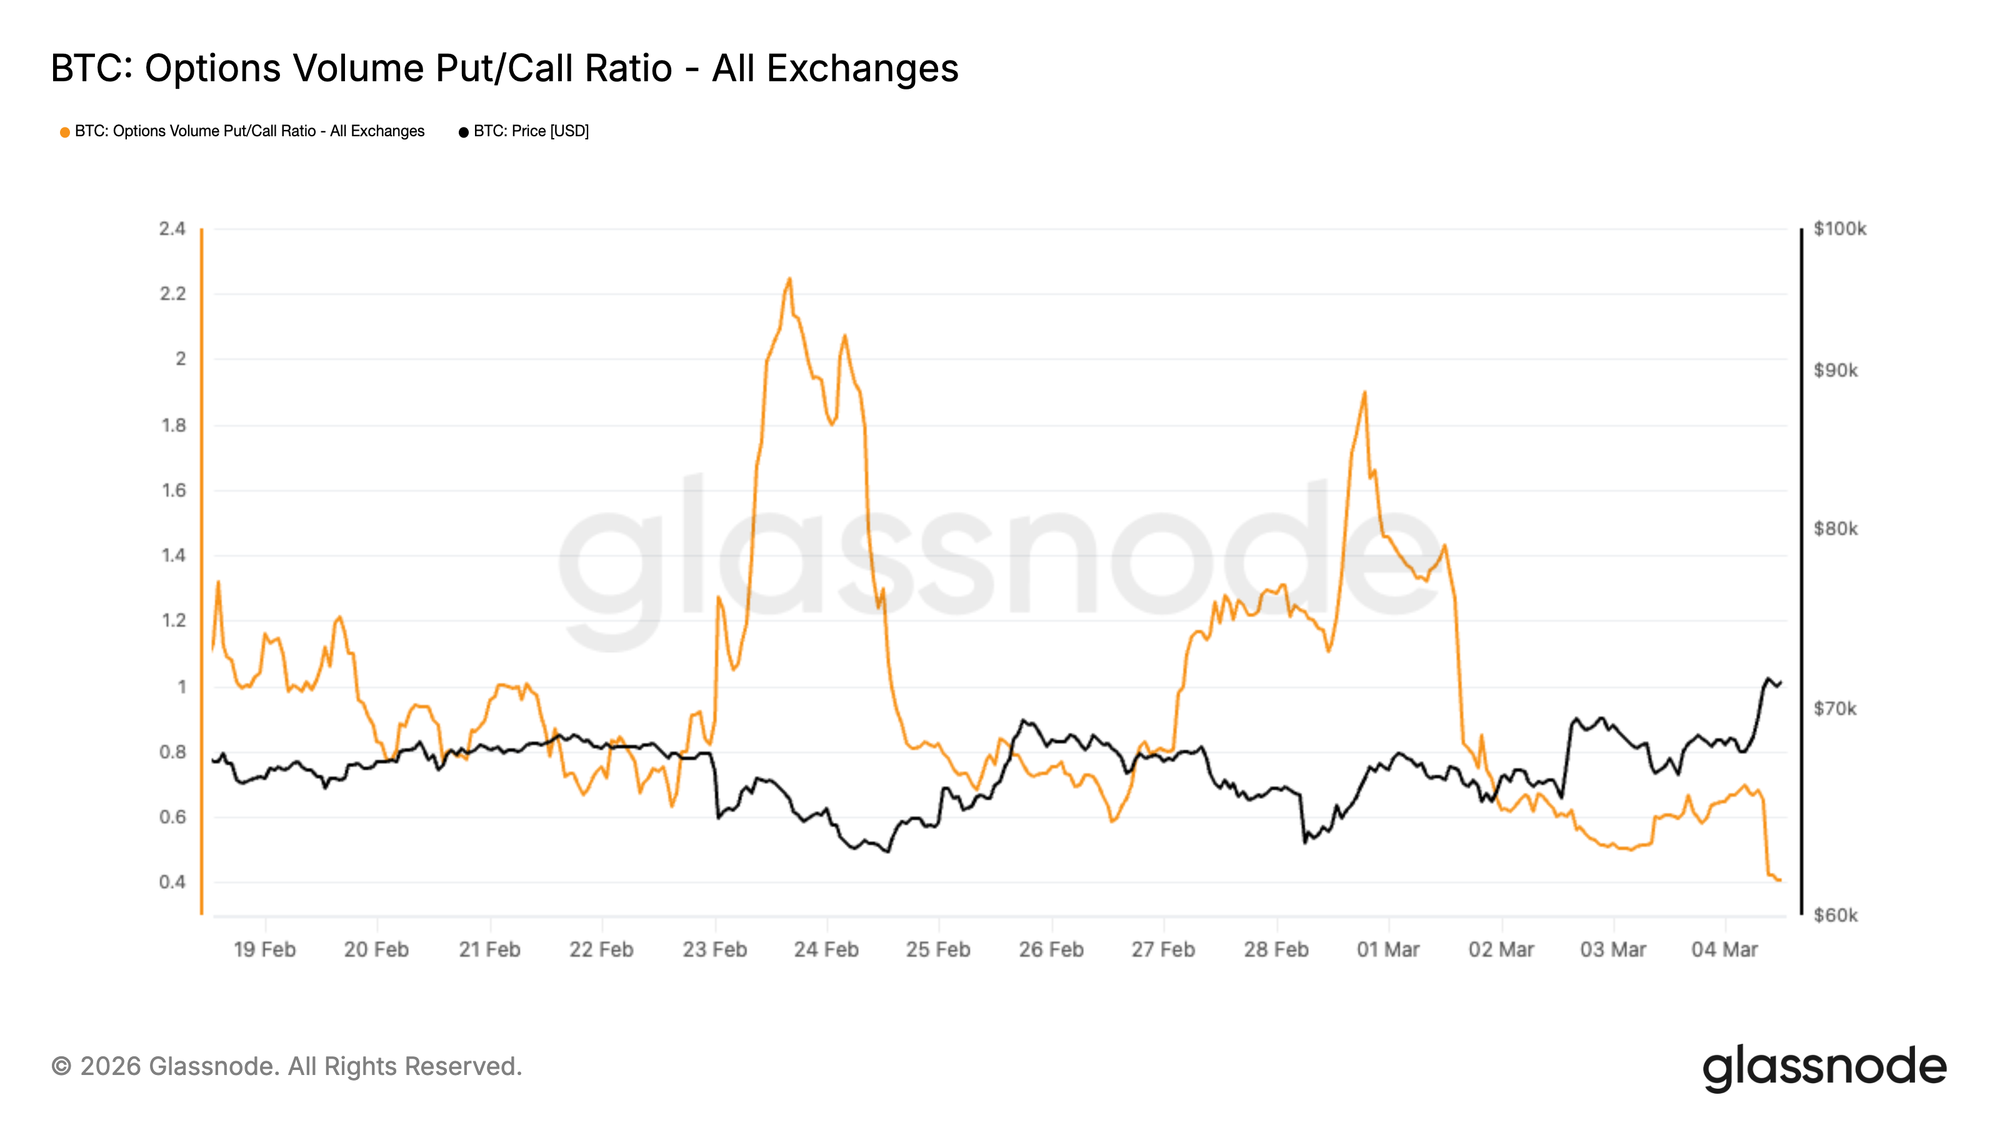
The Put/Call volume ratio measures the relative trading activity between puts and calls. When the ratio declines, it indicates that call activity is increasing relative to puts.

As implied volatility compresses, put holders face increasing theta decay and mark-to-market pressure. With downside momentum weakening, these positions become more costly to carry, prompting traders to buy back their hedges. This dynamic can create incremental spot demand as protective positions are unwound.

This environment has incentivized traders to position for a tactical upside move, a shift that is visible in the Put/Call volume ratio. Since February 28th, the ratio has moved from 1.89 to 0.4, marking a significant reversal in options flows and highlighting the growing willingness of the market to position for upside.

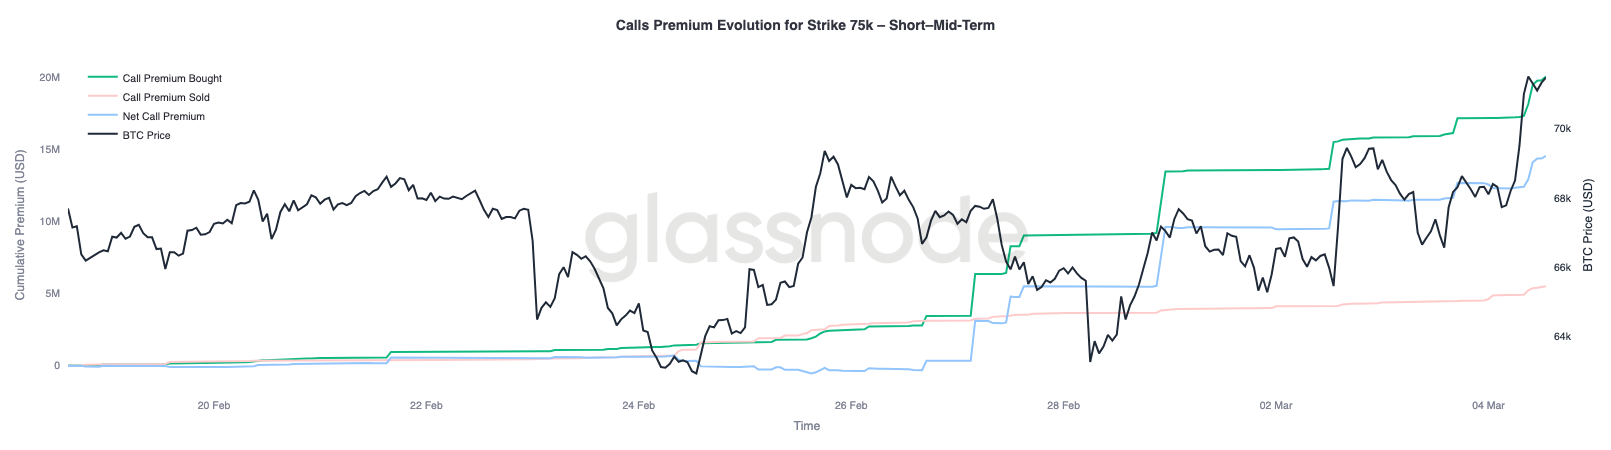
This shift is also reflected in the increasing interest around the $75,000 strike.

The combination of declining volatility and rising call activity suggests a market gradually transitioning away from defensive hedging toward more opportunistic upside positioning.
Live Chart

$75K Emerges as the Key Gamma Magnet

The rotation toward call activity is also visible in the growing interest around the $75,000 strike, which has become the most significant negative gamma level for dealers.

The $75,000 strike currently hosts a substantial concentration of negative gamma, estimated at around $2.3 billion across expiries, with approximately $1.8 billion concentrated in the March 27th expiry.

Negative gamma environments can amplify price movements as dealer hedging flows reinforce the prevailing trend. When price approaches these zones, hedging activity can pull the market toward the strike, creating a magnet effect. Over the past week, this magnet has effectively shifted from the $60K to $65K area up toward the $75K strike.

For now, $75K stands out as the key level where positioning and liquidity could converge in the coming sessions.

Looking at the premium dynamics for the $75K calls across the next three monthly expiries, roughly $14.5 million in net call premium has been traded. This represents the difference between premium bought and premium sold.
Notably, nearly two thirds of this net premium has been accumulated over the past week, helping fuel the current rebound.
Live Chart

Conclusion

Bitcoin remains locked in a tenuous consolidation below the $70k threshold, with several indicators suggesting that buy-side momentum has materially weakened. Realized profit has contracted sharply, highlighting reduced willingness among market participants to transact at elevated prices, while the decline in the Percent Supply in Profit places the current regime within a historical context often associated with the early stages of bear market conditions. At the same time, the cost basis of short-term holders near $70k is emerging as a key behavioural ceiling, likely acting as a distribution zone should price attempt a near-term recovery.

Beneath the surface, however, some signs of stabilization are beginning to appear. Spot selling pressure is moderating at the margin, ETF outflows are easing with early inflows returning, and derivatives leverage continues to be flushed from the system. In options markets, volatility and skew are normalizing as panic hedging fades and positioning rotates toward upside exposure. With the $75k strike emerging as a major gamma magnet, the market appears to be transitioning from stress-driven selling toward a more balanced positioning regime. Whether this evolves into a sustainable recovery will ultimately depend on the return of stronger spot demand to absorb overhead supply.


Disclaimer: This report does not provide any investment advice. All data is provided for informational and educational purposes only. No investment decision shall be based on the information provided here, and you are solely responsible for your own investment decisions.

Exchange balances presented are derived from Glassnode’s comprehensive database of address labels, which are amassed through both officially published exchange information and proprietary clustering algorithms. While we strive to ensure the utmost accuracy in representing exchange balances, it is important to note that these figures might not always encapsulate the entirety of an exchange’s reserves, particularly when exchanges refrain from disclosing their official addresses. We urge users to exercise caution and discretion when utilizing these metrics. Glassnode shall not be held responsible for any discrepancies or potential inaccuracies.


Трендові криптовалюти

Пов'язані питання

QWhat key resistance level has Bitcoin repeatedly failed to close above since early February, and what does this indicate about current market momentum?

ABitcoin has repeatedly failed to post a weekly close above $70k since early February, establishing it as a significant near-term resistance level. This, combined with a sharp 63% contraction in the 30-day SMA of Realized Profit, indicates that upside momentum has stalled, leaving the price in a state of directionless consolidation.

QAccording to the 'Percent of Supply in Profit' metric, what does the current reading of approximately 57% historically suggest about the market regime?

AThe 'Percent of Supply in Profit' metric breaking below its -1 standard deviation threshold near 60% and sitting at approximately 57% suggests that the present consolidation may be less a springboard for recovery and more a continuation of the prevailing adverse market regime. Historically, readings at this level have coincided with the early stages of deep bear markets, such as in May 2022 and November 2018.

QWhat is the significance of the Short-Term Holder (1W-1M) Cost Basis being near $70k, and what zone does it create?

AThe cost basis of Short-Term Holders (coins aged between one week and one month) near $70k is significant because it acts as a key behavioral anchor. The ±2% zone surrounding this level (roughly $68.5k to $71.5k) represents a major potential resistance and distribution zone for any near-term price recovery, as these recent buyers are incentivized to exit their positions or lock in thin profits as they approach breakeven.

QWhat recent shifts in ETF flows and options market activity suggest a potential stabilization or change in sentiment?

ARecent shifts include ETF outflows easing with the first signs of renewed inflows appearing, suggesting institutional selling pressure may be moderating. In options markets, the Put/Call volume ratio has dramatically reversed from 1.89 to 0.4, indicating a significant rotation from defensive put buying to opportunistic call buying, and the $75k strike has emerged as a key gamma magnet, reflecting growing upside positioning.

QHow has implied volatility and skew changed, and what does this signal about the current market phase?

AImplied volatility has compressed materially, indicating traders are no longer aggressively pricing tail risk and that the market is moving away from crisis pricing. Skew has normalized from extreme put-heavy levels (mid-20s) to the low-10s, reflecting a fading immediate need for downside hedging. This compression suggests the market is transitioning from a stress phase into a more balanced consolidation phase where positioning, rather than panic, drives price action.

Пов'язані матеріали

STAR 50 Soars 10.73%, Why Did A-Shares Stage a "V-Shaped Reversal"?

After a prolonged decline, the Chinese A-share market staged a strong rally on July 21. The STAR 50 index surged 10.73%, its largest single-day gain in nearly a year, leading a broad-based "V-shaped" reversal. The Shanghai Composite Index rose 1.79%, the Shenzhen Component Index gained 4.81%, and the ChiNext Index jumped 7.05%. Total market turnover reached 2.97 trillion yuan, an increase of 256.1 billion yuan from the previous session, with over 3,100 stocks advancing. The semiconductor sector spearheaded the rebound, with related ETFs posting significant gains. Analysts attribute the surge to three converging factors. First, coordinated capital inflows from "national team" institutions, insurance funds, listed company buybacks, and fund house self-purchases have bolstered market liquidity and confidence. Second, supportive policy signals, including commitments from regulators to ensure stable market operations, provided a favorable backdrop. Third, a stabilization and recovery in overseas markets, notably South Korea, created a positive external environment. Institutions suggest the most severe panic selling phase for the tech sector has likely passed, following a significant digestion of crowded positions and leveraged funds. While short-term volatility may persist, the medium to long-term outlook remains underpinned by enduring trends like AI computing demand expansion and semiconductor localization. The market's focus now shifts to the sustainability of supportive fund flows, earnings reports, and upcoming catalysts from the global AI industry chain.

marsbit30 хв тому

STAR 50 Soars 10.73%, Why Did A-Shares Stage a "V-Shaped Reversal"?

marsbit30 хв тому

U.S. Tech Momentum Stocks Post Largest Single-Day Gain Ever, But Is the Plunge Over?

US tech momentum stocks staged a sharp rebound on Tuesday (July 21st). Morgan Stanley's TMT Momentum Factor surged over 12%, marking its largest single-day gain on record, exceeding even peaks from the 2000 dot-com bubble. Key momentum indices from Goldman Sachs also posted their strongest daily performances in years. The rally was led by semiconductors, with the Philadelphia Semiconductor Index jumping 4.6%. This rebound followed three consecutive down days and a cumulative 33% plunge in momentum stocks, one of the steepest drawdowns since the dot-com era. Analysts attribute the surge largely to a short squeeze. Heavy selling had pushed high-beta momentum stocks into deeply oversold territory, forcing many short sellers, particularly in Asia, to cover their positions, creating a self-reinforcing buying spiral. However, the rebound's internals appear weak. Trading volume was notably low, and advancing stocks still lagged decliners on the S&P 500, indicating a narrow, concentrated rally rather than broad market participation. Diverging views emerge on the outlook. BTIG warns the bounce has hit key resistance and recommends selling into strength, citing extreme volatility and historical parallels to past market tops. Conversely, Goldman Sachs and UBS believe the momentum unwind is nearing its end, suggesting it may be time to gradually add exposure, as positioning has been significantly reduced. They caution, however, that high volatility warrants a measured approach, potentially using defined-risk strategies. The upcoming earnings season, particularly reports from major tech firms like Alphabet, is seen as a critical test for the rally's sustainability. Simultaneously, bond markets flashed a warning, with yields rising partly due to spiking oil prices. Analysts note that if long-term Treasury yields break decisively higher, it could pose a significant headwind for equities, especially growth stocks.

marsbit38 хв тому

U.S. Tech Momentum Stocks Post Largest Single-Day Gain Ever, But Is the Plunge Over?

marsbit38 хв тому

U.S. Tech Momentum Stocks Record Largest Single-Day Gain Ever, but Has the Rout Ended?

U.S. tech momentum stocks staged a dramatic rebound on Tuesday, July 21st. Key momentum indices like the Morgan Stanley TMT Momentum Factor and Goldman Sachs' High Beta Momentum Long Index posted historic or near-historic single-day gains, fueled largely by semiconductor stocks. This sharp rally followed a severe three-day sell-off that saw momentum stocks plunge 33%, marking one of the steepest pullbacks since the dot-com bubble. Analysts attribute the bounce primarily to a short squeeze, as forced covering from over-leveraged traders, particularly in Asia, created a buying spiral. However, the rally's health is questioned due to weak market breadth—overall trading volume was low, and decliners outnumbered advancers in the S&P 500 despite the index's gain—suggesting a narrow, concentrated surge rather than broad recovery. Opinions on the sustainability diverge. BTIG strategists warn the rebound has hit key resistance levels, citing extreme volatility and historic stock dispersion as signs of an ongoing broader correction, and recommend selling into strength. Conversely, Goldman Sachs and UBS view the aggressive momentum unwinding as nearing its end, noting reduced positioning and a lack of new fundamental catalysts. They suggest the sell-off presents a selective opportunity to add exposure, albeit cautiously and gradually using defined-risk strategies. The immediate trajectory hinges on the ongoing earnings season, with market focus on Alphabet's capital expenditure guidance for AI investment clarity. Meanwhile, bond markets present a risk, with rising Treasury yields—potentially heading toward 5.5%—and widening credit spreads for mega-cap tech companies posing a threat to equity valuations. The combination of technical factors, earnings results, and macro conditions leaves the durability of the rebound in doubt.

链捕手40 хв тому

U.S. Tech Momentum Stocks Record Largest Single-Day Gain Ever, but Has the Rout Ended?

链捕手40 хв тому

Long-Divided Must Unite, Long-United Must Divide: When L1 Becomes Its Own Rollup, What Is Ethereum's Endgame?

"The Inevitable Cycle: When L1 Becomes Its Own Rollup – What is Ethereum's Endgame?" For years, the Ethereum community grappled with concerns that L2s were fragmenting the ecosystem and eroding L1's value. While L2s provided cheaper execution, they also splintered liquidity and the unified user experience of a single chain. This has prompted a fundamental reassessment of the relationship between L1 and L2. Ethereum's roadmap is evolving. The "Scale" initiative merges L1 and L2 expansion into a holistic framework. L1 itself is advancing with higher gas limits, statelessness, and zkEVM verification, no longer content to be just a low-throughput settlement layer. Consequently, the primary value proposition of L2s is shifting from merely providing cheap blockspace to offering L1 cannot easily provide: application-specific optimizations, privacy features, and flexible governance models. L2s are becoming a spectrum of execution environments with varying degrees of security inheritance from Ethereum. A critical challenge in this multi-chain future is interoperability. The vision is to make Ethereum "feel like one chain again." This relies on advancements in native account abstraction (like EIP-7702) and intent-based architectures (Open Intents Framework), where users declare desired outcomes, and solvers handle the complex cross-chain execution. Furthermore, shortening Ethereum's finality time from minutes to seconds is crucial, as it underpins trust between chains for bridges, stablecoins, and cross-chain applications. Perhaps the most provocative idea is that Ethereum L1 itself could become a form of "its own Rollup." As zkEVM and proof systems mature, high-performance nodes could execute transactions and generate validity proofs. Regular validators would then verify these proofs instead of re-executing all transactions. This blurs the traditional L1/L2 hierarchy, making "Rollup" more of a general execution-verification architecture. Native Rollup aims to integrate L2 validation more directly into the Ethereum protocol, allowing L2s to inherit L1's security more fully and move away from reliance on security councils. In the end, L2s are not destined to replace L1 or be made obsolete by it. The likely future is a unified system where diverse execution environments—each optimized for specific use cases like DeFi, gaming, or privacy—coexist. They will share a common foundation of security, liquidity, and verifiable state, seamlessly connected to restore a cohesive user experience. The next phase for Ethereum is not just about scaling through separation, but about intelligently reintegrating what was separated back into a coherent whole.

链捕手56 хв тому

Long-Divided Must Unite, Long-United Must Divide: When L1 Becomes Its Own Rollup, What Is Ethereum's Endgame?

链捕手56 хв тому

Торгівля

Спот

Популярні статті

Що таке BITCOIN

Розуміння HarryPotterObamaSonic10Inu (ERC-20) та його позиції у крипто-просторі Останніми роками ринок криптовалют спостерігав за зростанням популярності мем-коінів, які привертають інтерес не тільки трейдерів, але й тих, хто шукає спілкування та розважальну цінність. Серед цих унікальних токенів є HarryPotterObamaSonic10Inu (ERC-20), інтригуючий проект, що поєднує культурні посилання з тканинами криптовалюти. Ця стаття досліджує ключові аспекти HarryPotterObamaSonic10Inu, вивчаючи його механізми, спільноту та його взаємодію з ширшим крипто-ландшафтом. Що таке HarryPotterObamaSonic10Inu (ERC-20)? Як випливає з його назви, HarryPotterObamaSonic10Inu є мем-коіном, побудованим на блокчейні Ethereum, класифікованим за стандартом ERC-20. На відміну від традиційних криптовалют, які можуть підкреслювати практичну корисність або інвестиційний потенціал, цей токен процвітає завдяки розважальній цінності та силі своєї спільноти. Проект спрямований на створення середовища, де зацікавлені користувачі можуть об'єднуватися, ділитися ідеями та брати участь у заходах, натхненних різноманітними культурними явищами. Однією з примітних особливостей HarryPotterObamaSonic10Inu є нульовий податок на транзакції. Цей привабливий елемент має на меті заохочувати торгівлю та участь у спільноті, позбавлену додаткових витрат, які можуть відлякувати дрібних трейдерів. Загальна пропозиція монет становить один мільярд токенів, що позначає намір підтримувати суттєву циркуляцію в межах спільноти. Творець HarryPotterObamaSonic10Inu (ERC-20) Походження HarryPotterObamaSonic10Inu дещо окутане таємницею; деталі про творця залишаються невідомими. Розвиток цього токена позбавлений впізнаваної команди або чіткої стратегії, що не є рідкістю в секторі мем-коінів. Натомість проект виник органічно, а його розвиток значною мірою залежить від ентузіазму та участі його спільноти. Інвестори HarryPotterObamaSonic10Inu (ERC-20) Щодо зовнішніх інвестицій та підтримки, HarryPotterObamaSonic10Inu також залишається невизначеним. Токен не зазначає жодних відомих інвестиційних фондів або значної організаційної підтримки. Натомість життєва сила проекту полягає в його базовій спільноті, яка інформує про його зростання та стійкість через колективні дії та залученість у крипто-просторі. Як працює HarryPotterObamaSonic10Inu (ERC-20)? Як мем-коін, HarryPotterObamaSonic10Inu функціонує передусім поза традиційними рамками, що часто регулюють вартість активів. Є кілька відмінних аспектів, що визначають, як працює проект: Транзакції без податку: Завдяки відсутності податкових зборів на транзакції, користувачі можуть вільно купувати та продавати токен, не турбуючись про приховані витрати. Залучення спільноти: Проект процвітає завдяки взаємодії спільноти, використовуючи соціальні медіа для створення шуму та сприяння залученню. Обговорення, обмін контентом та залученість є ключовими елементами, що допомагають розширити його охоплення та зміцнити лояльність серед прихильників. Відсутність практичної корисності: Слід зазначити, що HarryPotterObamaSonic10Inu не пропонує конкретної корисності в рамках фінансової екосистеми. Натомість він класифікується як токен, що призначений в основному для розваги та спільнотних активностей. Культурне посилання: Токен кмітливо вплітає елементи популярної культури, щоб привернути інтерес, зв'язуючи з ентузіастами мемів та крипто-стежками. HarryPotterObamaSonic10Inu ілюструє, як мем-коіни функціонують інакше, ніж традиційні криптовалютні проекти, увійшовши на ринок як інноваційні соціальні конструкти, а не утилітарні активи. Хронологія HarryPotterObamaSonic10Inu (ERC-20) Історія HarryPotterObamaSonic10Inu відзначена кількома значними етапами: Створення: Токен виник з вірусного мему, захопивши уяву багатьох крипто-ентузіастів. Конкретні дати створення недоступні, що підкреслює його органічний розвиток. Лістинг на біржах: HarryPotterObamaSonic10Inu з'явився на різних біржах, дозволяючи зручніший доступ і торгівлю спільноти. Ініціативи залучення спільноти: Ведення діяльності, спрямованої на покращення взаємодії спільноти, включаючи конкурси, кампанії в соціальних мережах та створення контенту від фанатів та прихильників. Плани на майбутнє: Дорожня карта проекту включає запуск колекції NFT, мерчандайзинг та електронну комерцію, пов'язану з його культурними темами, що далі залучає спільноту та намагається додати більше вимірів до його екосистеми. Ключові моменти про HarryPotterObamaSonic10Inu (ERC-20) Спільнотний підхід: Проект надає пріоритет колективному внеску та креативності, забезпечуючи, щоб участь користувачів була в центрі його розвитку. Класифікація як мем-коін: Це є його епігенез розважальної криптовалюти, що відрізняється від традиційних інвестиційних інструментів. Жодного прямого відношення до Bitcoin: Незважаючи на схожість у назві, HarryPotterObamaSonic10Inu є відмінним і не має жодного зв’язку з Bitcoin або іншими усталеними криптовалютами. Зосередженість на співпраці: HarryPotterObamaSonic10Inu створено для того, щоб надати простір для співпраці та обміну історіями серед його власників, забезпечуючи шлях для творчості та спільного зв'язку. Перспективи на майбутнє: Амбіція розширитися за межі початкової концепції в NFT та мерчандайз відкриває шлях для проекту потенційно потрапити в більш мейнстрімні сфери цифрової культури. Оскільки мем-коіни продовжують захоплювати уяву спільноти криптовалют, HarryPotterObamaSonic10Inu (ERC-20) вирізняється своїми культурними зв'язками та орієнтованим на спільноту підходом. Хоча він може не відповідати типовій моделі утилітарного токена, його суть полягає в радощах і товариськості, що підтримуються серед його прихильників, підкреслюючи еволюційну природу криптовалют в усе більш цифрову епоху. Оскільки проект продовжує розвиватися, важливо спостерігати за тим, як динаміка спільноти вплине на його траєкторію в постійно змінюваному ландшафті технології блокчейн.

2.2k переглядів усьогоОпубліковано 2024.04.01Оновлено 2024.12.03

Що таке BITCOIN

Як купити BTC

Ласкаво просимо до HTX.com! Ми зробили покупку Bitcoin (BTC) простою та зручною. Дотримуйтесь нашої покрокової інструкції, щоб розпочати свою криптовалютну подорож.Крок 1: Створіть обліковий запис на HTXВикористовуйте свою електронну пошту або номер телефону, щоб зареєструвати обліковий запис на HTX безплатно. Пройдіть безпроблемну реєстрацію й отримайте доступ до всіх функцій.ЗареєструватисьКрок 2: Перейдіть до розділу Купити крипту і виберіть спосіб оплатиКредитна/дебетова картка: використовуйте вашу картку Visa або Mastercard, щоб миттєво купити Bitcoin (BTC).Баланс: використовуйте кошти з балансу вашого рахунку HTX для безперешкодної торгівлі.Треті особи: ми додали популярні способи оплати, такі як Google Pay та Apple Pay, щоб підвищити зручність.P2P: Торгуйте безпосередньо з іншими користувачами на HTX.Позабіржова торгівля (OTC): ми пропонуємо індивідуальні послуги та конкурентні обмінні курси для трейдерів.Крок 3: Зберігайте свої Bitcoin (BTC)Після придбання Bitcoin (BTC) збережіть його у своєму обліковому записі на HTX. Крім того, ви можете відправити його в інше місце за допомогою блокчейн-переказу або використовувати його для торгівлі іншими криптовалютами.Крок 4: Торгівля Bitcoin (BTC)Легко торгуйте Bitcoin (BTC) на спотовому ринку HTX. Просто увійдіть до свого облікового запису, виберіть торгову пару, укладайте угоди та спостерігайте за ними в режимі реального часу. Ми пропонуємо зручний досвід як для початківців, так і для досвідчених трейдерів.

5.0k переглядів усьогоОпубліковано 2024.12.12Оновлено 2026.06.02

Як купити BTC

Що таке $BITCOIN

ЦИФРОВЕ ЗОЛОТО ($BITCOIN): Комплексний аналіз Вступ до ЦИФРОВОГО ЗОЛОТА ($BITCOIN) ЦИФРОВЕ ЗОЛОТО ($BITCOIN) — це проект на основі блокчейну, що працює в мережі Solana, який має на меті поєднати характеристики традиційних дорогоцінних металів з інноваціями децентралізованих технологій. Хоча він має таку ж назву, як і Bitcoin, який часто називають “цифровим золотом” через його сприйняття як засобу збереження вартості, ЦИФРОВЕ ЗОЛОТО є окремим токеном, розробленим для створення унікальної екосистеми в ландшафті Web3. Його мета — позиціонувати себе як життєздатний альтернативний цифровий актив, хоча деталі щодо його застосувань і функціональностей все ще розробляються. Що таке ЦИФРОВЕ ЗОЛОТО ($BITCOIN)? ЦИФРОВЕ ЗОЛОТО ($BITCOIN) — це токен криптовалюти, спеціально розроблений для використання в блокчейні Solana. На відміну від Bitcoin, який виконує широко визнану роль зберігання вартості, цей токен, здається, зосереджується на більш широких застосуваннях і характеристиках. Помітні аспекти включають: Інфраструктура блокчейну: Токен побудований на блокчейні Solana, відомому своєю здатністю обробляти швидкі та низьковартісні транзакції. Динаміка постачання: ЦИФРОВЕ ЗОЛОТО має максимальне постачання, обмежене 100 квадрильйонами токенів (100P $BITCOIN), хоча деталі щодо його обігового постачання наразі не розголошуються. Утиліта: Хоча точні функціональності не викладені, є вказівки на те, що токен може бути використаний для різних застосувань, потенційно пов'язаних з децентралізованими додатками (dApps) або стратегіями токенізації активів. Хто є творцем ЦИФРОВОГО ЗОЛОТА ($BITCOIN)? На даний момент особа творців і команди розробників, що стоять за ЦИФРОВИМ ЗОЛОТОМ ($BITCOIN), залишається невідомою. Ця ситуація є типовою для багатьох інноваційних проектів у сфері блокчейну, особливо тих, що пов'язані з децентралізованими фінансами та феноменом мем-коінів. Хоча така анонімність може сприяти культурі, орієнтованій на спільноту, вона посилює занепокоєння щодо управління та підзвітності. Хто є інвесторами ЦИФРОВОГО ЗОЛОТА ($BITCOIN)? Доступна інформація вказує на те, що ЦИФРОВЕ ЗОЛОТО ($BITCOIN) не має жодних відомих інституційних спонсорів або помітних венчурних капіталовкладень. Проект, здається, працює за моделлю “рівний до рівного”, зосереджуючись на підтримці та прийнятті спільноти, а не на традиційних шляхах фінансування. Його активність і ліквідність переважно розташовані на децентралізованих біржах (DEX), таких як PumpSwap, а не на встановлених централізованих торгових платформах, що ще більше підкреслює його підхід знизу вгору. Як працює ЦИФРОВЕ ЗОЛОТО ($BITCOIN) Операційні механізми ЦИФРОВОГО ЗОЛОТА ($BITCOIN) можна детальніше розглянути на основі його дизайну блокчейну та характеристик мережі: Механізм консенсусу: Використовуючи унікальний proof-of-history (PoH) Solana в поєднанні з моделлю proof-of-stake (PoS), проект забезпечує ефективну валідацію транзакцій, що сприяє високій продуктивності мережі. Токеноміка: Хоча конкретні дефляційні механізми не були детально описані, велике максимальне постачання токенів вказує на те, що воно може задовольняти мікротранзакції або нішеві випадки використання, які ще потрібно визначити. Інтероперабельність: Існує потенціал для інтеграції з більш широкою екосистемою Solana, включаючи різні платформи децентралізованих фінансів (DeFi). Однак деталі щодо конкретних інтеграцій залишаються невизначеними. Хронологія ключових подій Ось хронологія, яка підкреслює значні віхи, пов'язані з ЦИФРОВИМ ЗОЛОТОМ ($BITCOIN): 2023: Початкове розгортання токена відбувається на блокчейні Solana, позначене його адресою контракту. 2024: ЦИФРОВЕ ЗОЛОТО набуває видимості, оскільки стає доступним для торгівлі на децентралізованих біржах, таких як PumpSwap, що дозволяє користувачам торгувати ним проти SOL. 2025: Проект спостерігає спорадичну торгову активність і потенційний інтерес до ініціатив, очолюваних спільнотою, хоча на даний момент не зафіксовано жодних значних партнерств або технічних досягнень. Критичний аналіз Сильні сторони Масштабованість: Основна інфраструктура Solana підтримує високі обсяги транзакцій, що може підвищити утиліту $BITCOIN у різних сценаріях транзакцій. Доступність: Потенційно низька торгова ціна за токен може привабити роздрібних інвесторів, сприяючи більш широкій участі завдяки можливостям дробового володіння. Ризики Відсутність прозорості: Відсутність публічно відомих спонсорів, розробників або процесу аудиту може викликати скептицизм щодо стійкості та надійності проекту. Волатильність ринку: Торгова активність сильно залежить від спекулятивної поведінки, що може призвести до значної волатильності цін і невизначеності для інвесторів. Висновок ЦИФРОВЕ ЗОЛОТО ($BITCOIN) постає як цікавій, але неоднозначний проект у швидко розвиваючійся екосистемі Solana. Хоча він намагається використати наратив “цифрового золота”, його відхід від встановленої ролі Bitcoin як засобу збереження вартості підкреслює необхідність чіткішого розмежування його передбачуваної утиліти та структури управління. Майбутнє прийняття та адаптація, ймовірно, залежатиме від вирішення поточної непрозорості та більш чіткого визначення його операційних та економічних стратегій. Примітка: Цей звіт охоплює синтезовану інформацію, доступну станом на жовтень 2023 року, і можуть відбутися події, що виходять за межі дослідницького періоду.

159 переглядів усьогоОпубліковано 2025.05.13Оновлено 2025.05.13

Що таке $BITCOIN

Обговорення

Ласкаво просимо до спільноти HTX. Тут ви можете бути в курсі останніх подій розвитку платформи та отримати доступ до професійної ринкової інформації. Нижче представлені думки користувачів щодо ціни BTC (BTC).

活动图片