Unlocking the 'Golden Key' in Prediction Markets Through 27.73 Million Transaction Data: 690 K-Line Strategies Struggle to Profit

marsbitОпубліковано о 2026-02-20Востаннє оновлено о 2026-02-20

Анотація

The article investigates whether a profitable "golden key" strategy exists in prediction markets, using an analysis of 27.73 million transactions over 3,082 fifteen-minute BTC prediction markets. The study debunks several common approaches: Technical analysis based solely on price action, tested across 690 combinations of entry/exit points, stop-loss, and take-profit levels, yielded no positive expected value. Even high-win-rate strategies, like buying at 90% and selling at 99%, resulted in negative expectations due to poor risk-reward ratios. Similarly, arbitrage strategies aiming to profit from YES+NO prices below 1 were also unprofitable after accounting for real-world constraints. The research identifies two potentially viable strategies: 1. **Momentum-based trading**: A brief ~30-second window exists after sharp BTC price moves (>$150-$200) where prediction market token prices lag, allowing manual traders to capitalize on this inefficiency before algorithms adjust. 2. **Fair value model**: A model calculating a token's theoretical win probability based on BTC's volatility and time to expiry revealed that markets are inefficient. Profitable opportunities arise only when tokens trade at a significant discount (>10 cents) to their fair value. Buying at a premium, even with high win probability, leads to negative expected returns. The conclusion advises traders to abandon pure price-based technical analysis, focus on the underlying asset (BTC), respect probability valu...

Author: Frank, PANews

How difficult is it to find a profitable "golden key" in prediction markets?

On social media, you often see many people claiming to have discovered a secret to smart money's profitability, but in reality, they provide no substantive information. What people can see is only the growing profit curve of these funds, not the underlying logic.

So, how can one build a personalized trading strategy suitable for prediction markets?

PANews took the BTC 15-minute prediction market as an example, analyzing nearly 27.73 million transactions and 3,082 window periods over the past month, arriving at some conclusions that may defy conventional wisdom. In a previous article, we already conducted a macro-level analysis of this market. This time, we will delve deeper to find that potentially existing "golden key."

Shattered Illusion: The Complete Failure of K-Line Technical Analysis

Have you ever considered a strategy that treats prediction markets like stocks or cryptocurrencies, analyzing entry and exit points purely based on price movements, combined with position management, stop-loss, and take-profit elements, to create a trading strategy entirely detached from BTC's行情, focusing solely on the price changes in prediction markets?

In traditional crypto markets, this approach is known as the "technical analysis" school. In theory, this should work equally well in prediction markets. Therefore, PANews also conducted simulations in this direction and developed a custom prediction market backtesting system. This system can input factors such as entry points, take-profit points, stop-loss points, entry timing, and exclusion of干扰 prices to calculate the actual profit-loss ratio, win rate, and other elements of the strategy from over 3,000 markets in the past 30 days.

Initially, with incomplete data (Polymarket's historical data only provides 3,500 entries per market), the backtest results could easily find profitable answers. For example, entering at 60%, selling at 90%, stopping loss at 40%, and setting a certain window period for trading.

However, the actual test results were vastly different. Under real execution, the profit curve of this strategy slowly declined like a钝刀割肉 (dull knife cutting flesh). So, we tried to补全 the data as much as possible. After trying various methods, we finally obtained the complete price information data for all markets. This time, the results finally began to align with reality.

In real data testing, PANews simulated 690 combinations of factors including price, take-profit/stop-loss, entry timing, interference exclusion, and slippage. The final result was that not a single strategy could achieve a positive expected return.
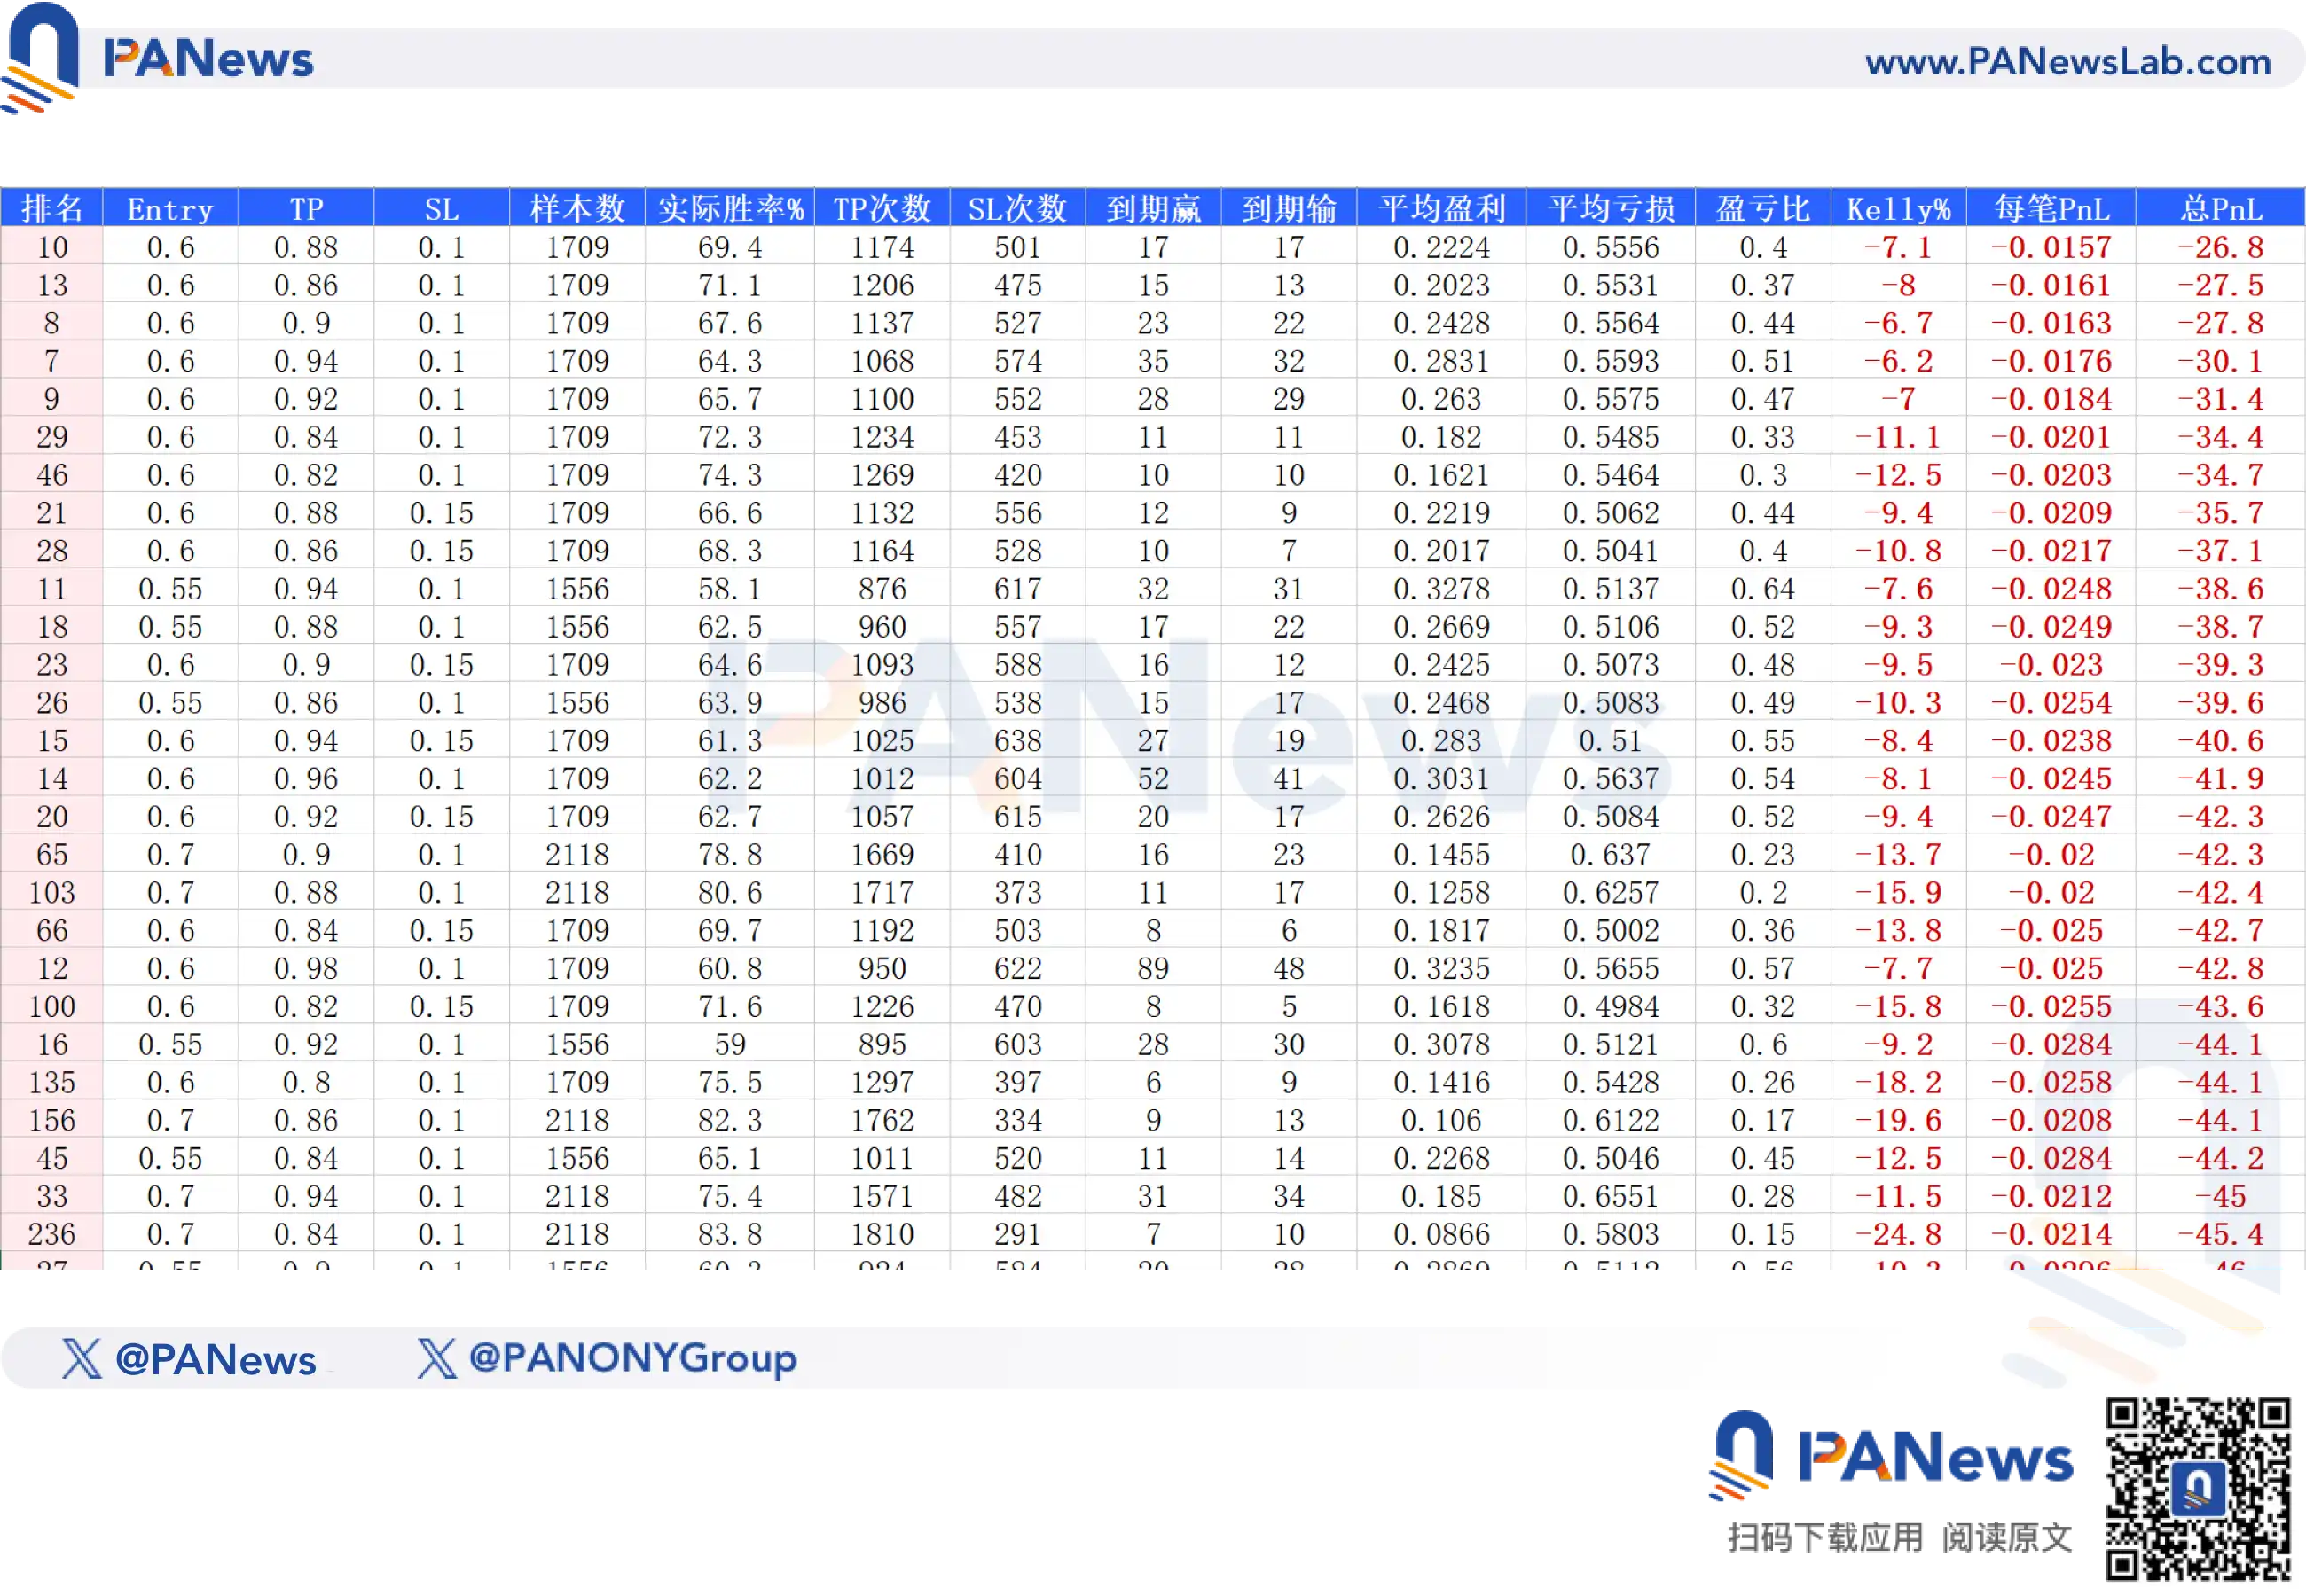
Even the highest possible return had an expected value of -26.8. This result indicates that in prediction markets, any purely mathematical prediction that excludes the event itself has almost no possibility of profitability.

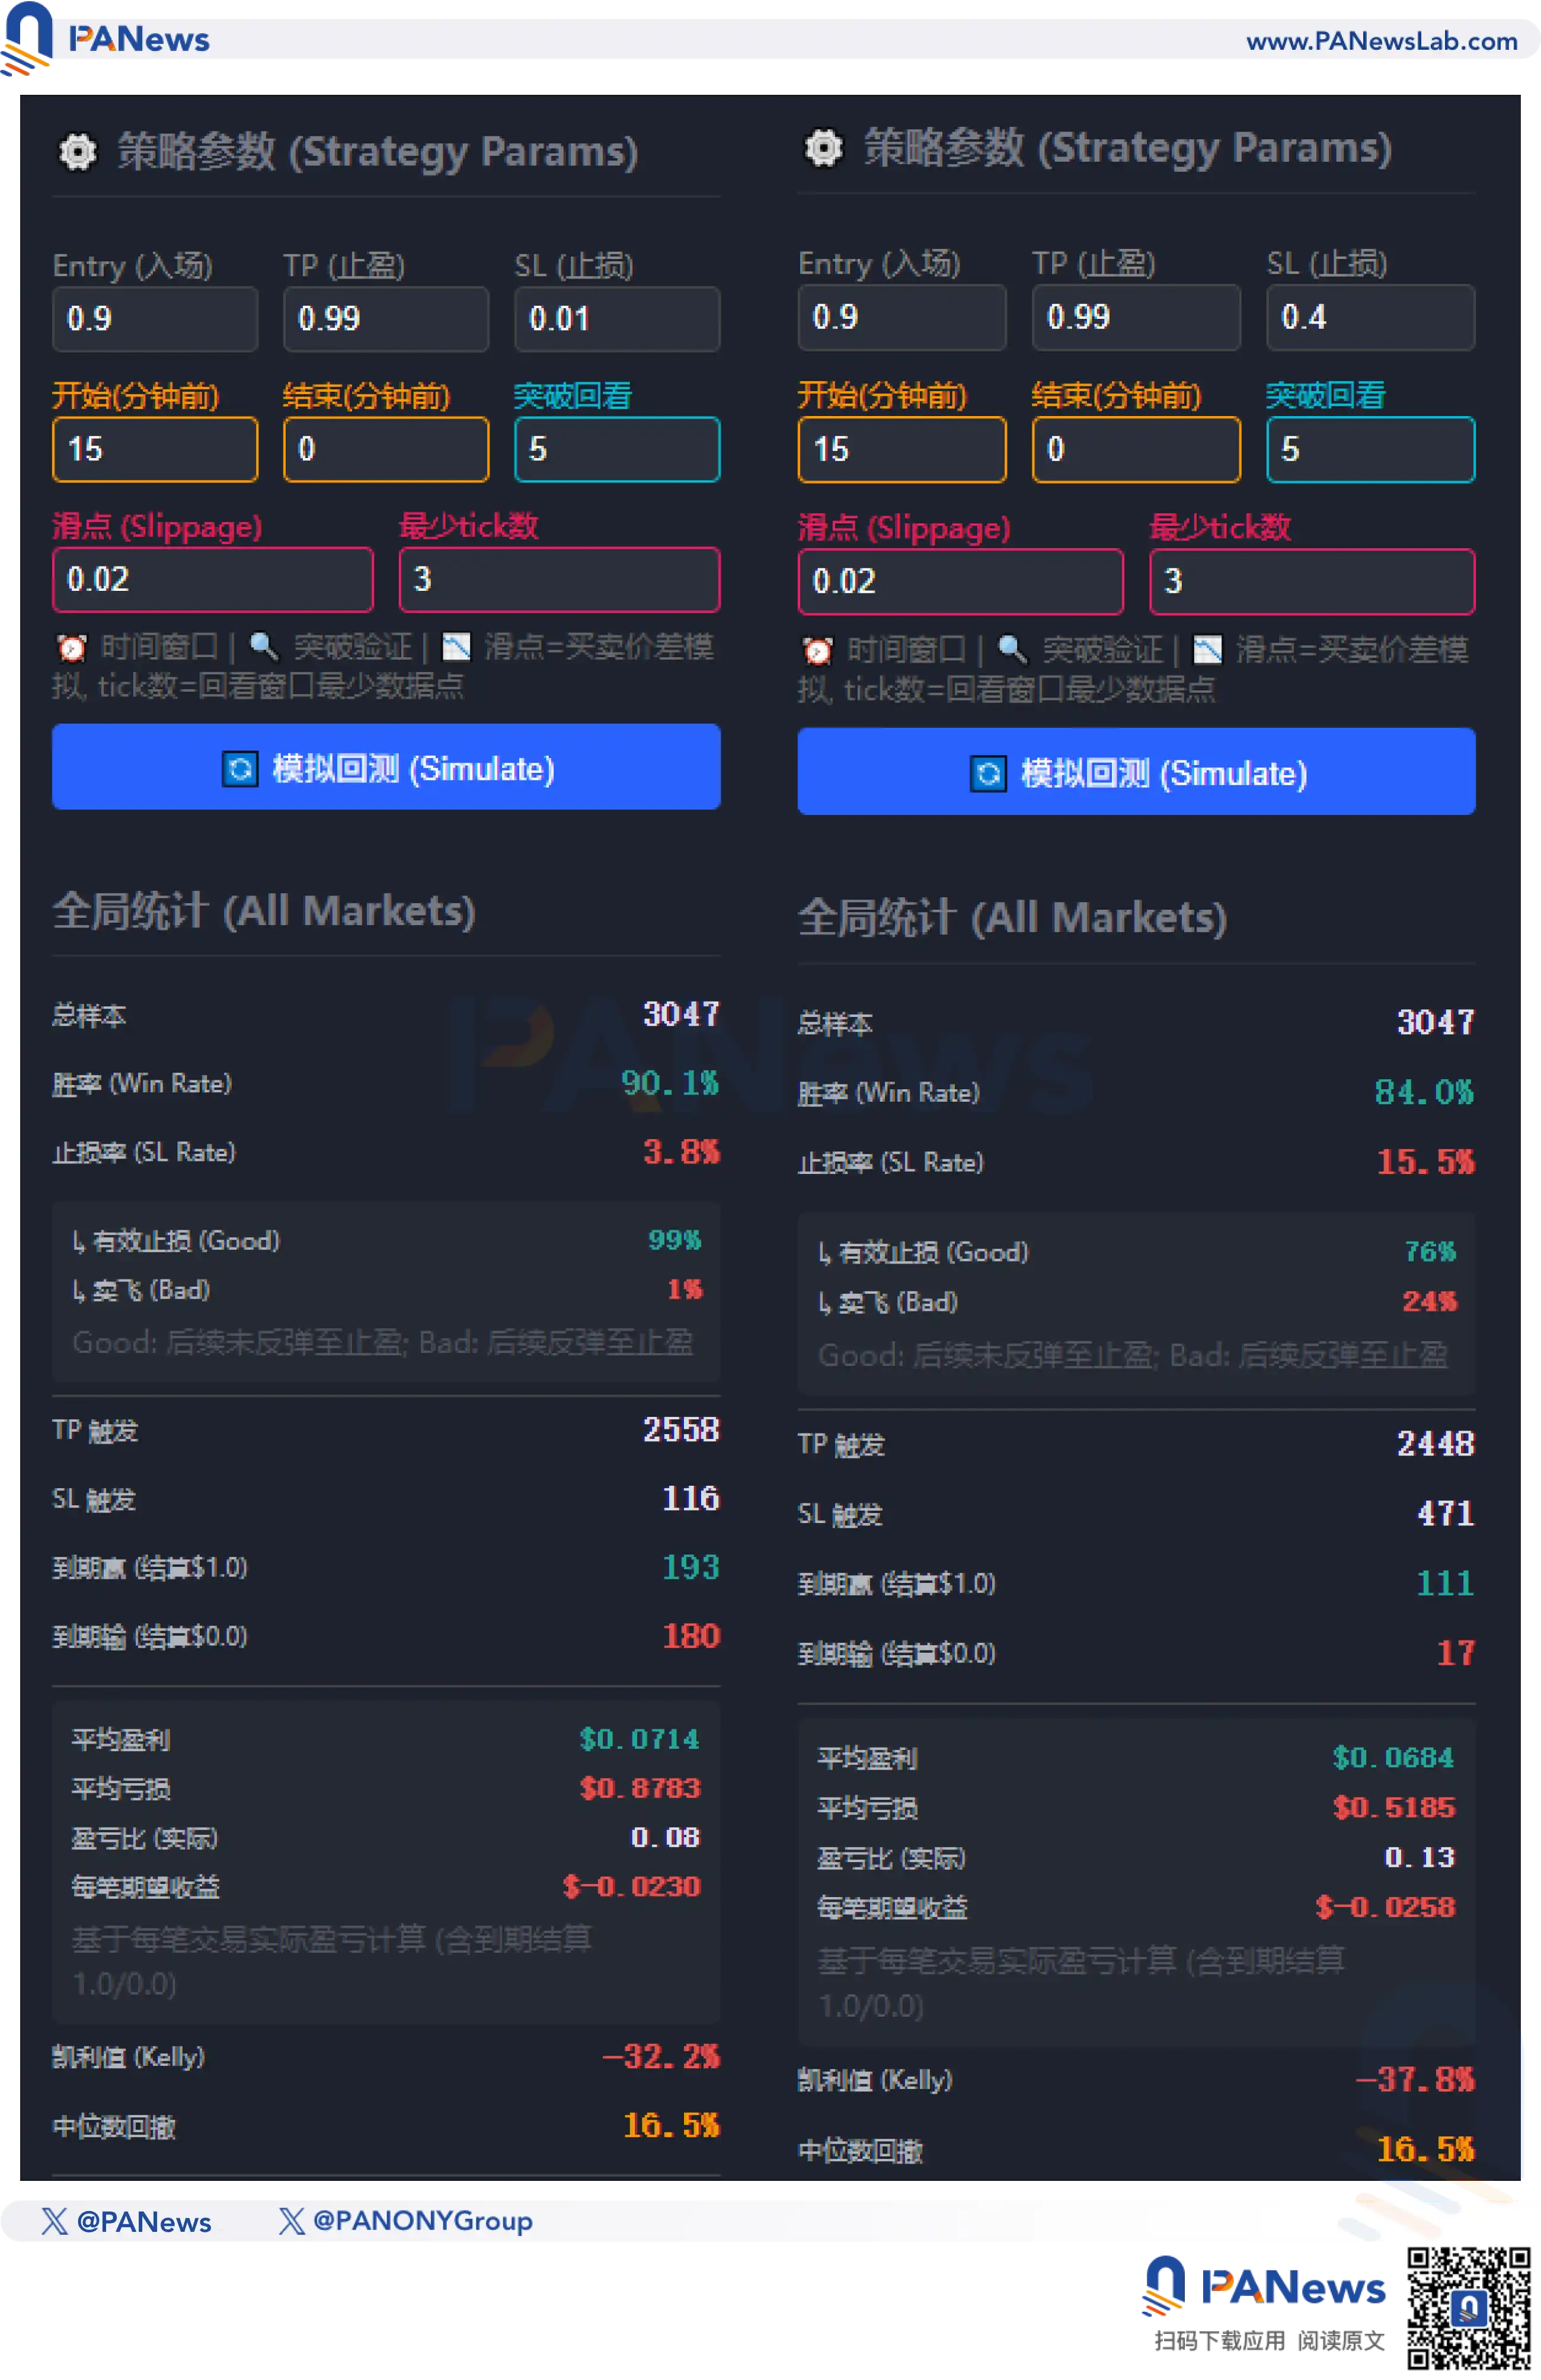
For example, the much-discussed "end-of-market strategy" on social media involves buying at 90% and selling at 99%. It seems this strategy would have a very high win rate and be profitable in the long run. From the actual test results, this strategy indeed has a high win rate of 90.1%, achieving take-profit in 2,558 out of 3,047 simulations. However, the terrifying part is that under this strategy, the actual profit-loss ratio is only 0.08, and the final expectation given by the Kelly criterion is -32.2%, making it not worth adopting.

Some might say, would adding a stop-loss improve the profit-loss ratio? But the残酷的现实 (harsh reality) is that while the profit-loss ratio might improve, the win rate correspondingly decreases. For example, setting a stop-loss at 40% reduces the win rate to 84%. Combined with the still low profit-loss ratio, the final Kelly expectation is -37.8%, still a loss.
Conversely, the strategy closest to profitability was buying for a reversal—buying at 1%, betting that the market would reverse and ultimately win. In the simulation, this approach had a win rate of about 1.1%, higher than the price probability, and an extremely high profit-loss ratio of 94, resulting in an expected return of 0.0004. However, this前提 (precondition) assumes no slippage or transaction fees. Once fees are considered, it instantly becomes a negative expectation.

In summary, our research in this area found that in prediction markets, relying solely on technical analysis from financial trading cannot achieve profitability.

The Trap of "Two-Way Arbitrage"

So, besides this approach, there's another mainstream view: two-way arbitrage. The idea is that if the total cost of YES + NO is less than 1, you can profit regardless of the outcome. Again, this is an idea that is丰满 (plump) in theory but骨感 (bony) in reality.

n

First, if you opt for cross-platform arbitrage, there are already many bots doing this. Ordinary users simply cannot compete with bots for the meager liquidity.

So, to achieve this effect, another方案 (scenario) is, for example, in the same market, buying when the YES price drops to 40% and the NO price also drops to 40%, which could theoretically create a 20% arbitrage space.
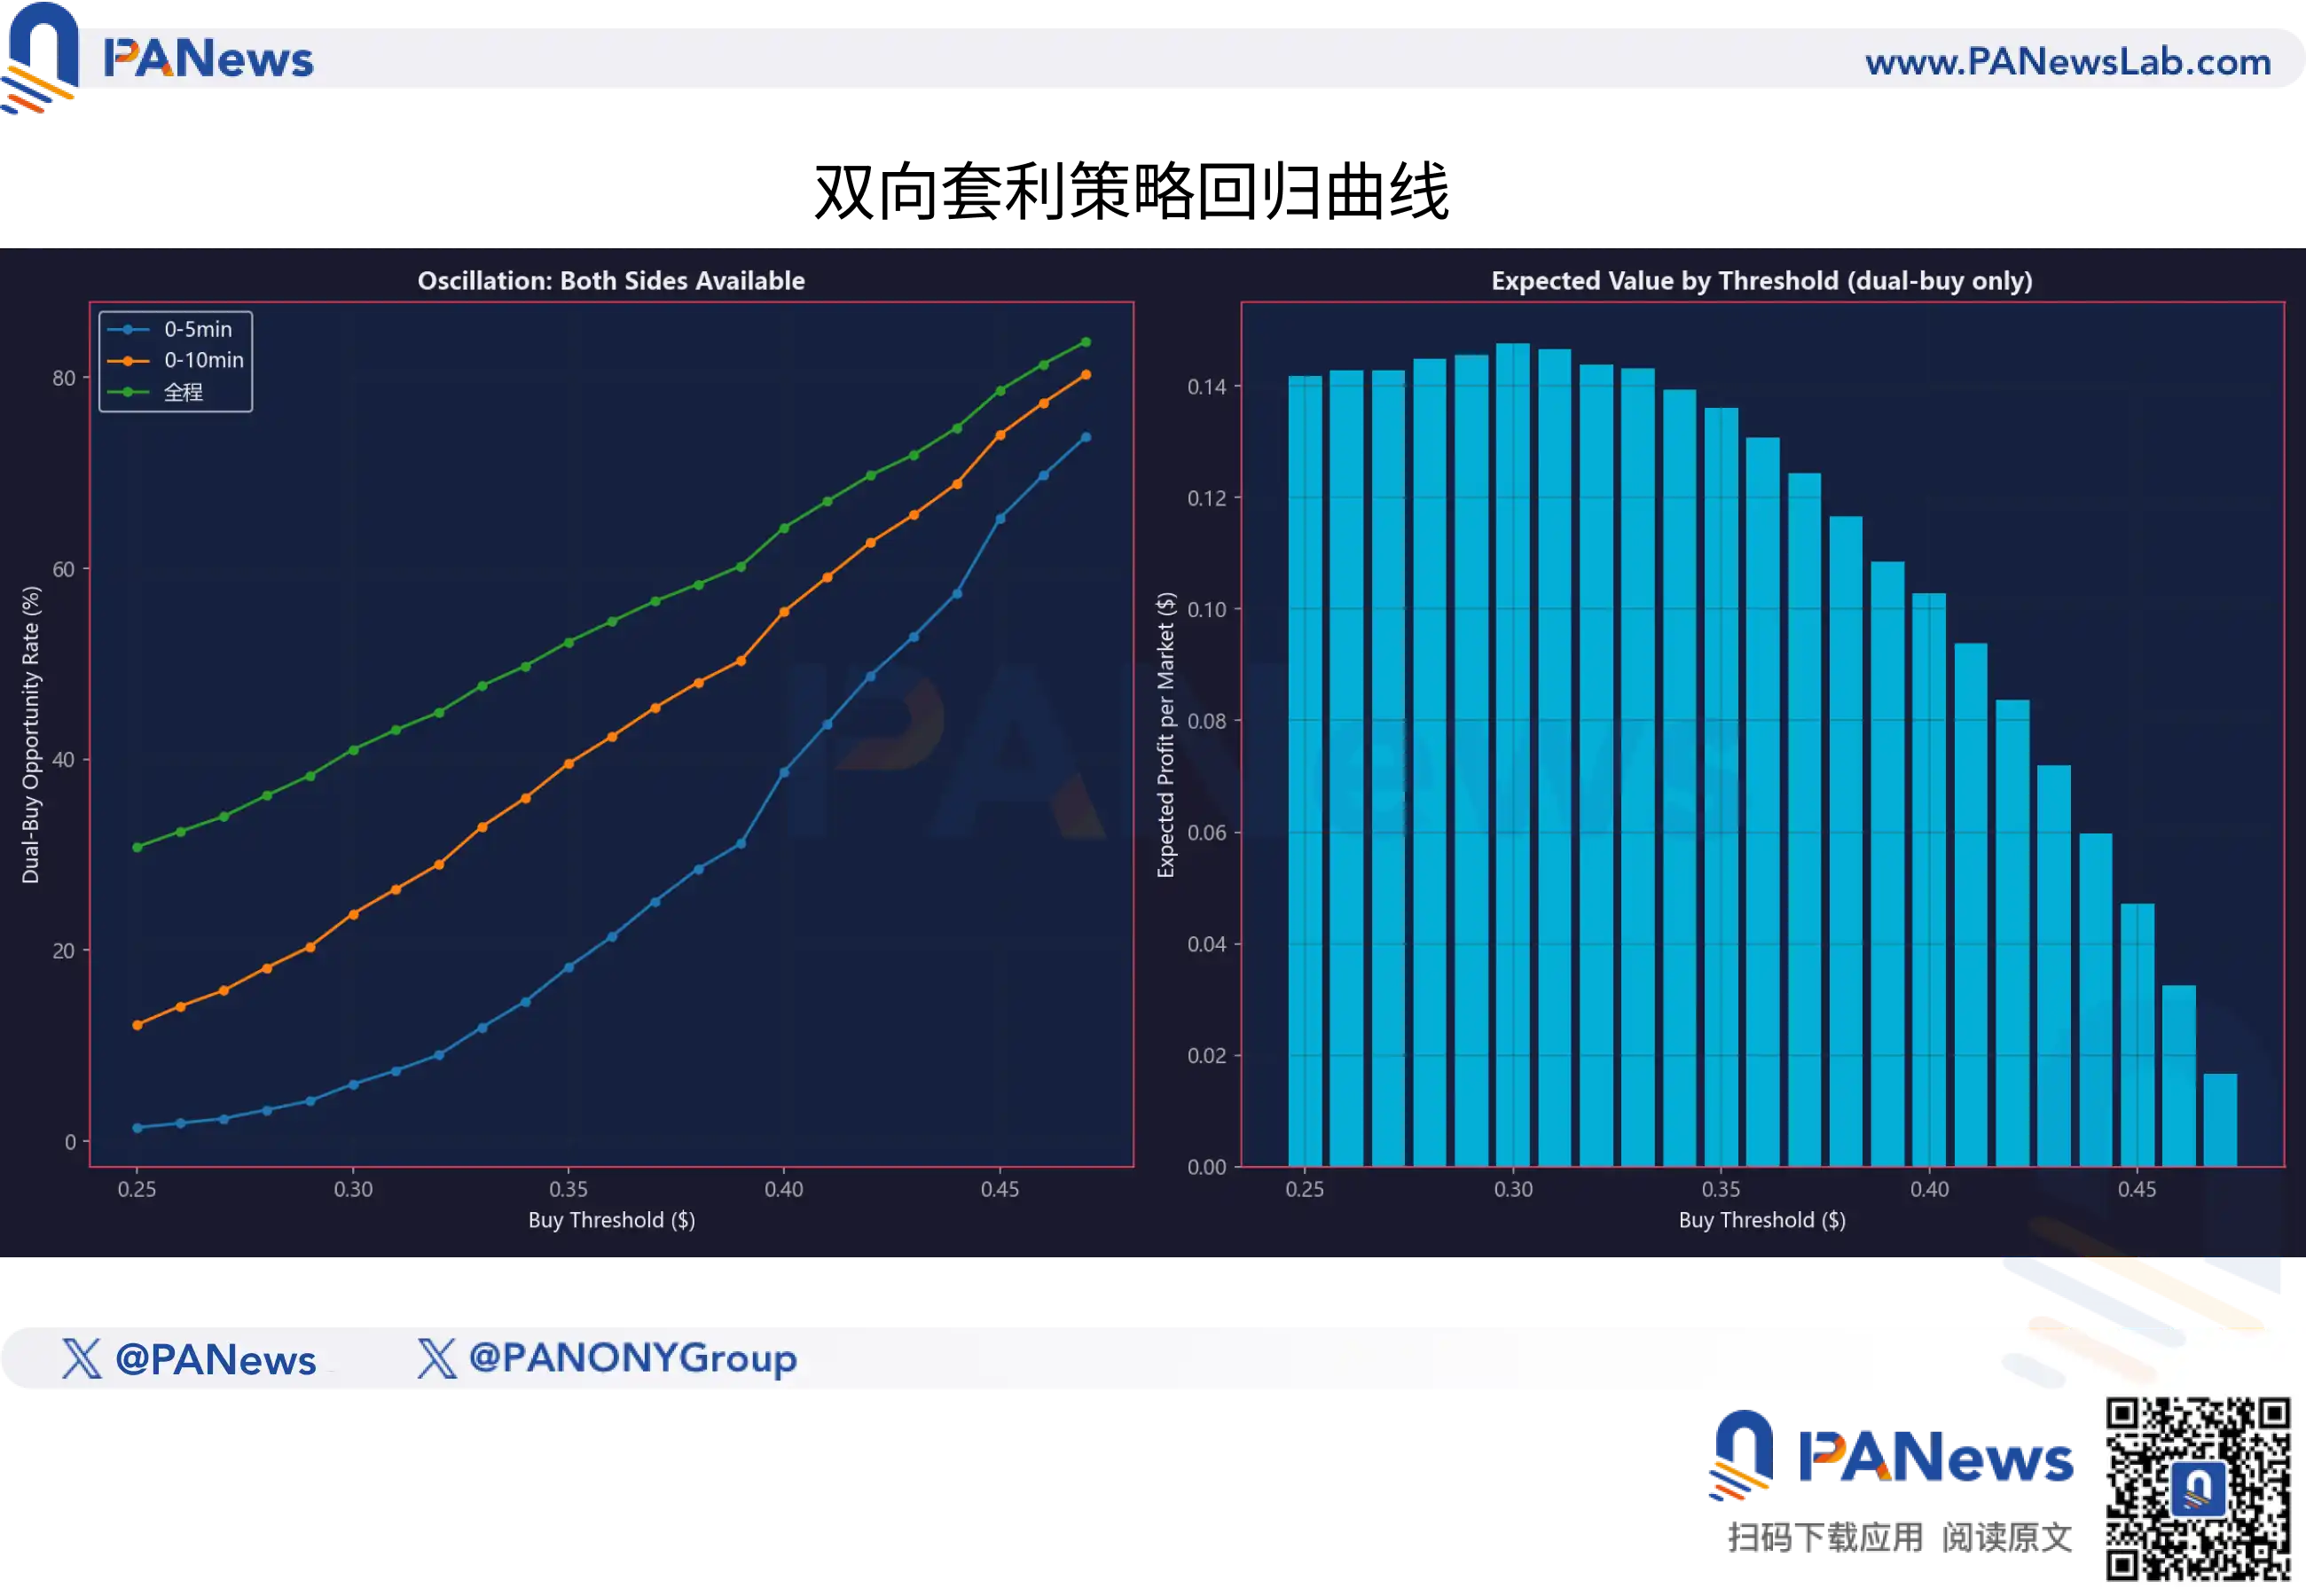
But the final data results tell a different story. Although this strategy has a 64.3% win rate, its excessively low profit-loss ratio still leads to a negative expectation.

This "two-way strategy" looks beautiful on paper but is很容易翻车 (very easy to fail) in practice. Moreover, categorically, this strategy also falls under pure theoretical assumptions detached from the actual event changes.

Fair Value and Deviation Models are the "Golden Key"

So, what kind of strategy can truly achieve profitability?

The answer lies in the "time差" (difference) between the BTC spot price and the prediction market token price.

PANews discovered that the liquidity providers and market maker algorithms in prediction markets are not perfect. When BTC experiences sharp movements within a short time (e.g., 1-3 minutes), such as a sudden price jump exceeding $150 or $200, the price of prediction market tokens does not instantly "teleport" to the theoretical price.

Data shows that this "efficiency gap" in pricing takes an average of about 30 seconds to decay from its maximum value (approx. 0.10) to half (approx. 0.05).

Thirty seconds is an eternity for high-frequency trading, but for manual traders, it's a fleeting "golden window."

This means the prediction market is not a completely efficient market. It's more like a sluggish giant that often reacts half a beat slower after BTC's baton has already been waved.

However, this doesn't mean that fast hands can easily pick up money. Our data further shows that this "delay arbitrage" space is being rapidly compressed. In the微小波动区间 (tiny fluctuation range) where BTC moves less than $50, after deducting Gas fees and slippage, most so-called "arbitrage opportunities" are actually traps with negative expectations.

Besides momentum trading relying on speed, PANews' research also revealed another盈利逻辑 (profit logic) based on "value investing."

In prediction markets, "price" does not equal "value." To quantify this, PANews built a "Fair Value Model" based on 920,000 historical snapshots. This model does not rely on market sentiment but calculates the theoretical probability of winning for the current token based on BTC's current volatility state and the remaining time to settlement.

By comparing the theoretical fair value with the actual market price, we discovered the nonlinear characteristics of pricing efficiency in prediction markets.

1. The Magic of Time

Many retail traders intuitively believe that price should regress linearly over time. But data shows that deterministic convergence is accelerated.

For example, under the same BTC volatility conditions, the price correction speed in the last 3-5 minutes of a match is much faster than in the first 5 minutes. However, the market often underestimates this convergence speed, leading to frequent situations where token prices are significantly lower than their fair value during the mid-to-late stages of a match (remaining 7-10 minutes interval).

2. Only "Deep Discounts" Are Worth Buying

This is the most important risk control conclusion from this research.

Backtesting different levels of deviation index (Fair Value - Actual Price) found:

When the market price is higher than the fair value (i.e., buying at a premium), regardless of BTC's trend, the long-term expected value (EV) is negative across the board.

Only when the deviation index > 0.10, meaning the actual price is at least 10 cents lower than the fair value, does the trade have a robust positive mathematical expectation.
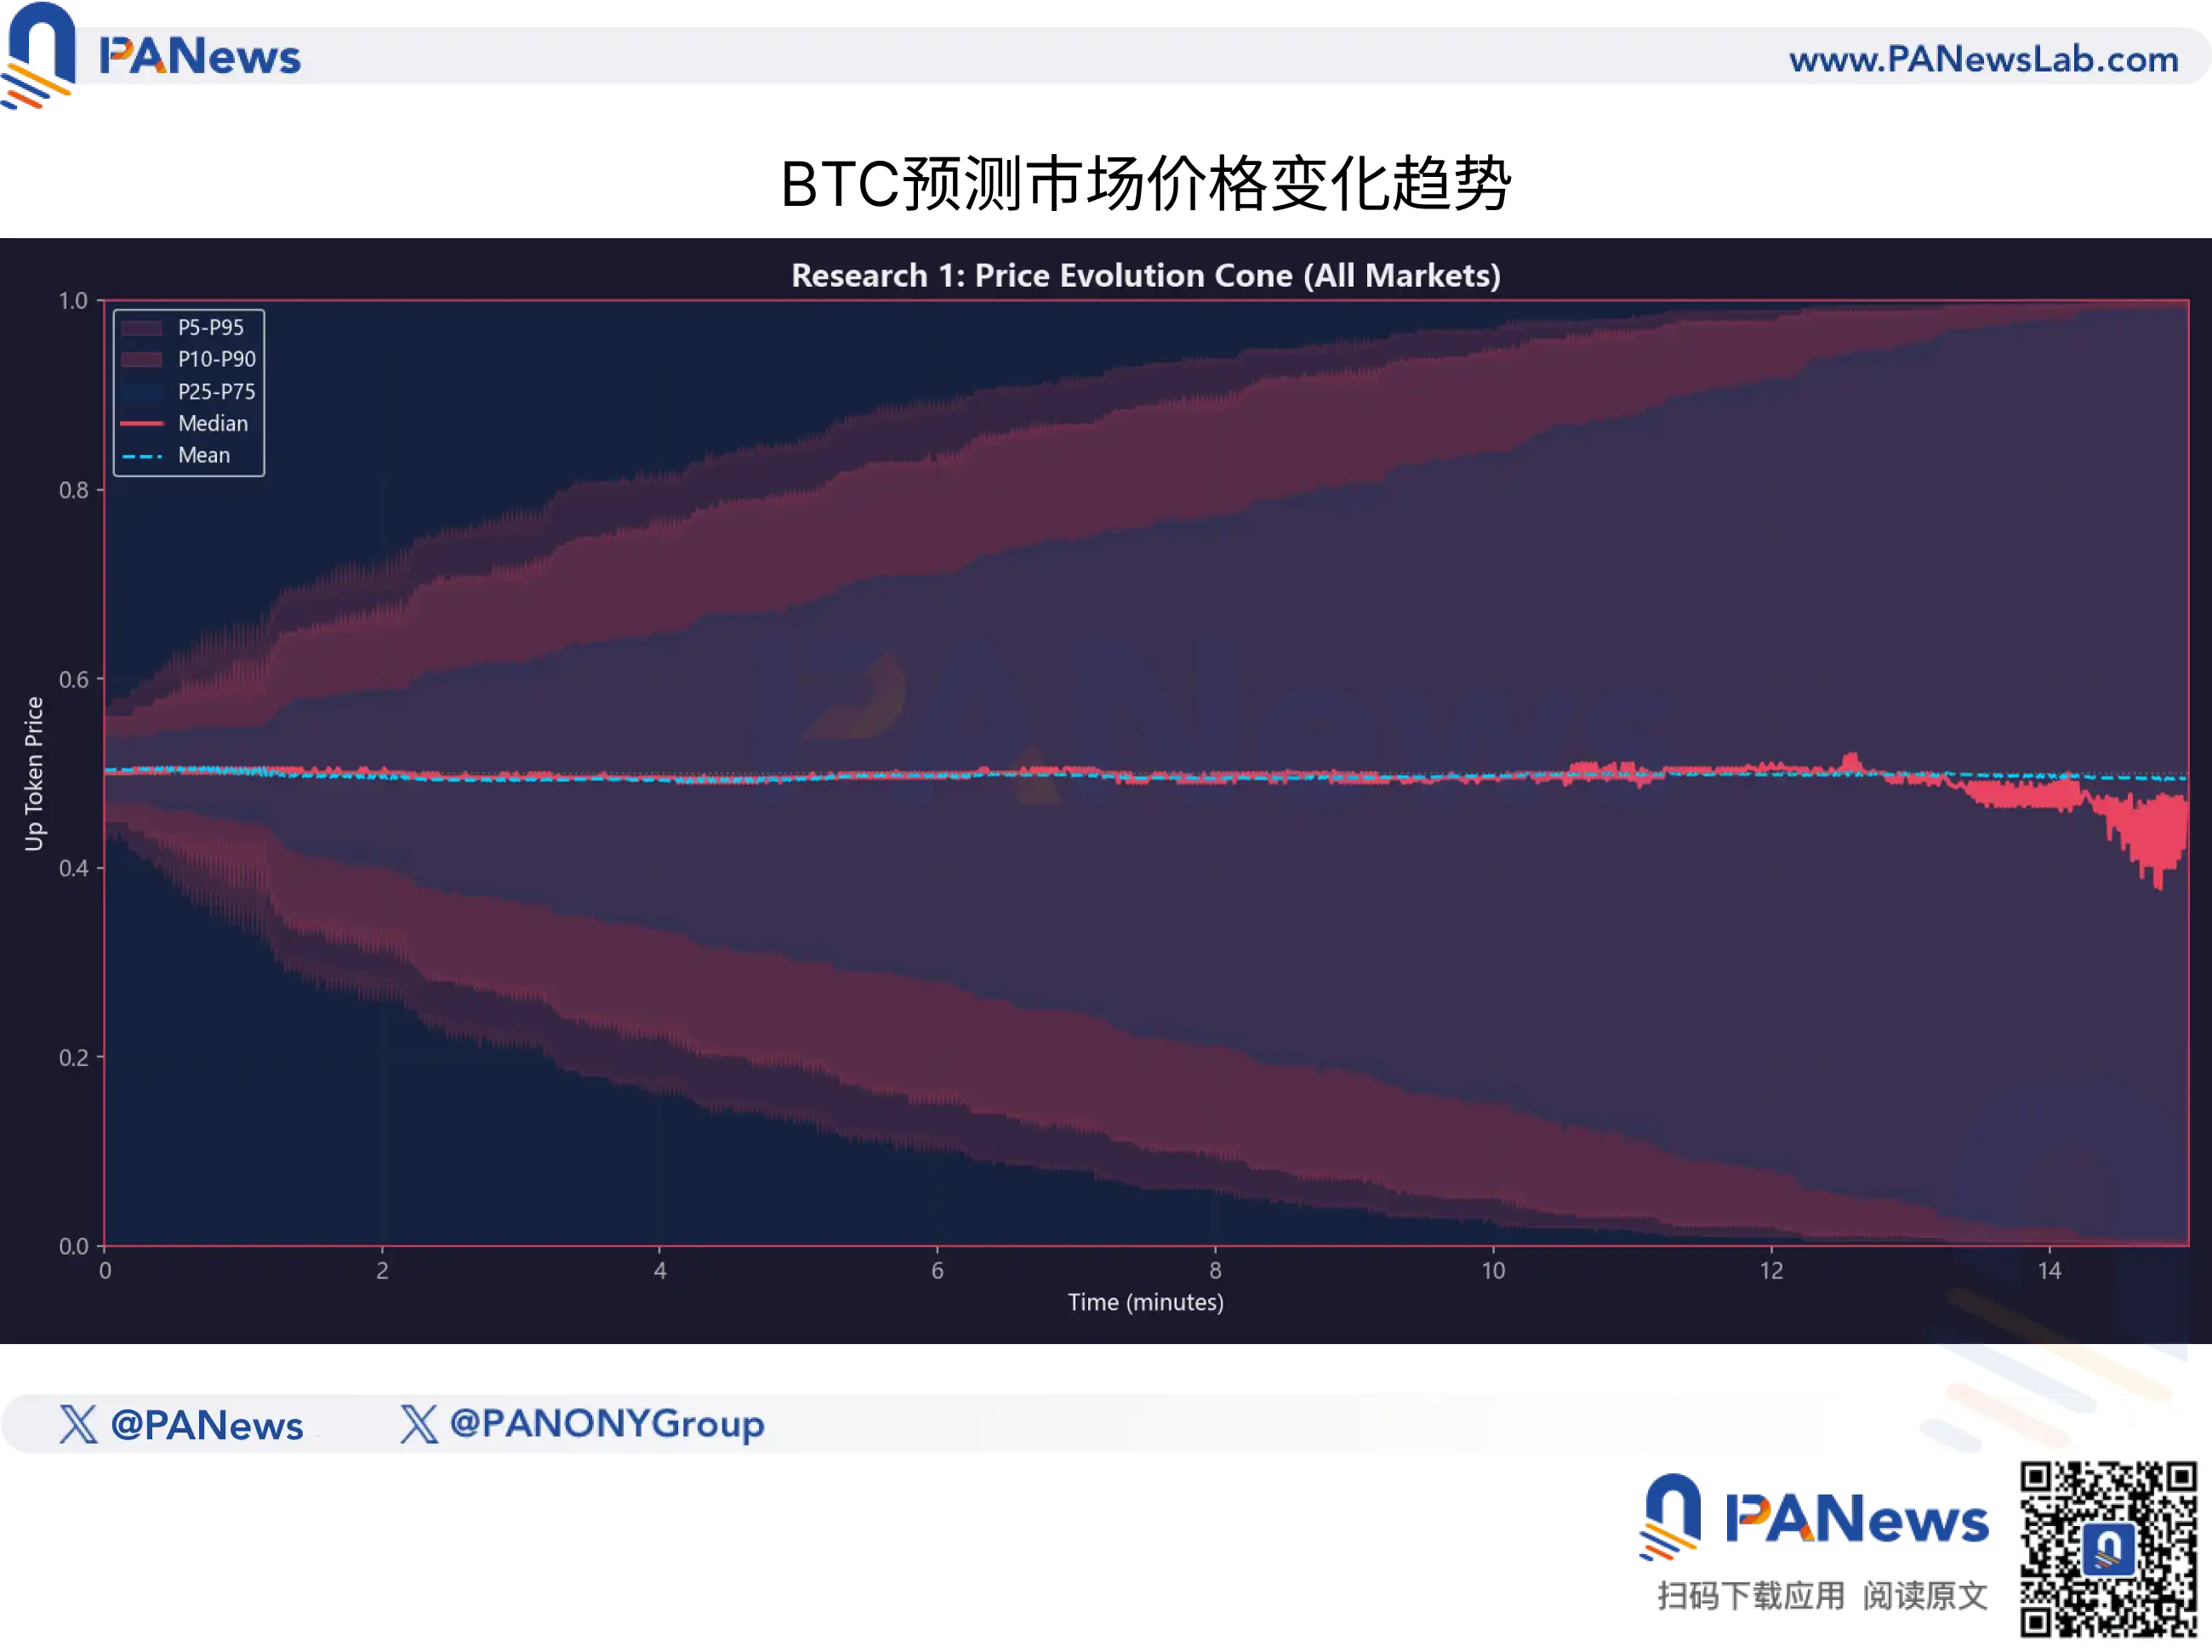
This means that for smart money, a price of $0.70 does not mean "a 70% probability of winning"; it is merely a quote. Only when the model calculates the underlying true win probability to be as high as 85% does $0.70 become a "bargain" worth betting on.

This also explains why many retail traders容易亏损 (easily lose money) in prediction markets—because your actual transaction price is likely bought at a level higher than the market's fair value.

For ordinary participants, this research is a sobering dissuasion and an advanced guide. It tells us:

Abandon K-Line Superstition: Do not try to find patterns in the price charts of prediction tokens; it's a mirage.

Focus on the Underlying Asset: Watch BTC's movements, not the prediction market盘口 (ticker).

Respect the Odds: Even with a 90% win rate, if the price is too expensive (premium), it is still a注定亏损的买卖 (sure-loss trade).

In this algorithm-dominated jungle, if ordinary retail traders cannot establish a mathematical coordinate system for "fair value" and lack the technical ability to capture the "30-second lag," then every click of "Buy" might just be a donation to the liquidity pool.


Пов'язані питання

QWhat was the main finding of PANews' analysis of 27.73 million transactions in the prediction market?

AThe analysis found that purely mathematical predictions, excluding event-based factors, are almost impossible to profit from. None of the 690 K-line strategy combinations tested yielded a positive expected return.

QWhy did the 'tail strategy' (buying at 90% and selling at 99%) ultimately result in a loss despite its high win rate?

AAlthough the tail strategy had a high win rate of 90.1%, its profit-to-loss ratio was extremely low at only 0.08. This combination resulted in a negative Kelly criterion expectation of -32.2%, making it an unprofitable strategy.

QWhat is the 'golden key' or profitable strategy identified in the research for prediction markets?

AThe profitable strategy is based on the 'time difference' or inefficiency between the BTC spot price and the prediction market token price. A 'fair value model' that identifies when the token price is significantly discounted (by at least 10 cents) from its calculated fair value offers a positive mathematical expectation.

QWhat is a major pitfall of the 'two-way arbitrage' strategy in prediction markets?

AThe two-way arbitrage strategy, which involves buying when the sum of YES and NO prices is below 1, often results in a negative expected return due to a low profit-to-loss ratio, even if the win rate is high (e.g., 64.3%). It is difficult to execute profitably against automated bots.

QWhat crucial risk management conclusion does the article provide for participants in prediction markets?

AThe most important conclusion is that only 'deep discounts' are worth buying. A trade only has a robust positive expectation when the deviation index (fair value - actual price) is greater than 0.10, meaning the actual price is at least 10 cents lower than the fair value. Buying at a premium consistently leads to negative expectations.

Пов'язані матеріали

Senior Trader's Confession: How to Trade Market's False Expectations?

Veteran trader's case study: trading the market's "wrong expectations". This trade centered on a textbook "expectation error" after a weak CPI report. While the market initially priced in broad monetary easing (sending Nasdaq to 30,060), the crucial 30-year real yield hit a 20-year high. This signaled a fractured transmission mechanism: short-term rates eased, but long-term funding costs (vital for tech valuations) refused to fall. The trader executed five short positions on the Nasdaq (NQ) as it fell from 30,060 to 28,768. The core methodology: don't just trade the data, but analyze the market's implied causal chain and identify where it breaks. In this case, the chain was: Weak CPI → Policy Easing → Lower Long-Term Funding Costs → NQ Valuation Expansion. The break occurred between policy easing and long-term rates. The "veto variable" – long-term real yields – refused to confirm the bullish narrative. Trades were structured around "fast variables" (price) temporarily repairing while "slow variables" (funding conditions) remained broken. The article outlines a repeatable framework: 1) Map the market's implied causal chain. 2) Identify the veto variable. 3) Observe if it rejects the narrative. 4) Enter when price still follows the old script. 5) Choose the cleanest asset expression (e.g., short NQ, not broad S&P). 6) Define both invalidation and fulfillment exit conditions. The key insight: Alpha often comes not from an information edge, but from a "reaction function edge" – recognizing when the market is applying an outdated causal logic to new data. The critical question: What causal chain is the market's first reaction relying on, and is that chain still valid today?

marsbit25 хв тому

Senior Trader's Confession: How to Trade Market's False Expectations?

marsbit25 хв тому

Opinion: The Hedging Relationship Between U.S. Treasuries and Stocks Has Broken Down, and BTC, as a Risk Asset, Is Under Dual Pressure

For the past 20 years, U.S. investors relied on a free insurance policy: when stocks fell, bonds rose, cushioning portfolio losses. This reliable inverse correlation underpinned entire financial strategies. However, this mechanism broke down around 2020 and has not recovered. Currently, the two-month rolling correlation between the S&P 500 and 10-year Treasury yields is at -0.69, its lowest level since 1996, indicating stocks and bonds are moving in sync to an unprecedented degree, eliminating the traditional portfolio shock absorber. The失效 of this hedge is not simply due to lost confidence in U.S. debt. The key driver is the shift from growth-dominated to inflation-dominated market narratives. When growth fears prevail, stocks and bonds move inversely. Since 2022, persistent inflation volatility has been the dominant factor, causing both asset classes to suffer simultaneously from higher inflation expectations. Investors now seek safety without duration risk, favoring cash, dollars, and short-term Treasuries while selling long-duration bonds. Record U.S. deficits, rising net interest payments, and waning foreign demand (e.g., from Japan) are pressuring long-term yields, with the 30-year yield surpassing 5%. This environment places Bitcoin, as a risk asset on the far end of the risk curve, under dual pressure. Higher risk-free rates increase the opportunity cost of holding non-yielding assets like Bitcoin, while falling equities reduce overall risk appetite. Bitcoin's performance has become highly sensitive to macro conditions such as real yields, dollar strength, and financial conditions. While its long-term thesis as a fixed-supply asset outside the sovereign credit system is strengthened by these fiscal trends, the same conditions hurt it in the short term. The return of bonds as a effective hedge requires inflation volatility to subside, growth risks to retake dominance, and the Fed to have room to ease policy. Until then, Bitcoin trades in a market where the deepest asset class no longer absorbs shocks, removing the safety floor for all risk assets, especially those that pay nothing to wait.

marsbit26 хв тому

Opinion: The Hedging Relationship Between U.S. Treasuries and Stocks Has Broken Down, and BTC, as a Risk Asset, Is Under Dual Pressure

marsbit26 хв тому

Funding Weekly | Crypto.com Secures $400M Investment, CeFi and Stablecoin Sectors Continue to Attract Capital

Crypto Weekly Investment Recap: Funds Converge on CeFi, Stablecoins, and AI Last week's crypto and AI investment landscape saw significant capital concentration, with a few large deals dominating. **Crypto/Web3 Highlights (July 13-19):** Total investment exceeded **$812 million** across 17 deals. Key trends: * **Centralized Finance (CeFi) & Stablecoins** remained a major magnet, led by **Crypto.com**'s massive **$400 million** raise from Citadel Securities, valuing the exchange at $20B. * **Infrastructure & Tools** saw 7 deals, including **Cyclops** ($20M for stablecoin payments) and **ADI Chain** ($50M for stablecoin settlement infrastructure). * **DeFi** had 2 deals, such as AI-native DEX **Quote Trade** ($4M). * Other notable raises: API broker **Alpaca** ($135M), cross-border platform **Flex** ($70M), treasury firm **ORANGE JUICE** ($40M), and prediction market **Pascal** ($9M). * **Acquisitions:** Keyrock bought BlockFills' trading unit, SBI Holdings acquired Singapore exchange Coinhako, and MoonPay bought startup Glide. **AI & Robotics Highlights:** Investment momentum in AI remained very strong. * Nvidia-backed AI cloud service **Fireworks** raised a massive **$1.5 billion** at a $17.5B valuation. * In robotics, **Walden Robotics** (spun out from Toyota) secured **$300 million**, and Chinese humanoid firm ****逐际动力** **(Climax Dynamics) raised nearly **$200 million** in a Pre-IPO round. * Other significant AI raises included Indian programming platform **Emergent** ($130M) and drone company **Brinc** ($125M), backed by Sam Altman. Overall, the trend shows capital flowing heavily into established crypto financial services, stablecoin infrastructure, and large-scale AI/robotics commercialization.

marsbit1 год тому

Funding Weekly | Crypto.com Secures $400M Investment, CeFi and Stablecoin Sectors Continue to Attract Capital

marsbit1 год тому

The Gentlest Bear Market? BTC Bears Exit, ARK and Bitwise Collectively Bullish

**Title: The Mildest Bear Market? BTC Shorts Exit, ARK and Bitwise Collectively Bullish** Bitcoin continues to consolidate around $75,000 while Ethereum struggles near $1,900. Market data shows $116 million in liquidations over 24 hours, with $62.7 million from short positions, and the Fear & Greed Index remains at 35 (Fear). According to Polymarket, there's a 33% probability BTC falls below $50,000 this year. ARK Invest's Q2 2026 Bitcoin report notes technical weakness but identifies potential bottoming signals, including a record high in long-term holder supply, suggesting selling exhaustion. Bitwise's Juan Leon calls this the "structurally mildest bear market" on record, with a ~50% drawdown from highs, less severe than past cycles. He highlights institutional accumulation and a shift in investor dialogue from survival to entry points. Technical analysis from Bit suggests a potential C-wave low may have formed, with an ideal bottoming range between $50,000-$55,000. However, glassnode's CryptoVizArt warns that failure to break $66,000 could signal a local top, as new buyer accumulation is concentrated there. Analyst Darkfost identifies a critical support band between $59,000-$70,000, where 50% of BTC's circulating supply has changed hands. Notably, trader Doctor Profit announced closing all crypto short positions—including BTC shorts from $115k-$125k and over 100 altcoin shorts—for significant profit. He has begun a phased accumulation of Bitcoin spot starting at $64,000, reversing his previous $40k-$50k target, citing structural positives like regulatory clarity and institutional adoption. He argues the anticipated September/October bottom may arrive earlier than the herd expects.

Foresight News2 год тому

The Gentlest Bear Market? BTC Bears Exit, ARK and Bitwise Collectively Bullish

Foresight News2 год тому

Торгівля

Спот
活动图片