Trader's Practical Guide: Avoiding 'Catching Falling Knives' - A Bottom-Fishing Methodology Integrating Fundamentals, Technicals, and Sentiment

marsbitОпубліковано о 2026-01-23Востаннє оновлено о 2026-01-23

Анотація

This guide outlines a systematic framework for buying stocks at their bottom, integrating fundamental, technical, and sentiment analysis to avoid premature buying ("catching a falling knife"). The process begins by identifying the catalyst for a stock's decline and assessing whether it's a temporary issue or a fundamental break in the investment thesis. A thorough fundamental review using the "4M" framework (Business Model, Moat, Management, Margin of Safety) and conservative DCF valuation is essential. Technically, patience is key; wait for signs of seller exhaustion. Strategies include buying on the right side of a V-shaped reversal, after a 5-day EMA crosses above the 20-day EMA, near long-term support levels, or after a base forms at least 5% above 52-week lows. Riskier "waterfall decline" entries require careful scaling-in. Sentiment analysis acts as a contrarian indicator. Extreme pessimism, such as drastically lowered price targets or widespread capitulation from retail investors, can signal a potential bottom. Combining these elements creates a disciplined approach to identify high-probability entry points with a margin of safety.

Author: SixSigmaCapital

Compiled by: Yuliya, PANews

This article aims to summarize a set of procedures for buying at stock price bottoms, detailing practical experiences and lessons learned, and establishing a sustainable framework for identification and execution. It is recommended that investors combine this strategy with other investment philosophies to gain a more comprehensive understanding of the market.

Initial Analysis and Catalyst Tracking

When a stock an investor is interested in begins to decline, close attention should be paid. Identify any upcoming catalysts, whether positive or negative. If there are no clear catalysts, it usually means the investor has more time for analysis.

At this point, the key is to figure out the reason for the stock's decline: is it a company-specific issue or an industry-wide problem? Is the price decline reasonable, or is the market over-penalizing? Is this a temporary problem, or one that fundamentally alters the original investment thesis? If the reason for the decline does not break the initial investment logic, then you can move to the next steps for a more thorough consideration of this investment opportunity.

Fundamental Due Diligence

It is essential to complete fundamental research as early as possible. The classic "4M Framework" is an effective tool, consisting of four dimensions:

  • Business Model (Meaning): What business the company is specifically in.

  • Moat: What competitive advantages the company possesses.

  • Management: The capability and integrity of the management team.

  • Margin of Safety: Whether the current stock price provides a sufficient margin of safety.

It is recommended that investors carefully review the company's financial filings and familiarize themselves with its three main financial statements (Income Statement, Balance Sheet, Cash Flow Statement). Attention should also be paid to earnings call transcripts. If using a DCF (Discounted Cash Flow) model for valuation, be sure to use conservative estimates to determine the stock's intrinsic value. This ensures that when the time comes, the investor knows clearly they are buying at a significant discount.

Incorporating Technical Analysis

Do not bottom-fish too early; patience is key. Ideally, an investor should aim to be among the last to buy the bottom. This is crucial because it allows time to study prior price action and wait for selling pressure to gradually exhaust itself. It is recommended to study charts across multiple timeframes; daily and weekly charts are good starting points.

Here are several technical analysis methods that can be used individually or in combination:

  • Buying on the "right side" of a V-shaped reversal

  • Waiting for the 5-period EMA (Exponential Moving Average) to cross above the 20-period EMA

  • Buying at long-established support levels

  • Waiting for the stock to base build after holding at least 5% above the 52-week low before initiating a tentative buy

  • Buying during a "waterfall decline" (this method is higher risk)

The application of these methods is illustrated below with some case studies.

1. Buying on the "Right Side" of a V-Shaped Reversal

This is a relatively simple strategy: first, determine an ideal price you are willing to pay, then patiently wait for the stock to stop falling. When the price rebounds and rises back to that level, you can execute the trade. This is a higher-probability entry method and allows you to place a stop-loss near the recent low to protect the position.

2. Exponential Moving Average Crossover

Waiting for the 5-period EMA to cross above the 20-period EMA is a straightforward strategy. The core idea is to wait for a potential trend reversal confirmation signal before committing any capital.

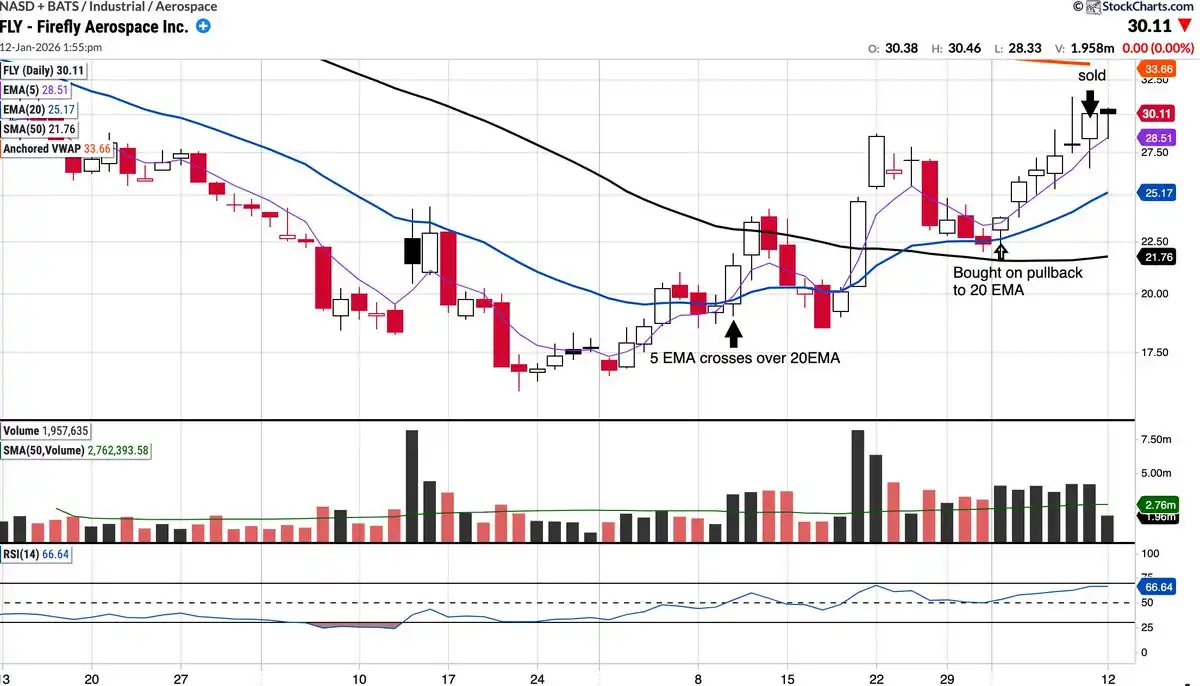
Take the recent FLY trade as an example. The stock had initially caught the investor's attention, but a buy was initiated only after waiting for the 5-day EMA to cross above and hold above the 20-day EMA, entering on a pullback to test the 20-day EMA. This trade ultimately proved successful, yielding a gain of about 35% to 36% over approximately six trading days.
3. Base Building (Basing)

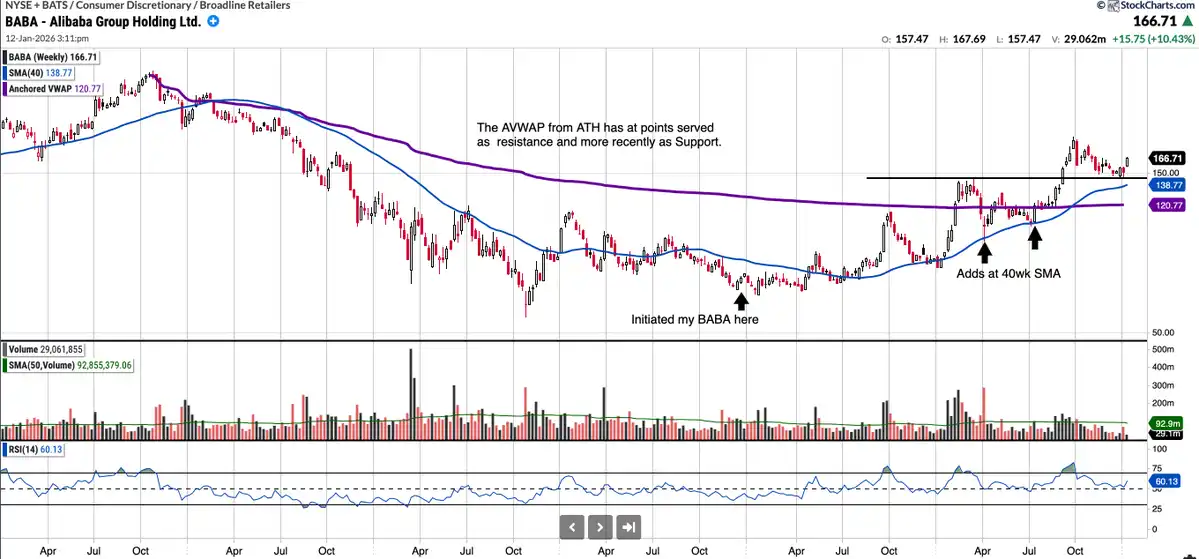
Waiting for a stock to hold and start building a base above its 52-week low (e.g., at least 5% above the low) is another recommended strategy. The reason is simple: investors need to see evidence that the price is likely to hold the previous low and that a trend change might be occurring.

Looking back to 2023, BABA is a good example. Although the stock had bottomed at $55 per share the previous year, an investor chose to enter in December 2023 when the price was between $68 and $70. At that time, the stock was basing, and there was a significant dislocation between price and value, with a P/E ratio of only 7. Later, the investor added to the position when the price pulled back to test the 40-week SMA (Simple Moving Average) and still holds these shares to this day.
4. Waterfall Decline

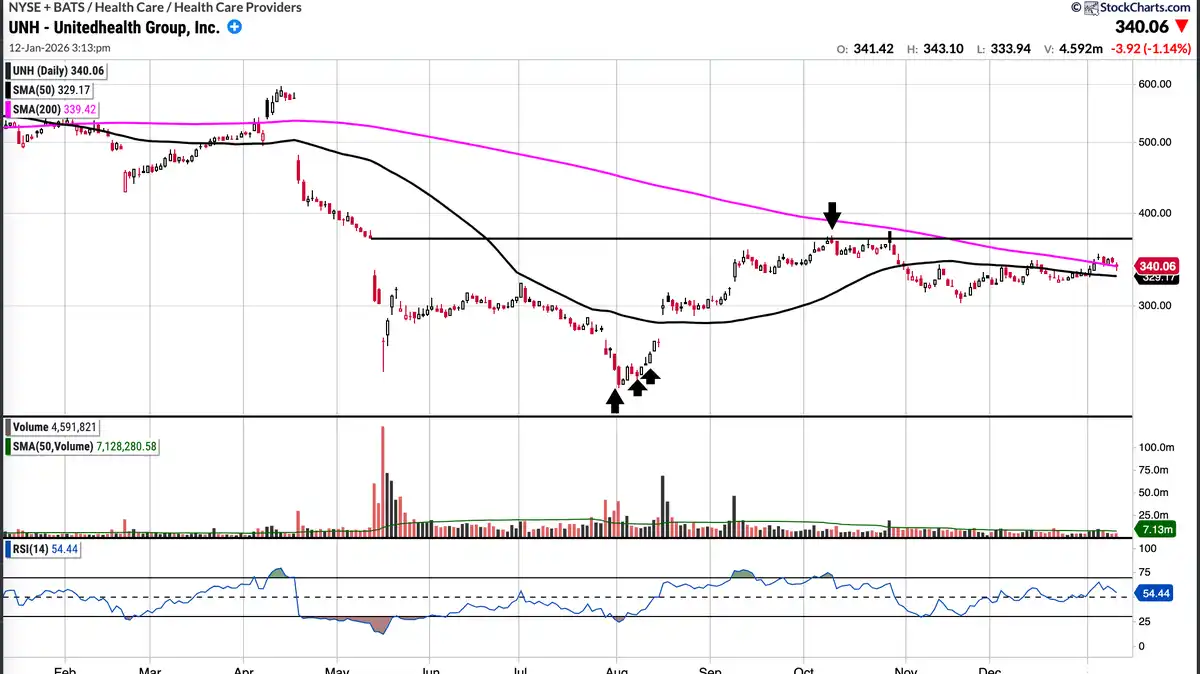
UNH is a case study for trading a "waterfall decline." This is a higher-risk setup, but the risk can be managed by combining the principle of "delayed buying" (waiting for sellers to diminish) and adding on the "right side" of the V-shaped reversal.

When UNH's stock price first declined in mid-May, it entered the investor's watchlist but was not bought immediately. The massive selling volume at the time was enough to cause hesitation. However, after completing fundamental analysis, $240 was marked from a valuation perspective as a level worth considering for a buy. When the price began to fall rapidly in August, buying operations commenced. Buys were made in batches as the price began to recover, in the range of the $230s to $240s. Finally, the position was closed out after the gap was filled in mid-October.
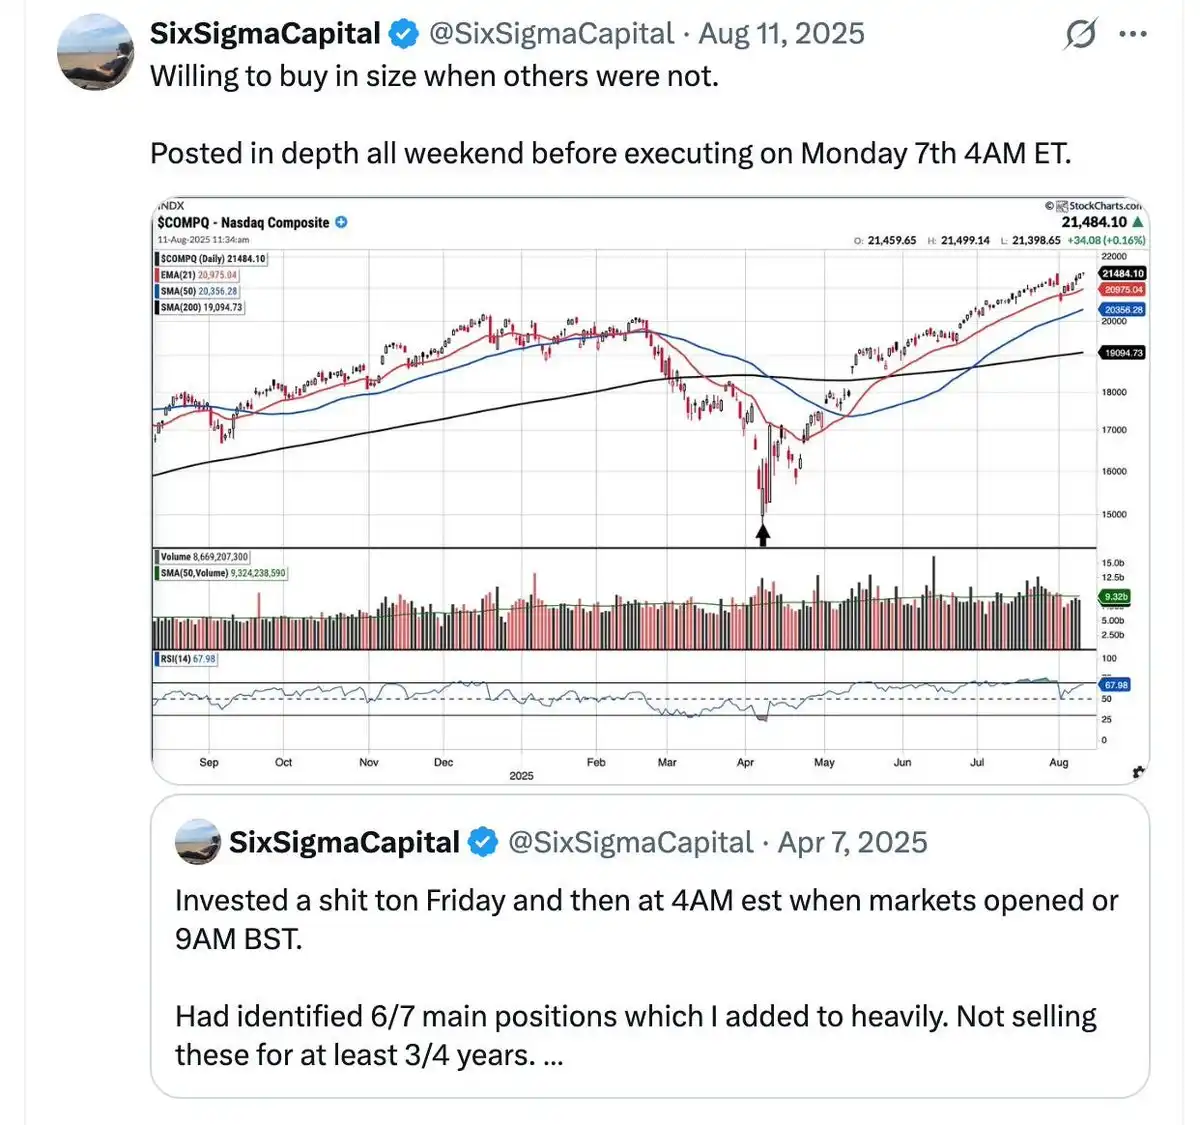
Another successful case of buying a waterfall decline was catching the bottom on April 7, 2025. Deep analysis was conducted throughout the weekend before executing the trade at 4 AM ET that Monday morning.
Sentiment Analysis

Tracking market sentiment is another crucial piece of the decision-making puzzle. Although it is not an exact science, there are several specific methods to incorporate it into the analysis process.

As mentioned before, it is not advisable to buy when the general public is bottom-fishing. Instead, one should look for entry points when early buyers have become frustrated and finally capitulated. An important signal is when extremely pessimistic price targets start circulating in the market, or when investors who are "all-in" on a single stock sell their positions out of despair. Typical examples include the crash Tesla experienced when its stock fell to $150 in April 2024, and the widespread belief at the time that Google was "destined to fail" in artificial intelligence.

Furthermore, waiting for analysts to lower their expectations and price targets is also an effective strategy. This process often reduces risk; once market expectations are lowered, the company only needs to achieve a small beat to potentially trigger a positive stock reaction.

Finally, if you have a following on social media, you can use them to gauge current market sentiment. For example, you can test sentiment by posting something like: "I bought UNH at $237, am I screwed?" If the post gets unusually high engagement and the replies are overwhelmingly bearish, even with some calling for prices below $100, such extreme pessimism can be seen as a good contrarian indicator.


Пов'язані питання

QWhat is the four-dimensional framework mentioned for fundamental due diligence?

AThe four-dimensional framework is the '4M Framework', which includes: 1. Meaning (What business the company is in), 2. Moat (The company's competitive advantages), 3. Management (The capability and integrity of the management team), and 4. Margin of Safety (Whether the current stock price provides a sufficient margin of safety).

QAccording to the article, what is a key technical analysis strategy for entering a position after a 'V-shaped reversal'?

AThe key strategy is to buy on the 'right side' of the V-shaped reversal. This involves first identifying an ideal price you are willing to pay, then waiting for the stock to stop falling. When the price rebounds and rises back to that level, you can execute the trade, allowing you to set a stop-loss near the recent low.

QHow does the article suggest using market sentiment as a contrarian indicator?

AThe article suggests looking for extreme pessimism as a contrarian indicator. This includes when extremely bearish price targets are circulating, when 'all-in' investors sell out of desperation, or when analyst expectations and price targets are downgraded. It also mentions gauging sentiment through social media, where a high volume of bearish replies to a post about a purchase can signal a potential buying opportunity.

QWhat is the recommended approach for buying during a 'waterfall decline' to manage risk?

AThe recommended approach for a 'waterfall decline' is to manage risk by combining the principle of 'delayed buying' (waiting for selling pressure to subside) with adding to the position on the 'right side' of a V-shaped rebound. This avoids buying into the initial, high-volume selloff and instead focuses on entering as the price begins to recover.

QWhy does the article emphasize the importance of identifying the catalyst for a stock's decline?

AIdentifying the catalyst is crucial to determine if the price drop is due to a company-specific issue or a broader industry problem, and to assess whether it is a temporary setback or a fundamental change that breaks the original investment thesis. This analysis helps investors decide if the sell-off is an overreaction and if the opportunity warrants further investigation.

Пов'язані матеріали

Must-Watch Events Next Week|CLARITY Act Could Face Senate Vote; SpaceX, Circle to Report Earnings (8.3-8.9)

**Summary: Key Events and Developments to Watch (August 3-9)** The upcoming week is marked by significant financial disclosures, key legislative deadlines, and notable product updates. **Major Financial Events:** Several companies are scheduled to release their Q2 2026 earnings. American Bitcoin (ABTC) will report on August 3, followed by SpaceX and Hut 8 Mining Corp. on August 4, and Circle on August 5. Notably, a significant portion of SpaceX shares (up to 12% of total shares) will be unlocked on August 6 following their earnings release. **Key Legislative Deadline:** The U.S. Senate faces an August 7 deadline to secure 60 votes for the CLARITY Act, a bipartisan bill aiming to establish a federal regulatory framework for cryptocurrencies. The Senate may hold a full vote on the bill during the week. **Economic Data:** The U.S. July Non-Farm Payrolls report will be released on August 7, providing crucial labor market data. **Technology & Product Updates:** * **Shutdowns:** DeFi portfolio tracker Zapper and wallet app Ctrl Wallet will cease operations on August 3. * **Upgrades:** LayerZero will deprecate its v1 relayers on August 3. XRP Ledger's new version 3.3.0, featuring five new functions, is expected next week. * **AI:** Elon Musk announced that the advanced Grok 4.6 AI model is set for release around August 7. * **Bitcoin:** The BIP-110 forced signaling for a potential Bitcoin network change is scheduled to begin around August 8. **Other Notable Events:** Chinese robotics firm Unitree Tech has set its preliminary price inquiry for its IPO for August 5. South Korean exchange Upbit will delist AQT and AERGO tokens on August 3.

marsbit1 год тому

Must-Watch Events Next Week|CLARITY Act Could Face Senate Vote; SpaceX, Circle to Report Earnings (8.3-8.9)

marsbit1 год тому

Stocks Are Plummeting More Sharply Than Cryptocurrencies. Where Has the Money Gone?

Stock Markets Plunge Deeper Than Cryptocurrencies: Where Did the Money Go? In late July, Seoul's Kospi index triggered circuit breakers for two consecutive days, plummeting over 40% from its June high. The collapse was led by heavyweight stocks like SK Hynix, whose record profits still disappointed investors, and devastating leveraged ETFs, with one major product losing over 83% of its value. This signaled a global, forced deleveraging targeting the most crowded trades. Interestingly, while stocks exhibited extreme volatility akin to crypto markets, Bitcoin rose nearly 15% in July after a prior steep drop. Analysis shows the money fleeing equities did not flow into Bitcoin. Instead, Bitcoin had already absorbed its sell-off in May-June, when U.S. spot Bitcoin ETFs saw historic outflows. The true safe-haven beneficiary was gold, whose price rose over 20% year-on-year, highlighting a decoupling between Bitcoin and gold as "digital gold." The sell-off was a targeted unwinding of leveraged positions in tech and semiconductors, accelerated by broker-dealer risk management and shifts in the AI narrative, including new competition from Chinese memory chipmakers. The retreat path was clear: from high-valuation tech stocks to cash and U.S. Treasuries, then to gold. For Bitcoin to attract sustained institutional inflows, conditions like eased global liquidity pressure, a "soft-landing" Fed rate cut, and U.S. regulatory clarity via legislation like the stalled CLARITY Act are needed. Currently, Bitcoin is not a safe haven but an already-cleared asset. Its low correlation with tech stocks, however, makes it a potential diversification play for institutional portfolios once the storm passes. The money isn't here yet, but the positioning is underway.

marsbit1 год тому

Stocks Are Plummeting More Sharply Than Cryptocurrencies. Where Has the Money Gone?

marsbit1 год тому

In Conversation with Ray Dalio: We Are Currently in an AI Bubble, with 1% of My Portfolio in Bitcoin

Ray Dalio, founder of Bridgewater Associates, warns in an interview that the current AI boom shows classic bubble characteristics, which could lead to significant economic downturns as seen in past cycles like 1929 or 2000. He explains that speculative enthusiasm, fueled by debt and overvaluation, often precedes a crash when rising rates or taxation force asset sales, causing widespread losses and recession. Dalio also outlines his "Big Cycle" theory, describing an approximate 80-year pattern where widening wealth gaps, massive government deficits, and shifting geopolitical power (like China's rise) create internal conflict and global instability. He emphasizes that we are in a late-cycle, transitional phase where traditional powers like the US and UK face decline. For personal wealth protection, Dalio advises diversification beyond cash into assets like stocks, bonds, real estate, and particularly gold, which he prefers over Bitcoin. While he holds about 1% of his portfolio in Bitcoin as a non-printable hard asset, he views gold as more secure from technological or governmental threats. Regarding AI's impact, Dalio believes it will disproportionately benefit capital owners, worsening inequality by replacing both physical and cognitive labor. He suggests that human intuition and emotional intelligence, combined with AI, will be key for future workers. On taxation, Dalio argues that wealth taxes are impractical and risk triggering asset sell-offs, reducing productive investment. He points to the UK as a cautionary example of debt, low productivity, and political strife. Geopolitically, Dalio foresees a more regionalized world, with the US showing weakness in prolonged conflicts like with Iran, akin to past imperial declines. The ideal outcome, he suggests, is coexisting powerful blocs (e.g., Americas, China-Asia Pacific) without major war.

marsbit5 год тому

In Conversation with Ray Dalio: We Are Currently in an AI Bubble, with 1% of My Portfolio in Bitcoin

marsbit5 год тому

Торгівля

Спот
活动图片




