Three Weeks into the US-Iran War: Who is Profiting and Who is Paying?

marsbitОпубліковано о 2026-03-24Востаннє оновлено о 2026-03-24

Анотація

Three weeks after the U.S. and Israel launched military strikes against Iran, the conflict has severely disrupted global energy markets. The blockade of the Strait of Hormuz cut off 20 million barrels of daily oil transit, with IEA reporting a net loss of 11 million barrels per day—exceeding the combined impact of the 1973 oil embargo and 1979 Iranian revolution. Over 40 energy facilities across the Middle East were damaged, and global gas supply fell by 140 billion cubic meters. Russia emerged as a key beneficiary: its Urals crude price surged nearly 80% from under $60 to around $90 per barrel, narrowing the discount to Brent. Sanctions-era price caps effectively collapsed as India increased fossil fuel purchases from Russia by 48% in early March. Russia earned an additional €672 million in oil revenue in just two weeks. U.S. consumers faced a 33% spike in gasoline prices, with jet fuel costs rising over 60%. United Airlines cut flights, warning of potential $110 billion in added annual costs if oil hits $175/barrel. Global airlines from Delta to Qantas raised fares or reduced capacity. Even gig economy platforms like DoorDash began offering fuel subsidies to drivers. With a U.S. sanctions exemption on Russian oil set to expire April 11, further market volatility is expected.

On February 28, the United States and Israel launched a military strike against Iran. Iran immediately blockaded the Strait of Hormuz, cutting off the global daily transit of 20 million barrels of oil. Three weeks later, on March 23, IEA Director Fatih Birol provided a figure at the National Press Club of Australia: the global daily oil supply loss caused by this war is 11 million barrels.

This figure exceeds the combined losses of the 1973 oil embargo and the 1979 Iranian Revolution crises.

Energy infrastructure at over 40 sites across 9 Middle Eastern countries suffered varying degrees of damage. Concurrent IEA data shows that the global natural gas supply loss reached 140 billion cubic meters, nearly double the European gas loss during the Russia-Ukraine conflict (75 billion cubic meters). In just three weeks, the quantitative shock this conflict inflicted on the energy market has surpassed that of the entire 1970s.

But the supply loss is only half the story. The other half is that there are clear beneficiaries of this crisis.

Putin's Windfall

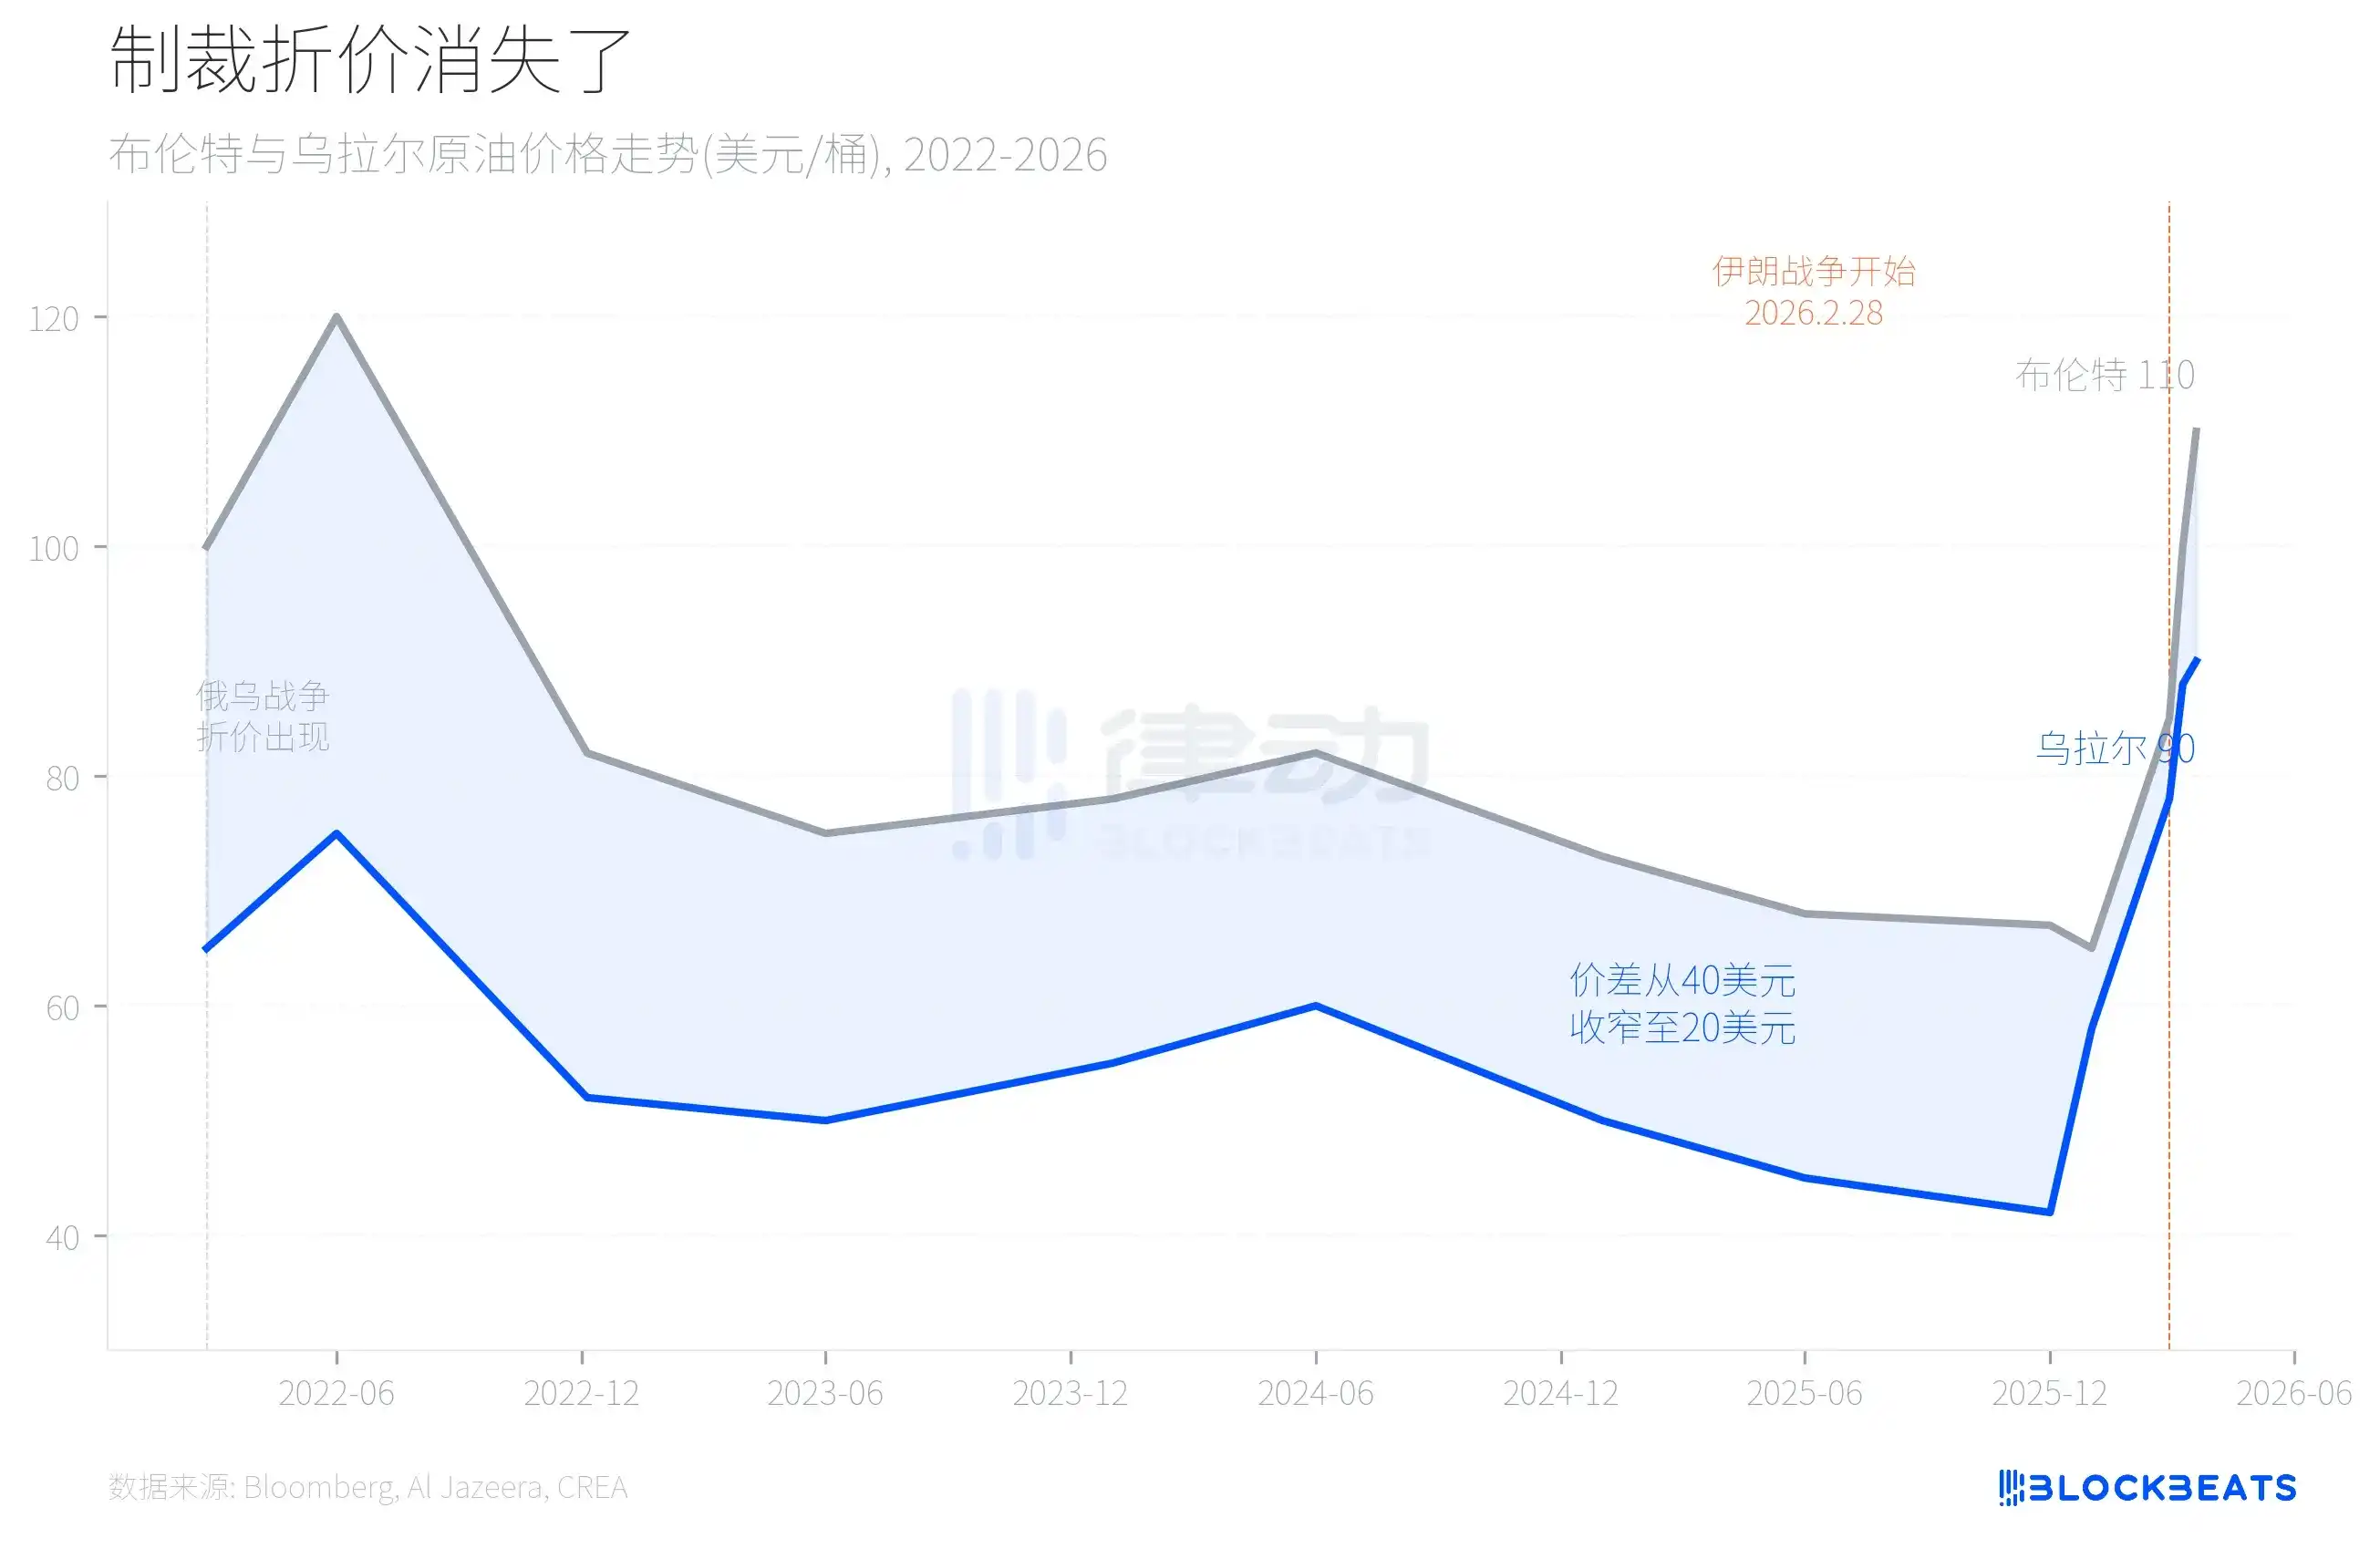
Before the Iran war began, Urals crude was trading at less than $60 per barrel. This price had been locked in for nearly three years, a direct result of Western sanctions. After the Russia-Ukraine war broke out, Europe and the US imposed a price cap on Russian oil, maintaining a long-term discount of $30 to $40 between Urals crude and the international benchmark Brent. This discount was the most直观 signal of the sanctions working.

The Iran war changed all that. Following the blockade of the Strait of Hormuz, a huge gap appeared in the global oil market, forcing buyers to seek alternative supplies. According to data from the Centre for Research on Energy and Clean Air (CREA), Russia's total fossil fuel export revenue reached 7.7 billion euros in the first two weeks of March, averaging 513 million euros per day, an 8.7% increase from February's 472 million euros per day. Daily oil export revenue averaged 372 million euros, earning an extra 672 million euros (approximately $777 million) over those two weeks.

Urals crude rose from under $60 to around $90 within three weeks, a surge of nearly 80%. As reported by Al Jazeera, energy analyst George Voloshin pointed out that Brent also rose from around $65 to over $110 during the same period, but the key is not the absolute price, but the spread between them. The discount of Urals to Brent narrowed significantly from the pre-war level of about $40. The Moscow Times reported on March 16 that Urals crude delivered to India briefly traded at a premium to Brent, something that had not happened since the sanctions took effect.

In other words, a significant part of the economic wall built by three years of Western sanctions was dismantled by three weeks of war in Iran.

The Trump administration announced a 30-day sanctions waiver on March 12, allowing countries to purchase Russian oil en route, with Treasury Secretary Scott Bessent stating it would release about 140 million barrels of supply. However, analysts widely believe the waiver's condition of "not generating significant financial benefit" is nearly impossible to enforce. Concurrently, the IEA announced the release of 400 million barrels from strategic petroleum reserves, the largest such release in history. This waiver is set to expire on April 11, at which point the market will face a new round of uncertainty.

India is the most direct actor. CREA data shows that India's purchases of Russian fossil fuels totaled 1.3 billion euros in the first two weeks of March, averaging 89 million euros per day, a 48% increase from February's daily average of 60 million euros. Al Jazeera confirmed that at least 7 tankers originally bound for China changed course to India mid-voyage, with one ship named Aqua Titan arriving at an Indian port on March 21. While the world worries about oil prices, oil trade between Moscow and New Delhi is accelerating.

Who is Paying?

Losses on the supply side and gains on the beneficiary side ultimately get passed on to the consumer. American consumers are bearing the most direct burden.

AAA data shows the US national average price for gasoline rose from $2.98 before the war to $3.96 on March 23, a 33% increase. The average price in California reached $5.56, while the lowest, in Kansas, was $3.23. The average diesel price hit $5.07, the highest since 2022.

Fortune reported that this round of oil price increases has effectively swallowed up the tax refunds American families just received.

The aviation industry was among the first to feel the impact. Platts assessment data shows US jet fuel prices rose over 60% in three weeks, doubling in some regions. United Airlines became the first major US carrier to officially announce capacity cuts. CEO Scott Kirby stated in an internal memo that the company is preparing for oil prices to probe $175 per barrel, which would mean an annual fuel cost increase of about $11 billion, more than double the company's "best annual profit in history." United will cut 5% of its flights in the second and third quarters.

The effects are spreading globally. According to a CNBC report on March 21, Delta Air Lines also warned it might reduce capacity. Euronews reports show that Qantas, SAS, and Thai Airways have already raised prices, and Air New Zealand has canceled over 1,000 flights.

Even the gig economy is affected. According to a Philadelphia Inquirer report on March 23, DoorDash began issuing weekly gas subsidies of $5 to $15 and 10% cash back on gas to drivers, in response to reduced order acceptance due to rising fuel costs. When a food delivery platform has to pay for a war in the Middle East, the length of the shock transmission chain needs no further explanation.

Three weeks into the Iran war, the world loses 11 million barrels of oil daily, Russia made nearly $800 million extra in 15 days, American consumers are paying a third more for gas, and this transmission chain will continue to lengthen after the sanctions waiver expires on April 11.

Трендові криптовалюти

Пов'язані питання

QAccording to the IEA, what was the daily global oil supply loss caused by the Iran war after three weeks?

AThe daily global oil supply loss was 11 million barrels of oil per day.

QWhich country's fossil fuel exports saw a significant financial gain, and what was the increase in its daily export revenue in the first two weeks of March?

ARussia's fossil fuel exports saw significant gains. Its daily export revenue increased to 513 million euros per day in the first two weeks of March, up 8.7% from 472 million euros in February.

QHow did the price of U.S. gasoline change from pre-war levels to March 23rd, and what was the national average price on that date?

AThe U.S. national average gasoline price rose 33% from the pre-war price of $2.98 to $3.96 on March 23rd.

QWhat action did United Airlines take in response to the surge in jet fuel prices, and what was the cited potential annual cost increase?

AUnited Airlines announced it would cut its capacity by 5% in the second and third quarters. The company stated that if oil prices reached $175 a barrel, its annual fuel cost would increase by approximately $11 billion.

QWhat major sanction policy change did the Trump administration announce on March 12th regarding Russian oil, and when was it set to expire?

AThe Trump administration announced a 30-day sanctions exemption allowing countries to purchase Russian oil that was already in transit. This exemption was set to expire on April 11th.

Пов'язані матеріали

Playnance’s $GCOIN Lists on KoinBX Amid Rapid Growth in India

Playnance's native token, $GCOIN, has been listed on the cryptocurrency exchange KoinBX as of June 18. This move aims to enhance accessibility for its rapidly growing community, particularly in India, where the blockchain-powered Web3 iGaming ecosystem has gained significant traction. Over 130 partners in Playnance's "Be the Boss" program have built communities engaging thousands of active players in the region. The "Be the Boss" model allows participants to create and manage their own gaming communities, earning rewards tied to community activity. CEO Pini Peter noted India's high engagement, with community leaders successfully building player networks. One partner, Dr. Nicolas, reported earning over $57,000 through the program in recent months, highlighting both the financial rewards and the opportunity to grow an engaged community. $GCOIN serves as the ecosystem's core utility token, incentivizing participation and aligning the interests of players and community leaders ("Bosses"). The listing on KoinBX is part of Playnance's strategy to expand globally, increasing the token's utility and accessibility by combining community ownership, gamified engagement, and blockchain-based incentives. Founded in 2020, Playnance is a Web3 iGaming infrastructure company focused on creating live, non-custodial, on-chain products to onboard mainstream users. It currently processes approximately one million transactions daily, aiming to simplify the user experience while maintaining full on-chain transparency.

TheNewsCrypto18 хв тому

Playnance’s $GCOIN Lists on KoinBX Amid Rapid Growth in India

TheNewsCrypto18 хв тому

STRC Hits Historic Low, Saylor's Perpetual Motion Machine Grinds to a Halt

STRC, the perpetual preferred stock issued by MicroStrategy to fund its Bitcoin purchases, hit a historic low of $85.32, a 17% discount to its $100 par value. Designed as a "digital credit engine" to trade stably near par and enable continuous share issuance for buying Bitcoin, its plunge signals a breakdown in this model. Three key factors drove the decline: 1. Bitcoin's price fell over 50% from its peak, trading around $63,000 amid hawkish Fed signals. 2. MicroStrategy's cash reserves were depleted after a $1.5 billion convertible note repayment, slashing the dividend coverage for STRC's 11.5% yield to ~7 months. The company then sold 32 BTC to cover dividends—Michael Saylor's first Bitcoin sale since 2022—damaging the "never sell" narrative. 3. A competing Bitcoin-backed preferred stock, Strive's SATA, offers a higher yield (~13%) and daily dividends, drawing investors away from STRC. The drop triggers a negative cycle: STRC below par halts ATM share issuances, cutting off a key funding source for Bitcoin buys and potentially forcing more BTC sales for dividends, further eroding confidence. While Saylor argues the model is mathematically sound—needing only 2.3% annual Bitcoin growth to sustain itself—the market is testing the resilience of the leveraged Bitcoin treasury strategy in a bear market. The STRC price now reflects rising skepticism about this financial machinery's durability during downturns.

marsbit38 хв тому

STRC Hits Historic Low, Saylor's Perpetual Motion Machine Grinds to a Halt

marsbit38 хв тому

A Guide to Grayscale’s ‘Bottom Fishing’: Using Cash Flow to Assess Cryptocurrency Value

**Title:** Grayscale's Guide to Bottom-Fishing: Valuing Cryptoassets Using Cash Flows **Summary:** This report by Grayscale Research presents a fundamental valuation framework for cryptocurrency assets, moving beyond pure speculation to analyze those with underlying cash flows. It distinguishes between "commodity-like" assets (e.g., Bitcoin) and "cash-flow" assets, primarily within DeFi. Using the leading decentralized lending protocol Aave as a case study, the analysis applies traditional financial methodologies like Discounted Cash Flow (DCF) and Price-to-Earnings (P/E) multiples. Key findings indicate that AAVE tokens are currently undervalued. Despite recent challenges, the protocol's strong revenue growth, ~50% net profit margin, and diversified treasury support a fundamental valuation range of $80-$100 per token (compared to a ~$75 market price at the time of writing). In a base-case scenario driven by stablecoin adoption and regulatory clarity, the fair value could rise to around $175 within a year. The report emphasizes that protocol success does not automatically translate to token value. It critically examines the "value capture" mechanisms—such as buybacks, burns, and staking rewards—that channel protocol profits to token holders. Furthermore, it addresses the legal and governance complexities of Decentralized Autonomous Organizations (DAOs), noting their difference from traditional corporate equity but highlighting how robust, transparent governance can align protocol economics with holder interests. The conclusion is that the crypto market is maturing, with capital increasingly flowing towards projects with demonstrable fundamentals, real adoption, and disciplined capital allocation, creating opportunities for value-based investors.

marsbit1 год тому

A Guide to Grayscale’s ‘Bottom Fishing’: Using Cash Flow to Assess Cryptocurrency Value

marsbit1 год тому

After semiconductors lead the gains, are funds buying into AI orders or a macroeconomic rebound?

After US-Iran talks led to a temporary ceasefire and framework for reopening the strategic Strait of Hormuz, U.S. stocks rose on June 18, with the Nasdaq gaining 1.9%. The semiconductor and AI hardware sectors outperformed. This rally stemmed primarily from reduced geopolitical risk, which lowered oil prices and inflation expectations, easing discount rate pressure on high-valuation growth stocks like tech. The key question is not whether tech rebounded, but the nature of the rebound. The market appears to be selectively repricing AI infrastructure plays rather than broadly chasing AI narratives. Gains were concentrated in chips, optical interconnects, memory, and domestic manufacturing—segments tied to tangible data center build-outs and capital expenditure. Intel's ~10% surge, fueled by a Trump statement about potential Apple collaboration, exemplifies this mixed dynamic. It reflects policy catalysts and domestic manufacturing sentiment more than confirmed fundamentals. Meanwhile, strong earnings from companies like Astera Labs (revenue up 93% YoY) provided concrete evidence of AI-driven demand in hardware. In essence, the rally represents a risk-premium recalibration. Lower Middle East tensions opened a valuation repair window, and capital flowed first into AI infrastructure segments with visible near-term revenue streams. The sustainability of this move hinges on upcoming Q2 earnings, specifically continued strength in cloud provider capex, AI server orders, and hardware company guidance. Policy hopes alone are insufficient; the cycle needs validation from orders and financials.

marsbit1 год тому

After semiconductors lead the gains, are funds buying into AI orders or a macroeconomic rebound?

marsbit1 год тому

Торгівля

Спот
Ф'ючерси

Популярні статті

Як купити WAR

Ласкаво просимо до HTX.com! Ми зробили покупку WAR (WAR) простою та зручною. Дотримуйтесь нашої покрокової інструкції, щоб розпочати свою криптовалютну подорож.Крок 1: Створіть обліковий запис на HTXВикористовуйте свою електронну пошту або номер телефону, щоб зареєструвати обліковий запис на HTX безплатно. Пройдіть безпроблемну реєстрацію й отримайте доступ до всіх функцій.ЗареєструватисьКрок 2: Перейдіть до розділу Купити крипту і виберіть спосіб оплатиКредитна/дебетова картка: використовуйте вашу картку Visa або Mastercard, щоб миттєво купити WAR (WAR).Баланс: використовуйте кошти з балансу вашого рахунку HTX для безперешкодної торгівлі.Треті особи: ми додали популярні способи оплати, такі як Google Pay та Apple Pay, щоб підвищити зручність.P2P: Торгуйте безпосередньо з іншими користувачами на HTX.Позабіржова торгівля (OTC): ми пропонуємо індивідуальні послуги та конкурентні обмінні курси для трейдерів.Крок 3: Зберігайте свої WAR (WAR)Після придбання WAR (WAR) збережіть його у своєму обліковому записі на HTX. Крім того, ви можете відправити його в інше місце за допомогою блокчейн-переказу або використовувати його для торгівлі іншими криптовалютами.Крок 4: Торгівля WAR (WAR)Легко торгуйте WAR (WAR) на спотовому ринку HTX. Просто увійдіть до свого облікового запису, виберіть торгову пару, укладайте угоди та спостерігайте за ними в режимі реального часу. Ми пропонуємо зручний досвід як для початківців, так і для досвідчених трейдерів.

267 переглядів усьогоОпубліковано 2024.12.11Оновлено 2026.06.02

Як купити WAR

Обговорення

Ласкаво просимо до спільноти HTX. Тут ви можете бути в курсі останніх подій розвитку платформи та отримати доступ до професійної ринкової інформації. Нижче представлені думки користувачів щодо ціни WAR (WAR).

活动图片