On-Chain Metrics Practical Guide: Identifying Real Signals, Avoiding Data Traps

比推Опубліковано о 2025-12-25Востаннє оновлено о 2025-12-25

Анотація

A practical guide to on-chain metrics for traders, focusing on identifying genuine signals and avoiding data traps. Key concepts include distinguishing between transaction fees (user-paid costs), protocol revenue (actual earnings), and MEV (maximal extractable value), emphasizing that sustainable revenue matters more than high fees. Total Value Locked (TVL) is often misleading due to double-counting, incentive-driven "mercenary capital," and idle stablecoins. Traders should analyze TVL alongside transaction volume and incentives. Daily Active Addresses (DAA) can be inflated by bots and airdrop farmers; it’s only meaningful when correlated with fees and real activity. Cross-chain bridges enable asset transfers but carry risks like smart contract vulnerabilities and centralization. Monitor bridge volumes for liquidity flow insights. Stablecoin supply acts as crypto’s money supply (M2); increasing supply suggests market liquidity, while decreases may signal withdrawals. Token unlocks and emissions create sell pressure; avoid tokens nearing large unlocks unless trading short-term. The ratio of transaction volume to TVL indicates capital efficiency—high ratios reflect active usage, while low ratios suggest "ghost liquidity." In summary, on-chain metrics are analytical tools, not absolute truths. Cross-verify signals and interpret data contextually for informed decisions.

Written by: Dami-Defi

Compiled by: AididaoJP, Foresight News

Original title: A Practical Guide to On-Chain Metrics for Traders


On-chain metrics are something everyone talks about, but few truly understand. This guide will explain their true meaning in a simple and clear way, and how traders should use them.

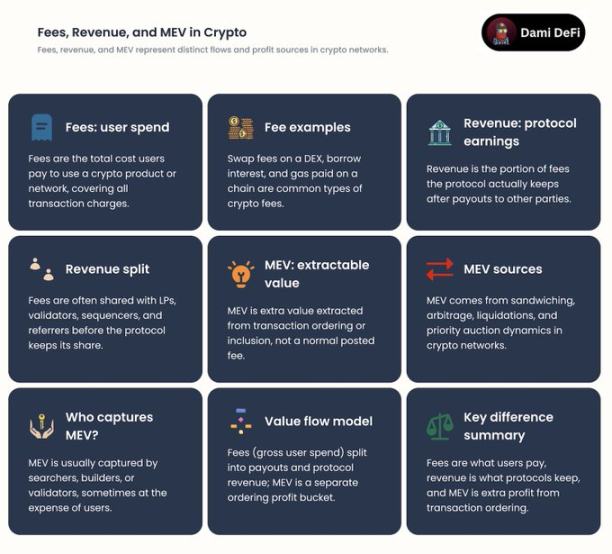
Fees vs. Revenue vs. MEV: The Real Earnings of a Chain

First, clarify a few concepts:

  • Fees: The cost users pay to conduct transactions.

  • Revenue: The portion ultimately kept by the protocol or validators.

MEV (Maximal Extractable Value): Additional profit validators gain by optimizing transaction ordering.

Key Point: High fees do not equal success. The real key is sustainable revenue. If users are driven away by $50 fees, this model is difficult to sustain.

Trader's Perspective:

Focus on public chains where real revenue is growing and the token model is reasonable. Models overly reliant on MEV are fragile; once trading volume declines or competition intensifies, prosperity can quickly fade.
TVL: The Three "Lies" of Total Value Locked

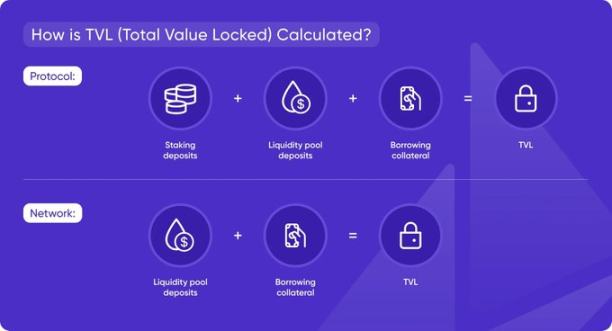
Total Value Locked represents the total capital locked in a protocol or chain. It shows market trust but can also be very misleading.

The Three "Lies" of TVL:

  • Double Counting: The same capital is collateralized across different protocols, inflating the total.

  • Incentive-Driven TVL: "Mercenary capital" arrives for short-term incentives and leaves quickly once rewards end.

  • Idle Stablecoins: Large amounts of funds sit in wallets, counted in TVL but never used.

Trader's Perspective:

Never look at TVL alone; it must be analyzed alongside trading volume and incentive programs. Real usage is far more important than vanity metrics.
DAA / Daily Active Addresses: Real Users or Market Noise?

Daily Active Addresses count the number of addresses that have performed operations on the chain. It is often used as a proxy for real users but is also easily manipulated.

Common Issues:

  • Bulk operations by bots.

  • Airdrop farmers creating massive numbers of addresses.

  • Protocol internal transfers inflating data.

Key Point: DAA is meaningful only when it grows in sync with fees, trading volume, and real activity. If the number of addresses surges while revenue stagnates, it's likely a manufactured metric.

Trader's Perspective:

Treat DAA as a secondary confirmation signal, not a primary buy indicator. It only serves to validate growth when supported by other fundamentals.
Cross-Chain Bridges: How Funds Move Across Chains and Where the Risks Lie

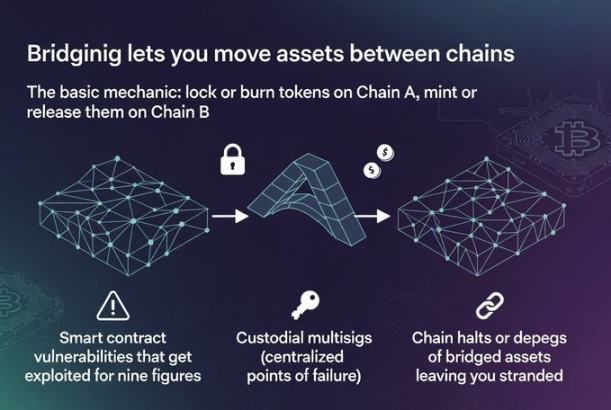
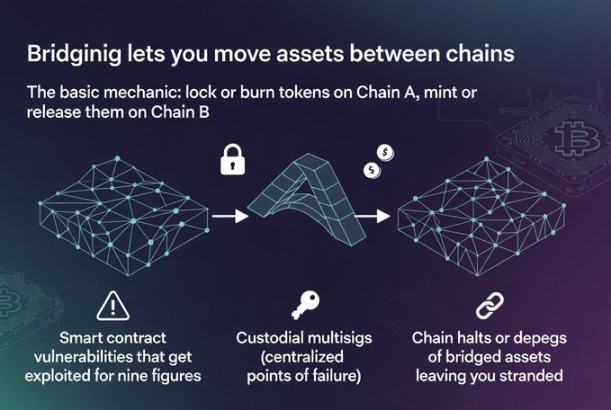
Cross-chain bridges enable the transfer of assets between different blockchains. The basic principle is: lock or burn tokens on Chain A, mint or release an equivalent amount on Chain B. The concept is simple, but the risks are complex.

Main Risks:

  • Smart Contract Vulnerabilities: Can lead to huge financial losses.

  • Custodial Multi-Sigs: Represent centralized points of failure.

  • Chain Outages or Asset De-pegging: Can result in assets being trapped.

Trader's Perspective:

Avoid storing large amounts of funds long-term on higher-risk cross-chain bridges. However, monitor the trading volume of bridges as a leading indicator of capital flow. For example, funds moving from Ethereum to an L2, or migrating between different ecosystems, signal changes that may present trading opportunities.
Stablecoins: The Money Supply of the Crypto World

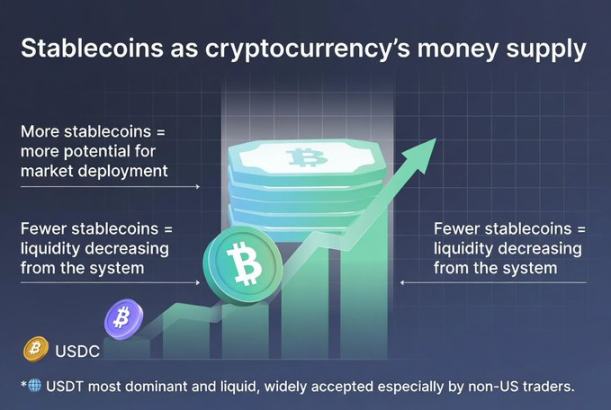
Stablecoin supply is equivalent to the broad money supply (M2) of the crypto world.

  • Supply Increase: Means more "ammunition" waiting to enter the market.

  • Supply Decrease: Indicates liquidity is withdrawing.

Market Status:

USDT dominates due to its high liquidity and wide acceptance (especially favored by non-US traders). USDC is more transparent and compliant but has a slightly narrower usage.

Trader's Perspective:

A rising total stablecoin supply generally supports larger market trends; a shrinking supply means tightening liquidity, which can curb rallies. This is a crucial reference indicator for macro positioning.
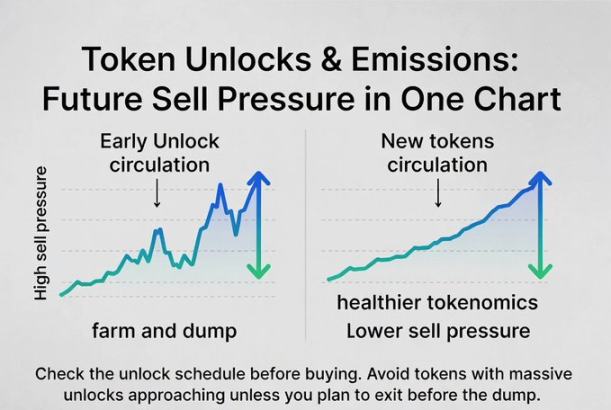
Token Unlocks & Emissions: Future Selling Pressure

Unlocks and emissions mean new tokens entering the circulating market. Large-scale unlocks are often accompanied by automatic selling: teams cashing out, VCs reducing holdings, reward releases causing a supply surge.

Simple Judgment:

  • Early, High Unlocks: Often indicate a "farm-and-dump" model.

  • Long-term, Gradual Unlocks + Real Demand: Typically represent healthier tokenomics.

Trader's Perspective:

Always check the unlock schedule before buying. Avoid tokens nearing large unlocks, unless you are trading short-term and plan to exit before the selling pressure hits.
On-Chain Volume vs. TVL: Is the Capital Active or Dormant?

  • TVL: How much capital is deposited.

  • Volume: How frequently the capital moves.

A pool with a TVL of $100 million but a daily volume of only $5,000 is essentially "dead capital".

Key Ratio: Volume / TVL Ratio.

  • High Ratio: Capital is active, usage is high.

  • Low Ratio: Could be "ghost liquidity" or idle funds.

Trader's Perspective:

Look for protocols with solid TVL and strong trading volume. You need real usage, not fake prosperity.

Summary

On-chain metrics are not magic, but they are the closest thing to "financial statements" in the crypto world. Use them as analytical tools, not absolute truths. Always cross-verify multiple signals and constantly think about the real meaning behind the data.


Twitter:https://twitter.com/BitpushNewsCN

Bitpush TG Discussion Group:https://t.me/BitPushCommunity

Bitpush TG Subscription: https://t.me/bitpush

Original link:https://www.bitpush.news/articles/7598316

Трендові криптовалюти

Пов'язані питання

QWhat is the key difference between 'fees' and 'revenue' in the context, and why is it important for traders?

AFees are what users pay to conduct transactions, while revenue is the portion that the protocol or validators ultimately keep. The key point is that high fees do not equal success; the true focus should be on sustainable revenue. This is crucial for traders because a model that drives users away with high fees (e.g., $50) is not sustainable in the long run.

QWhat are the three main 'lies' or misleading aspects of Total Value Locked (TVL) as discussed in the guide?

AThe three main misleading aspects of TVL are: 1. Double-counting, where the same capital is collateralized across different protocols, inflating the total. 2. Incentive-driven TVL, where 'mercenary capital' arrives for short-term rewards and leaves quickly afterward. 3. Idle stablecoins, where large amounts of capital are held in wallets, counted in TVL, but never actually used.

QWhy should traders be cautious about relying solely on Daily Active Addresses (DAA) as a metric?

ATraders should be cautious because DAA can be easily manipulated by bots performing bulk operations, airdrop farmers creating massive numbers of addresses, and internal protocol transfers inflating the data. DAA is only meaningful when it grows in sync with other fundamentals like fees, transaction volume, and real activity. It should be used as a secondary confirmation signal, not a primary buy indicator.

QAccording to the guide, what does the stablecoin supply represent in the crypto ecosystem, and how should traders interpret changes in it?

AThe stablecoin supply represents the broad money supply (M2) of the crypto world. An increase in supply means there is more 'ammunition' waiting to enter the market, typically supporting larger market trends. A decrease indicates that liquidity is being withdrawn, which can suppress price increases. This is an important macro indicator for traders to consider for overall market positioning.

QWhat is the significance of the 'Volume/TVL Ratio' for a protocol, and what does it indicate to a trader?

AThe Volume/TVL Ratio measures how actively the locked capital is being used. A high ratio indicates that the capital is active and being used efficiently. A low ratio suggests the presence of 'ghost liquidity' or idle funds, like a pool with high TVL but very low daily volume. Traders should look for protocols with solid TVL and strong transaction volume, as this indicates real usage rather than false prosperity.

Пов'язані матеріали

From Gold to Bitcoin: Fixed Supply + Institutional Frenzy, Might It Repeat the 'Explosive' Price Trend?

"From Gold to Bitcoin: Fixed Supply and Institutional Frenzy May Lead to 'Explosive' Price Rally Analysts suggest Bitcoin's price action could mirror gold's over the past two decades, following the launch of spot Bitcoin ETFs. Gold ETFs, introduced in 2004, drove gold's price surge to a current market cap near $28 trillion. Both gold and Bitcoin are non-yielding stores of value, with prices driven purely by investor sentiment rather than cash flows or credit. Gold ETFs experienced dramatic cycles: explosive growth, painful drawdowns, and slow recoveries, with each cycle reaching higher peaks. Bitcoin ETFs, approved in early 2024, saw rapid institutional adoption but are now facing similar volatility. Recent warnings highlight the risk of significant ETF outflows disrupting the current rebound. BlackRock's IBIT, a leading Bitcoin ETF, has sold nearly 100,000 BTC to meet redemptions while still holding over 733,000. The core parallel is fixed supply: when demand surges, prices explode, but demand is often volatile and wave-like, not steady. Institutional interest, through ETFs and corporate adoption, remains a key support pillar, helping to cushion sell-offs. If Bitcoin captures even a fraction of gold's role as a store of value, its upside potential is immense, though the path will be marked by high volatility. For investors, focusing on long-term trends and managing risk is crucial as this 'price explosion' narrative unfolds."

Foresight News3 хв тому

From Gold to Bitcoin: Fixed Supply + Institutional Frenzy, Might It Repeat the 'Explosive' Price Trend?

Foresight News3 хв тому

Why Is AI Agent Shopping Hard to Popularize?

The article argues that the popular narrative of "AI agent shopping" – equipping AI with a wallet to autonomously handle purchases – is fundamentally flawed and oversimplifies the complexity of shopping. It deconstructs shopping into two core actions: **information retrieval** (standardized, easily automated) and **value judgment** (deeply subjective and human-centric). The narrative mistakenly assumes AI can fully handle both. Value judgment itself has two layers: **evaluation** (assessing options against criteria) and **demand definition** (setting the criteria, weights, and values). The latter is inherently human and dynamic, as preferences are not fixed but constructed during the decision-making process ("constructive preferences"). The real dividing line for automation is not product standardization, but whether the **act of choosing** itself holds experiential value. For mundane purchases (e.g., printer paper), full AI delegation works. For experiential goods (e.g., wine, furniture), the joy of selection is core to consumption, so AI should act as an assistant that narrows options, leaving the final choice to humans. The "AI wallet" concept confuses three separate elements: decision-making, execution, and fund custody. Current payment industry solutions (e.g., from Stripe, Mastercard, Google, Visa) show that limited, scoped payment authorization tokens are sufficient for most consumer scenarios, not full fund custody. The true use case for autonomous AI wallets is in **B2B procurement** and **machine-to-machine (M2M) settlements** for standardized, high-frequency, low-value transactions. The real bottlenecks for AI shopping are not payment technology, but **1) the lack of trusted data sources** (e.g., fake reviews, counterfeit goods) and **2) the impossibility of automating human demand definition**. The conclusion is that the focus should be on safely automating the assessment and filtering process while reserving for humans the rights to define their criteria and enjoy the final act of choice. For experiential goods, the platform's competitive advantage shifts to providing a superior selection experience.

Foresight News1 год тому

Why Is AI Agent Shopping Hard to Popularize?

Foresight News1 год тому

After Nine Months of Shorting, a Full Turn to Long: Renowned Trader Opens Bitcoin Positions Around 64K, Crypto Market Long-Short Divergence Intensifies

After nine months of being short, prominent crypto trader Doctor Profit has closed all his bearish positions and started buying Bitcoin near $64,000, signaling a complete bullish reversal. He argues that structural market changes—such as impending U.S. regulation (CLARITY Act) and institutional adoption via securities tokenization—are rewriting the traditional four-year cycle script, potentially bringing the market bottom forward from the widely expected September/October timeframe. This view finds some technical support from on-chain analyst gumsays, who notes a bullish divergence on Bitcoin's weekly chart has persisted for 147 days, nearing the 161-day duration seen before the 2022 cycle low. However, cycle researcher Jake Pahor presents a counter-argument based on historical data. Analyzing patterns since 2014, he identifies three common features of past bear market bottoms: a ~12-month duration from peak to trough, a sustained period of extreme fear (with a proprietary risk score below 20), and the price falling below Bitcoin's realized price (~$53,000 currently). The current cycle, only nine months from its October 2025 peak, meets none of these conditions. The debate highlights a market torn between "front-running" a potential early bottom driven by new fundamentals and waiting for confirmation through traditional on-chain and sentiment metrics. While Doctor Profit opts for aggressive buying, Pahor maintains a disciplined, tiered accumulation strategy, continuing weekly buys at current risk levels but reserving larger orders for if more extreme fear emerges.

marsbit1 год тому

After Nine Months of Shorting, a Full Turn to Long: Renowned Trader Opens Bitcoin Positions Around 64K, Crypto Market Long-Short Divergence Intensifies

marsbit1 год тому

Senior Trader's Confession: How to Trade Market's False Expectations?

Veteran trader's case study: trading the market's "wrong expectations". This trade centered on a textbook "expectation error" after a weak CPI report. While the market initially priced in broad monetary easing (sending Nasdaq to 30,060), the crucial 30-year real yield hit a 20-year high. This signaled a fractured transmission mechanism: short-term rates eased, but long-term funding costs (vital for tech valuations) refused to fall. The trader executed five short positions on the Nasdaq (NQ) as it fell from 30,060 to 28,768. The core methodology: don't just trade the data, but analyze the market's implied causal chain and identify where it breaks. In this case, the chain was: Weak CPI → Policy Easing → Lower Long-Term Funding Costs → NQ Valuation Expansion. The break occurred between policy easing and long-term rates. The "veto variable" – long-term real yields – refused to confirm the bullish narrative. Trades were structured around "fast variables" (price) temporarily repairing while "slow variables" (funding conditions) remained broken. The article outlines a repeatable framework: 1) Map the market's implied causal chain. 2) Identify the veto variable. 3) Observe if it rejects the narrative. 4) Enter when price still follows the old script. 5) Choose the cleanest asset expression (e.g., short NQ, not broad S&P). 6) Define both invalidation and fulfillment exit conditions. The key insight: Alpha often comes not from an information edge, but from a "reaction function edge" – recognizing when the market is applying an outdated causal logic to new data. The critical question: What causal chain is the market's first reaction relying on, and is that chain still valid today?

marsbit1 год тому

Senior Trader's Confession: How to Trade Market's False Expectations?

marsbit1 год тому

Торгівля

Спот

Популярні статті

Як купити O

Ласкаво просимо до HTX.com! Ми зробили покупку O1 exchange (O) простою та зручною. Дотримуйтесь нашої покрокової інструкції, щоб розпочати свою криптовалютну подорож.Крок 1: Створіть обліковий запис на HTXВикористовуйте свою електронну пошту або номер телефону, щоб зареєструвати обліковий запис на HTX безплатно. Пройдіть безпроблемну реєстрацію й отримайте доступ до всіх функцій.ЗареєструватисьКрок 2: Перейдіть до розділу Купити крипту і виберіть спосіб оплатиКредитна/дебетова картка: використовуйте вашу картку Visa або Mastercard, щоб миттєво купити O1 exchange (O).Баланс: використовуйте кошти з балансу вашого рахунку HTX для безперешкодної торгівлі.Треті особи: ми додали популярні способи оплати, такі як Google Pay та Apple Pay, щоб підвищити зручність.P2P: Торгуйте безпосередньо з іншими користувачами на HTX.Позабіржова торгівля (OTC): ми пропонуємо індивідуальні послуги та конкурентні обмінні курси для трейдерів.Крок 3: Зберігайте свої O1 exchange (O)Після придбання O1 exchange (O) збережіть його у своєму обліковому записі на HTX. Крім того, ви можете відправити його в інше місце за допомогою блокчейн-переказу або використовувати його для торгівлі іншими криптовалютами.Крок 4: Торгівля O1 exchange (O)Легко торгуйте O1 exchange (O) на спотовому ринку HTX. Просто увійдіть до свого облікового запису, виберіть торгову пару, укладайте угоди та спостерігайте за ними в режимі реального часу. Ми пропонуємо зручний досвід як для початківців, так і для досвідчених трейдерів.

154 переглядів усьогоОпубліковано 2026.06.19Оновлено 2026.06.19

Як купити O

Як купити PROS

Ласкаво просимо до HTX.com! Ми зробили покупку Pharos (PROS) простою та зручною. Дотримуйтесь нашої покрокової інструкції, щоб розпочати свою криптовалютну подорож.Крок 1: Створіть обліковий запис на HTXВикористовуйте свою електронну пошту або номер телефону, щоб зареєструвати обліковий запис на HTX безплатно. Пройдіть безпроблемну реєстрацію й отримайте доступ до всіх функцій.ЗареєструватисьКрок 2: Перейдіть до розділу Купити крипту і виберіть спосіб оплатиКредитна/дебетова картка: використовуйте вашу картку Visa або Mastercard, щоб миттєво купити Pharos (PROS).Баланс: використовуйте кошти з балансу вашого рахунку HTX для безперешкодної торгівлі.Треті особи: ми додали популярні способи оплати, такі як Google Pay та Apple Pay, щоб підвищити зручність.P2P: Торгуйте безпосередньо з іншими користувачами на HTX.Позабіржова торгівля (OTC): ми пропонуємо індивідуальні послуги та конкурентні обмінні курси для трейдерів.Крок 3: Зберігайте свої Pharos (PROS)Після придбання Pharos (PROS) збережіть його у своєму обліковому записі на HTX. Крім того, ви можете відправити його в інше місце за допомогою блокчейн-переказу або використовувати його для торгівлі іншими криптовалютами.Крок 4: Торгівля Pharos (PROS)Легко торгуйте Pharos (PROS) на спотовому ринку HTX. Просто увійдіть до свого облікового запису, виберіть торгову пару, укладайте угоди та спостерігайте за ними в режимі реального часу. Ми пропонуємо зручний досвід як для початківців, так і для досвідчених трейдерів.

196 переглядів усьогоОпубліковано 2026.06.22Оновлено 2026.06.22

Як купити PROS

Що таке VERONA

I. Вступ до проекту VERONA - це блокчейн, створений для всіх, скрізь, через абстракцію ланцюга. Використовуючи свій загальний шар абстракції, VERONA вирізняється інтеграцією складних функцій блокчейну, таких як рахунки, підписи та взаємодія, безпосередньо на рівні протоколу. Цей підхід дозволяє взаємодіяти з блокчейн-додатками без необхідності розуміти основні технології.1) Основна інформація Назва: VERONA (VERONA)III. Пов'язані посилання Офіційне посилання на сайт: https://xion.burnt.com/ Біла книга: https://xion.burnt.com/whitepaper.pdf Експлорери: https://explorer.burnt.com/ Соціальні мережі: https://x.com/burnt_xion Примітка: Вступ до проекту взято з матеріалів, опублікованих або наданих офіційною командою проекту, які є лише для довідки і не є інвестиційною порадою. HTX не несе відповідальності за будь-які прямі або непрямі збитки, що виникають внаслідок цього.

133 переглядів усьогоОпубліковано 2026.06.22Оновлено 2026.06.22

Що таке VERONA

Обговорення

Ласкаво просимо до спільноти HTX. Тут ви можете бути в курсі останніх подій розвитку платформи та отримати доступ до професійної ринкової інформації. Нижче представлені думки користувачів щодо ціни A (A).

活动图片