Author: Too Happy Tyler
A couple of days ago, in the article "I Built an Investment Workstation for Myself Using AI," I shared several tools I coded: a cross-market asset dashboard, an investment map, a personal content operations console, and a Polymarket betting monitoring dashboard that I've been using frequently lately.
Over the past half month, I used about $1600 in principal for real-world testing and generated over 30% return. The real-time statistics on the dashboard and the final actual net profit basically matched, with only a discrepancy of around $6, which was due to small errors like limit orders/liquidity rewards and such.
But what I actually want to say in this article is not "Polymarket is great for making money," and I certainly don't want to package it as some arbitrage tutorial.
On the contrary, after running through this round, I increasingly feel that Polymarket is not a place suitable for charging in with the notion of 'arbitrage' in mind.
1. First, let's talk about what this dashboard is about
I started manually building this dashboard around May 21.
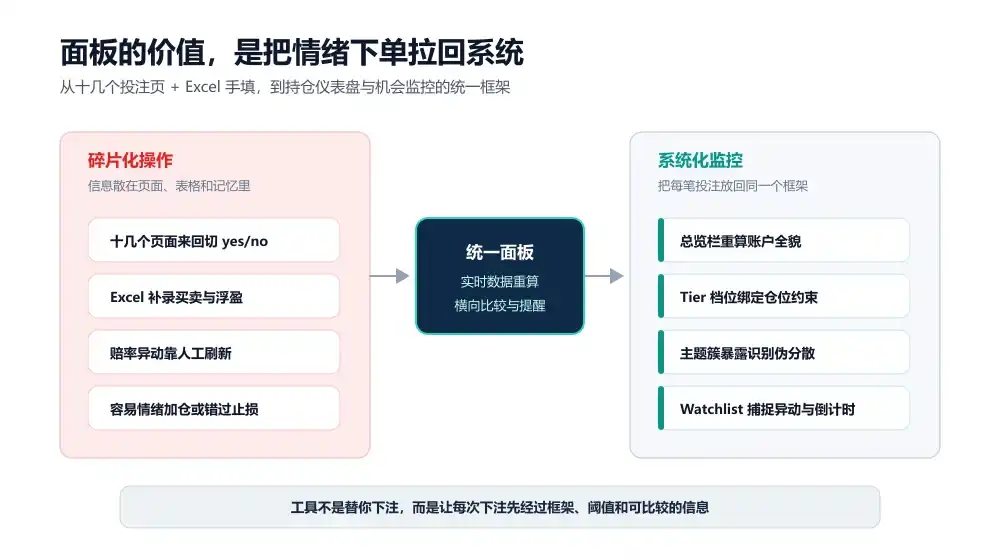
The initial need was simple: I didn't want to open a dozen betting pages each time and switch back and forth between yes/no price changes, and I also didn't want to manually record everything in Excel anymore.
Yes, before this, I was using Excel to record buys/sells, floating P&L, settlement dates, event types—the clumsy method for a clumsy person.
But as those who have actually played on it know, many bets on Polymarket are extremely prone to getting out of control precisely because manual recording methods are functionally poor. For example, you might initially just want to buy a little, but when the odds move, you might want to add more, given the lack of an intuitive feel. Or, if a specific betting event suddenly moves and you don't update the spreadsheet data in time, it's easy to miss the window for stop-loss/adding positions, and so on.
Ultimately, the whole process is too fragmented. Without a system, it's easy for people to rely on emotions to place orders.
So from the start of building this dashboard, my goal was to place every bet back into a unified framework, turning that feeling into a relatively visualizable and horizontally comparable information presentation.
After several iterations, I split it into two tabs: "Portfolio Dashboard" + "Opportunity Monitor."
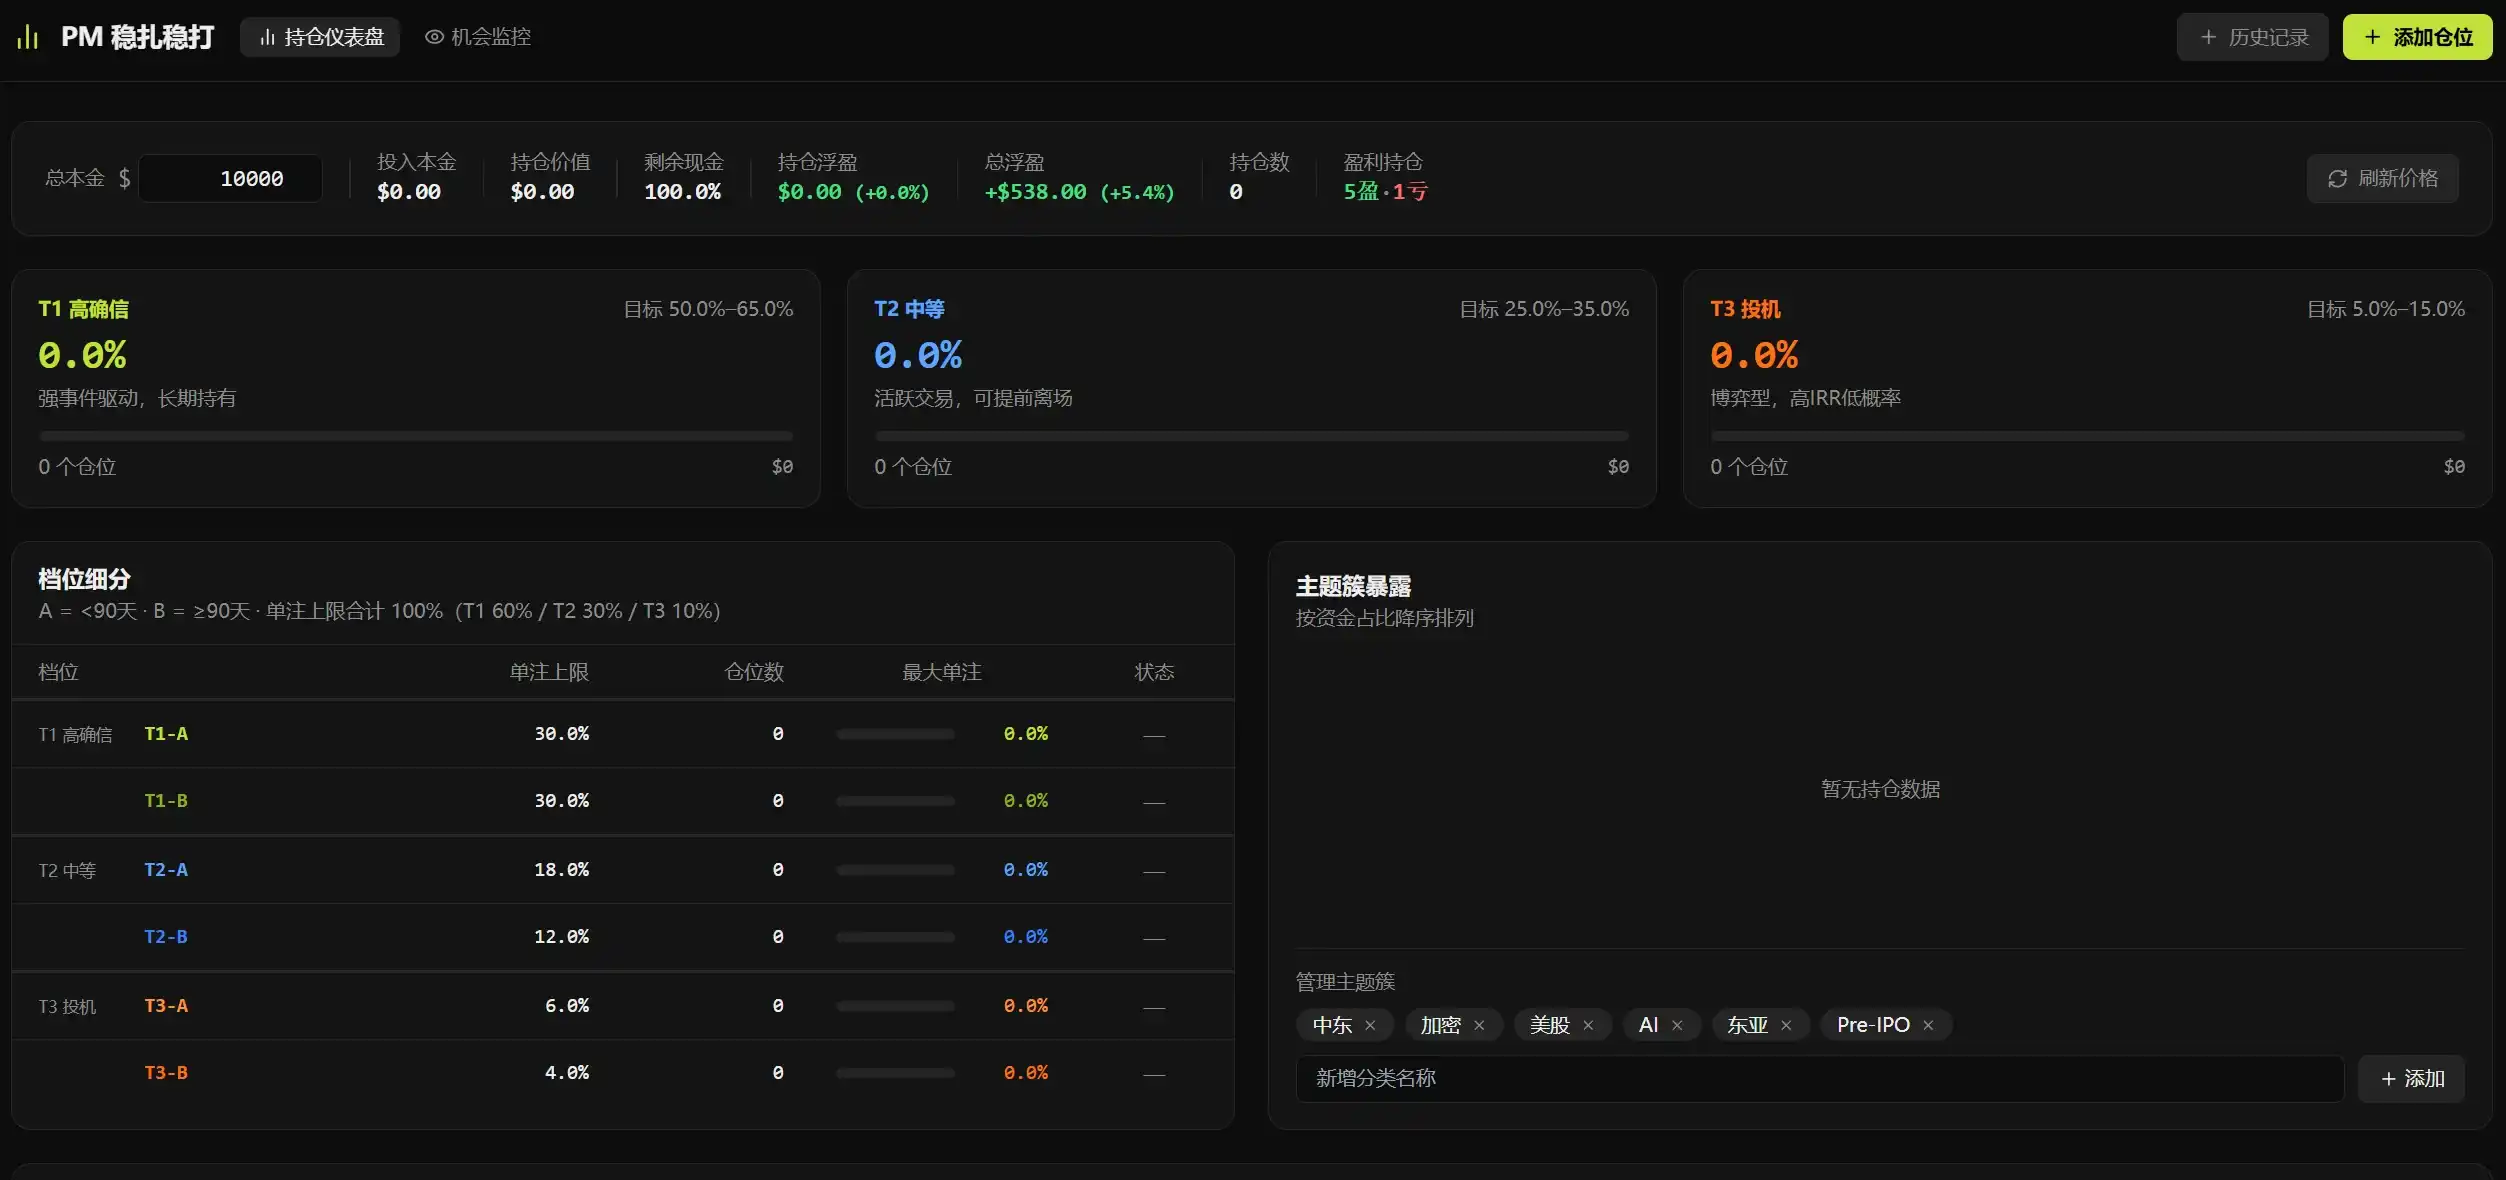
"Portfolio Dashboard" is the core of the entire panel, a dynamic system that can fetch PM's real-time data and recalculate. It's divided into several functional areas (you can refer to the image at the beginning of the article):
- Overview Bar: Total principal (planned, actual reference is minimal), invested principal, portfolio value, portfolio floating P&L, total floating P&L (including closed positions)—a quick glance at the full account picture.
- Tier Allocation: This is the core risk management module of the dashboard, and in my opinion, the most counterintuitive yet important area. I'll keep you in suspense and explain it in detail in the next section.
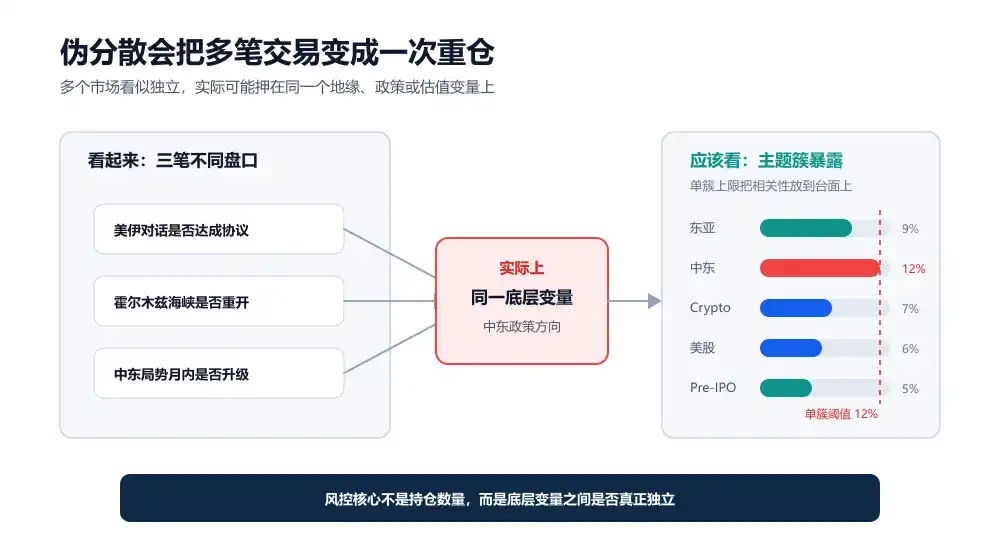
- Theme Cluster Exposure: I tagged each bet with a "Theme Cluster" label, categorized into East Asia, Middle East, Crypto, US Stocks, Pre-IPO (customizable, can add/delete). The dashboard automatically aggregates the proportion of each cluster and sets a 12% single-cluster upper limit threshold. Why design it this way? Mainly to combat the most hidden trap on PM—pseudo-diversification. More on that later.
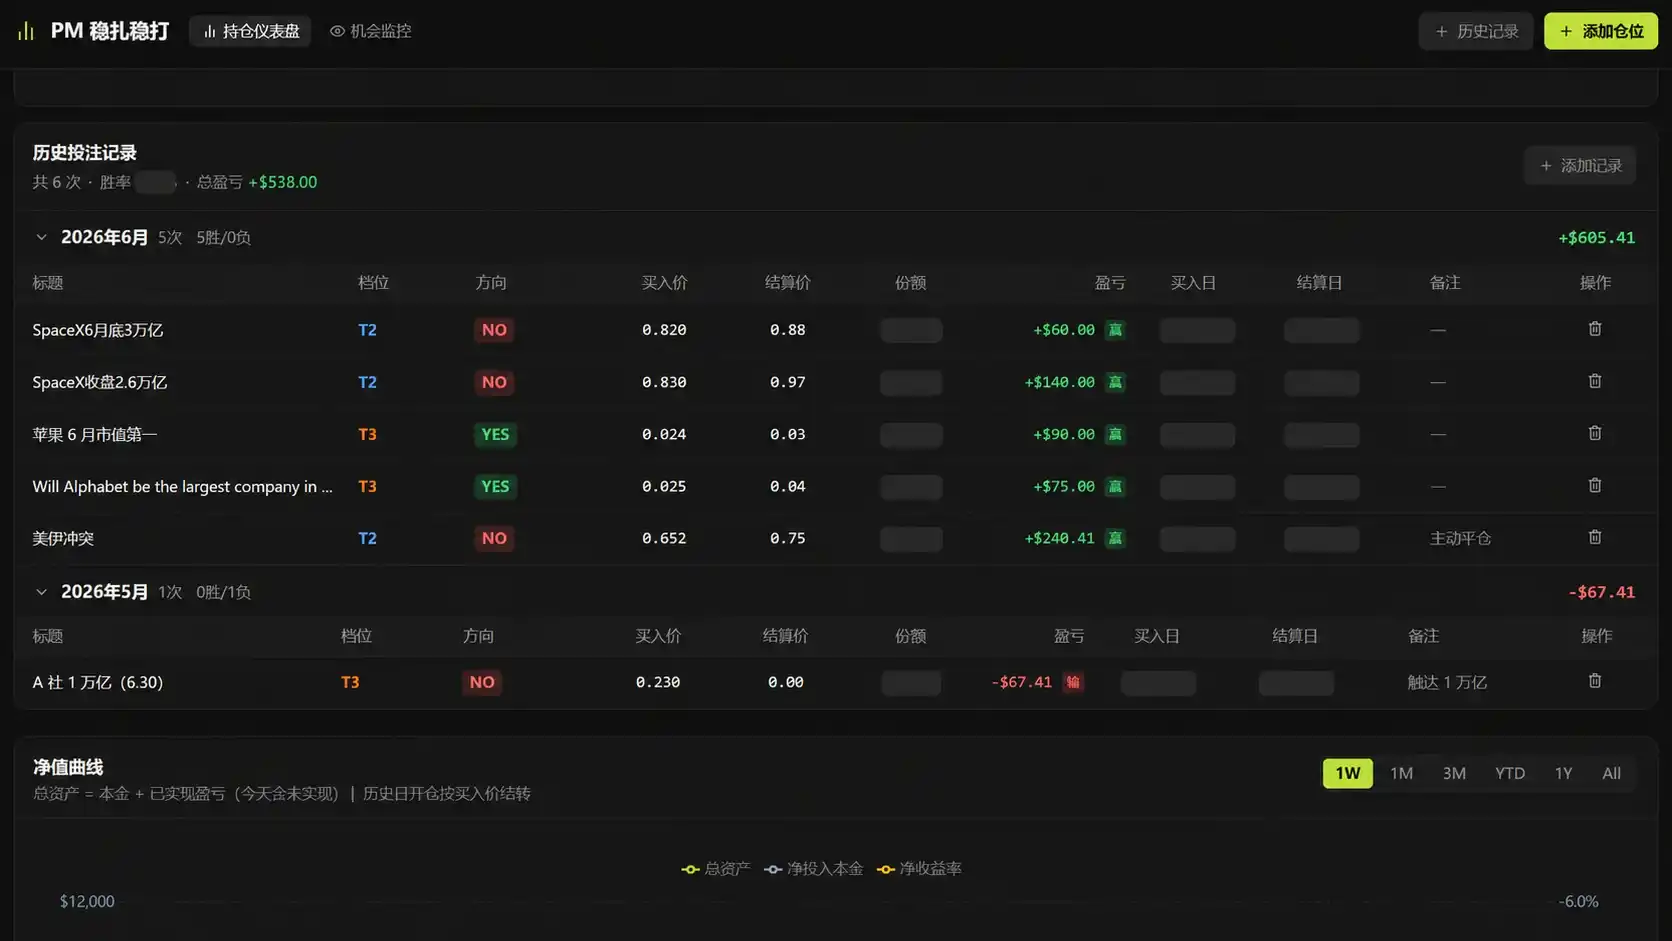
- Single Position Details: Tier, direction (yes/no), buy price, settlement price, shares, profit/loss, buy date, settlement date, notes, etc. Each line is clear at a glance, and it supports sorting ascending/descending and filtering by tags.
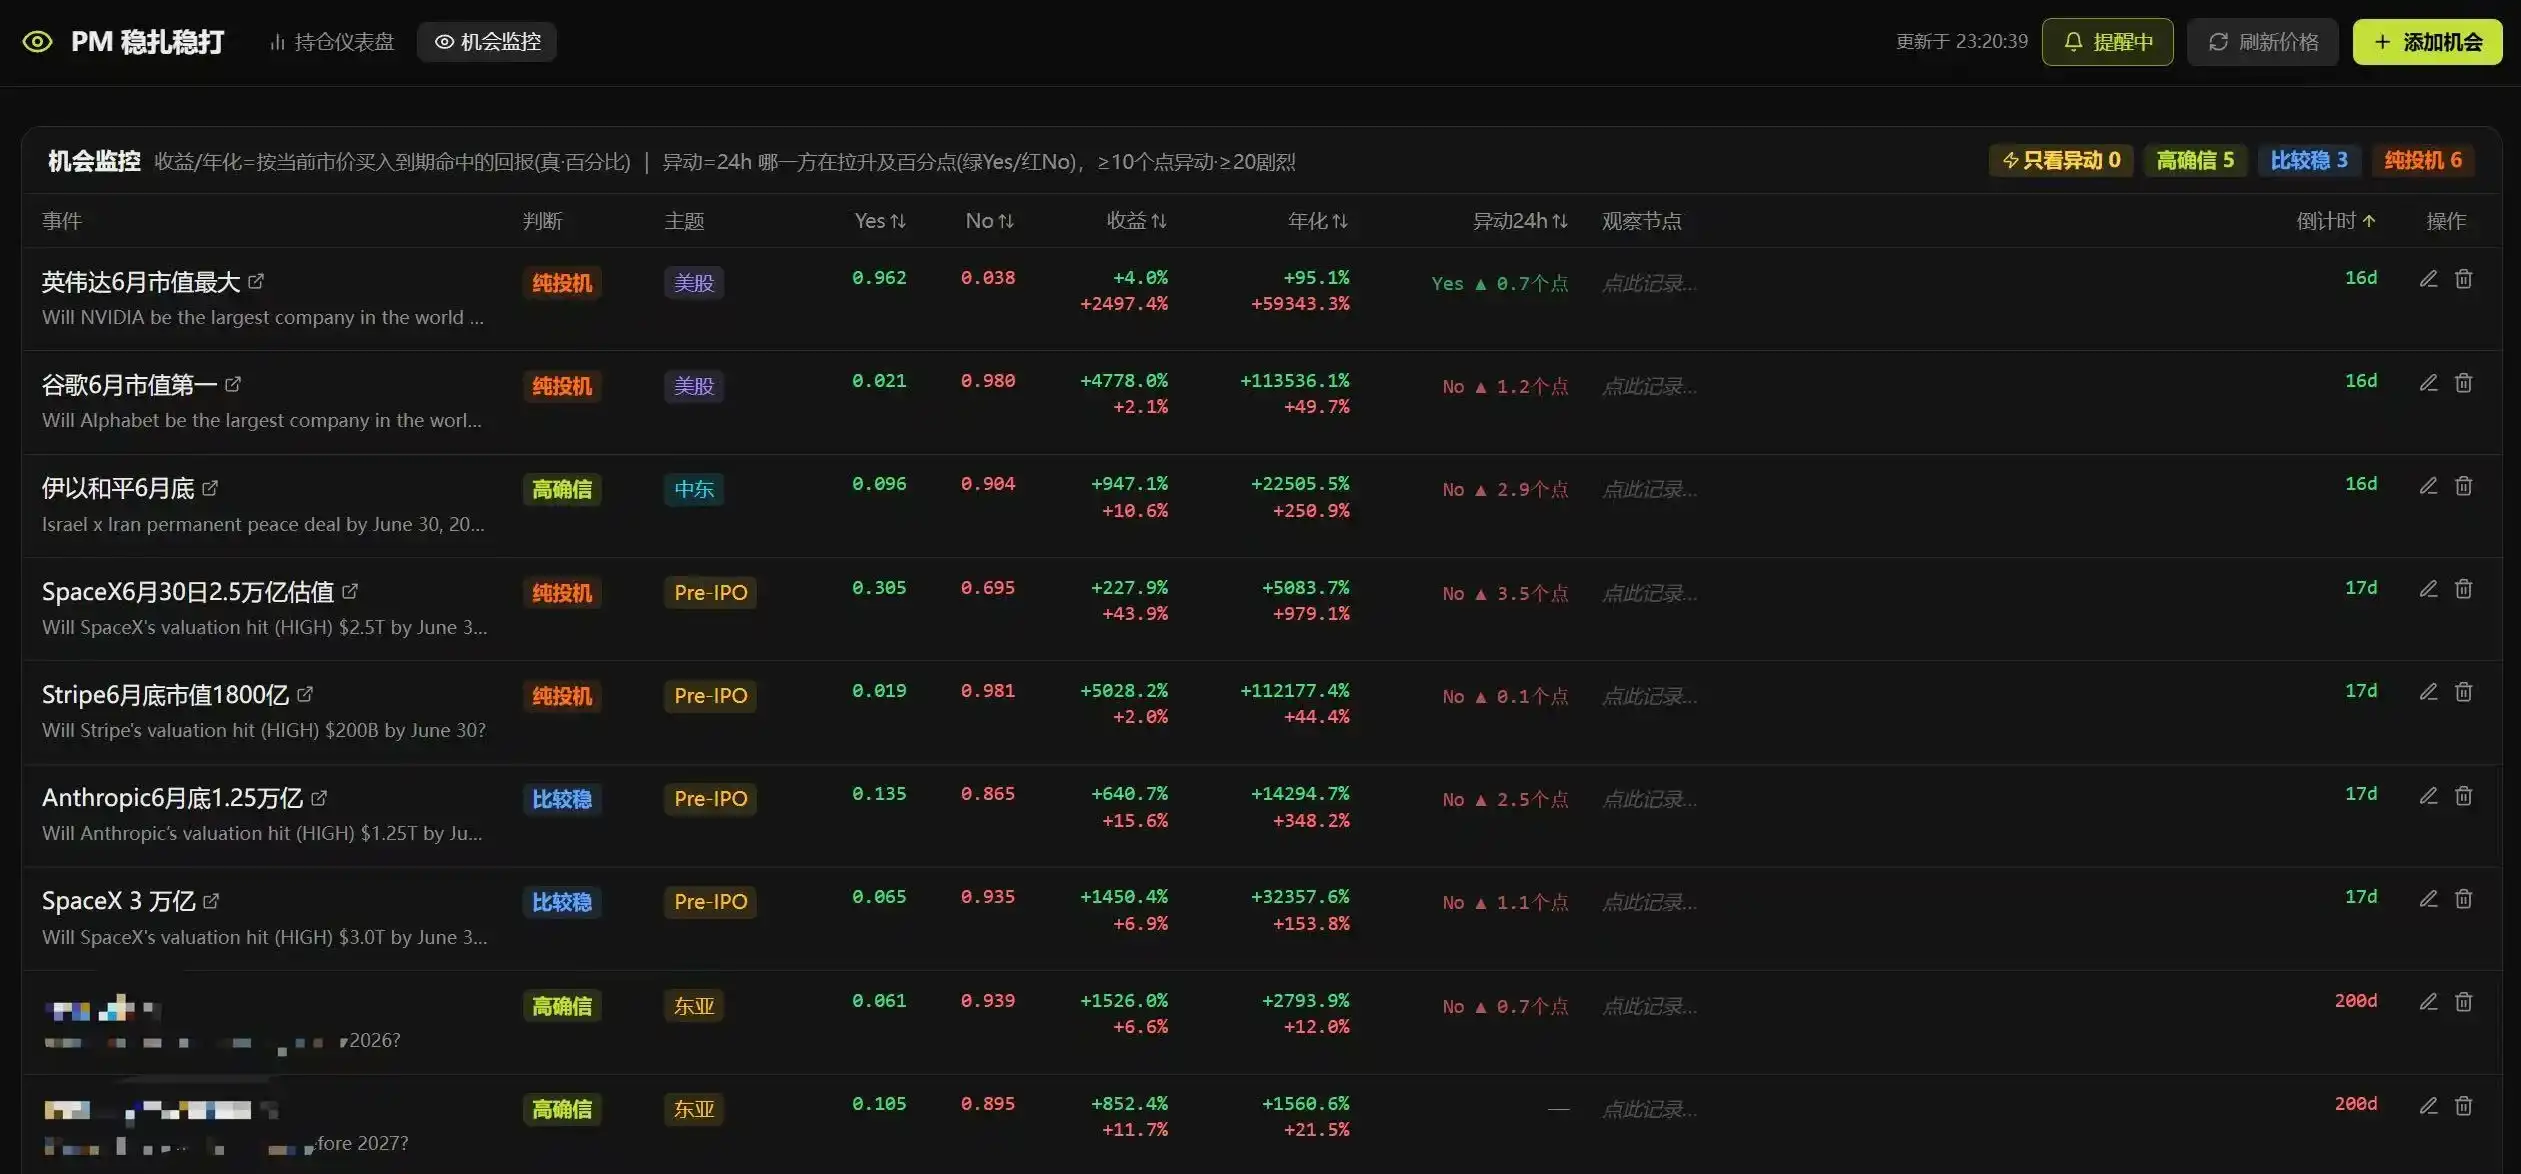
"Opportunity Monitor" is a watchlist where I put markets I'm watching but haven't bet on yet.
Each market records several key fields, including event name (with a hyperlink directly to the trading page), T1/T2/T3 stratification judgment, current yes/no price, return, annualized return, anomalies (customizable thresholds, e.g., anomalies exceeding 20% within 24 hours trigger a pop-up as long as the webpage is open), my set observation nodes, and a countdown to bet expiration.
There are two small design features I'm quite satisfied with: First, I found a suitable PM interface to parse the webpage link of the betting event. It automatically prompts for yes/no options, corresponding prices, and categorizes different options under the same event, greatly reducing manual entry hassle. Second, the Tier assignment for the same bet automatically rearranges as the remaining days change.
Not long ago, before Anthropic released Mython, there were obvious price anomalies in the watchlist, basically indicating a high-probability, high-certainty event. Entering at that time could have yielded about a 10-point gain—such opportunities are hard to capture consistently without a watchlist.
2. PM's Mathematical Expectation Trap and the "T1, T2, T3" Design Principle
The above is a simple introduction. What I really want to discuss is a thought I had after practical testing.
That is, in binary markets like PM, there exists a significant structural trap that is very unfriendly to players who like "single large positions" but is more suitable for those accustomed to "opening a supermarket, buying a whole bunch"—diversified allocation.
I'll try to explain my thinking clearly. If there are any errors or omissions, just pretend you didn't see them:
Suppose the yes price c for a betting event is 0.80, meaning the market believes there's about an 80% probability this event will happen. If I judge the true probability q of this event occurring is 0.90, then the expected return rate for this bet can be roughly calculated as:
EV = q / c - 1 = 0.90/0.80 - 1 = 12.5%
This looks good, but PM is not a bond. Behind this 12.5% lies a sharp tail risk: if your judgment is wrong, the loss isn't 12.5%, but 100%.
So in my dashboard, I don't just look at "expected return rate." I also monitor two things simultaneously:
- One is the gap between my own probability judgment and the market price, i.e., q - c (I have an automatic profit-taking reminder target set, which is the midpoint between the buy price and 100). This is the core of whether an edge truly exists.
- The other is the impact on the total account if this event is wrong and the single position goes to zero.
The second reason is also the origin of the T1, T2, T3 stratification I mentioned in the first chapter.
Simply put, I divided them into three categories:
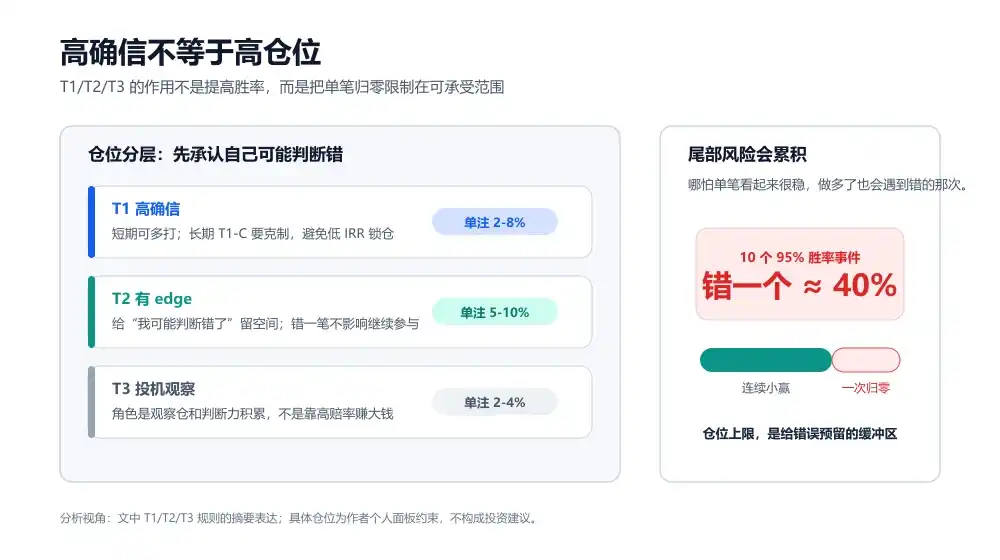
- T1 High Conviction: For me, the comfort zone lies in matters involving East Asia and some geopolitics where I feel there's an information gap between East and West. After repeated verification, I add these.
- T2 Relatively Stable: Some where I feel the current implied probability is significantly higher/lower than the actual yes/no pricing.
- T3 Pure Speculation: Those with very high odds, and these shouldn't be held long. Best for betting against the trend (搏反搏), expecting them to revert to a certain price to capture short-term gains.
But it's also important to note that T1 has hidden costs, especially in long-term bets. For example, a T1-level bet might have a static return of 18%, but if settlement is in 180 days, the annualized IRR might only be 3–4%, worse than leaving the money idle. During that time, the capital is locked up, and you might miss later high-IRR opportunities.
So within T1, I further break it down into several time brackets (this part is purely personal thinking, so I won't share it further). Anyway, short-term T1-A can be allocated more, long-term T1-C needs restraint. Allocating too many low-IRR long-term bets is a hidden drag on capital efficiency.
T2 has edge, but leave room for "being wrong." The single-bet upper limit is 8–10%, meaning even if this bet loses completely, the total account loss is controlled within 10%, not affecting participation in future opportunities.
T3 odds are tempting, but use minimal position size to observe. Don't expect to make big money from it. Instead, it's for betting against the trend and capturing short-term reversion—keeping yourself continuously tracking high-odds events to accumulate a feel for such markets.
Overall, position limits are essentially about leaving space for the acceptable cost of "I might be wrong."
Here's a very counterintuitive but particularly important point: high conviction does not equal high position size. Even if you think an event has a 95% probability of happening, as long as there's a 5% chance of it going to zero, the position size must be restricted.
Take an extreme example: Suppose you make 10 consecutive bets you think have a 95% win rate. Each sounds very safe, but as long as they are independent of each other, the probability of getting at least one wrong is roughly 1 - 0.95^10 ≈ 40%.
If you do it enough, you'll eventually encounter that wrong one.
And that's just for independent events. In reality, many PM markets are not independent; they often have correlations. For example, "Will US-Iran talks reach an agreement?", "Will the Strait of Hormuz reopen?", "Will Middle East tensions escalate within the month?" These three bets look like three independent markets, but the underlying variable is almost the same—Middle East geopolitical policy direction. Once the judgment on that direction is wrong, all three bleed simultaneously.
This has been the biggest help for me—not improving win rate, but limiting myself from making big mistakes. Frankly, the core value of this dashboard isn't profit statistics; it's risk control.
3. My Real View on Polymarket After This Round
After this half-month of deep, hands-on testing, my biggest takeaway is: There are opportunities on Polymarket, but it's absolutely not the arbitrage paradise many imagine it to be.
Previously, when we played with on-chain arbitrage, the rules were mostly clear, and price misalignments could be locked in. But Polymarket is different. It heavily tests your logical understanding of the shifts in sentiment around a particular bet (this point feels hard to express precisely in words).
For example, regarding East Asian-related political and economic dynamics, Chinese-speaking users might indeed have some information gap advantage, which is worth exploring. But this doesn't guarantee you'll win. Polymarket ultimately settles not based on "your understood reality" but based on market rules and designated data sources (UMA's manipulation issues are also not uncommon).
Moreover, just because you think something is a sure thing in the Chinese context doesn't mean the definition is the same in the English rules, especially since the rule settings for each bet often contain textual traps.
So based on my actual experience, PM doesn't have that many arbitrage opportunities. It mainly relies on information gaps and position diversification. Even high-conviction bets can encounter black swans.
Once you encounter one, the principal is completely gone.
As a friend said, "In investment, even if there's only a 1% chance of going to zero, one shouldn't be complacent."
Because the mathematical expectation of that, in the long run, is negative.
So my understanding of PM is now more conservative:
- First, don't treat it as a stable income tool, even for high-conviction bets. Especially after you win several times in a row, don't think you've found a cash machine. The scariest thing about binary markets is that they make you, after consecutive wins, mistakenly believe you can judge everything, leading to one large final position that wipes out all previous profits.
- Second, don't equate high win rate with a good trade. An event with a 90% win rate, if the market price is already 0.95, might actually have negative expectation. Conversely, an event with only a 40% win rate, if the market only prices it at 0.20, might have positive expectation.
- Third, don't ignore tail risk. This is especially important. Many people see 10%, 20% returns and think it's stable. But as long as being wrong on that trade means going to zero, it's not a low-risk return in the traditional sense (from this perspective, I even think there are no so-called low-risk opportunities on PM; every one is high-risk).
- Fourth, avoid pseudo-diversification. Buying multiple different markets isn't necessarily diversification. For example, the three bets mentioned earlier—"Will US-Iran talks reach an agreement?", "Will the Strait of Hormuz reopen?", "Will Middle East tensions escalate within the month?"—look like three independent markets, but the underlying variable is almost the same.
So I'm now more willing to treat PM as a judgment training ground.
It happens to complement the political, economic, tech, and financial news I, as a homebody, love to browse daily, turning those judgments that usually stay at the "I think" level into something that can provide positive feedback.
These abilities are useful outside of PM as well.
By the way, besides this PM betting dashboard, I also used Codex to build a private market valuation dynamic monitoring dashboard, mainly tracking valuation changes of pre-IPO unicorn companies—Anthropic, OpenAI, Stripe, Kraken, etc.—in the private market, and the relationship between these changes and the corresponding bets on PM.
Polymarket is essentially a prediction market. Sometimes signals in the private market are already changing, but PM prices haven't moved yet. Other times, PM prices move first, and real-world data hasn't caught up. The misalignment between the two is worth continuous observation.
Of course, there's no risk-free arbitrage here either. Private market valuations themselves aren't fully transparent, and there might be discrepancies between different data sources. But as an observation framework, it's quite interesting. I'll find an opportunity to write a separate article about it later.
Too Happy's Summary
From beginning to end, what this article wants to say is never "I made 30% with my dashboard, you can too."
I think what's more useful is being able to create a tool that helps you turn feeling into a framework, and turn framework into discipline. Often, when many people make money, it doesn't mean they've found some secret formula; it only means their judgment happened to be right this round.
This distinction is important.
I also recommend everyone start trying Vibe Coding. It doesn't necessarily have to be with Claude Code; you can try Codex, or even Kimi Work recently launched by Kimi. If anyone has difficulties subscribing to overseas services, I can share some smooth methods I use later.






