Author: Michel Athayde
Warning: This is a sobering report
Have you ever had these illusions:
-
"The 4-hour chart is too slow, I'll do 5-minute short-term trading, 1% compound interest per day, and I'll be the world's richest person in a year."
-
"Spot trading earns too slowly, I'll use 3x, 5x leverage. As long as the direction is right, the money I make will be several times that of others."
To verify these "get-rich-quick fantasies," we not only backtested the 4-hour chart but also dragged out the 15-minute (15m), 30-minute (30m), and 1-hour (1H) charts to "whip their corpses";
We not only looked at spot trading but also simulated the real outcomes of 200% (2x), 300% (3x), and 500% (5x) leveraged positions in extreme market conditions.
The conclusion is extremely brutal: Without leverage, 90% of us, after messing around for these 5 years, wouldn't even beat "foolishly hoarding coins."
Baseline Data: The "Passing Grade" You Must Beat
Before evaluating any strategy, we must first see how much you can earn by "doing nothing." Based on spot data from the past 5 years:
-
BTC Pure Spot: +48.86%
-
ETH Pure Spot: +53.00%
(Note: This means if you bought 5 years ago and uninstalled the APP, you would now have about a 50% profit. This is the "passing grade" that any strategy must beat.)
MACD Strategy Data Summary
I backtested the performance of MACD on BTC/ETH over different timeframes and leverage levels for the past 5 years:
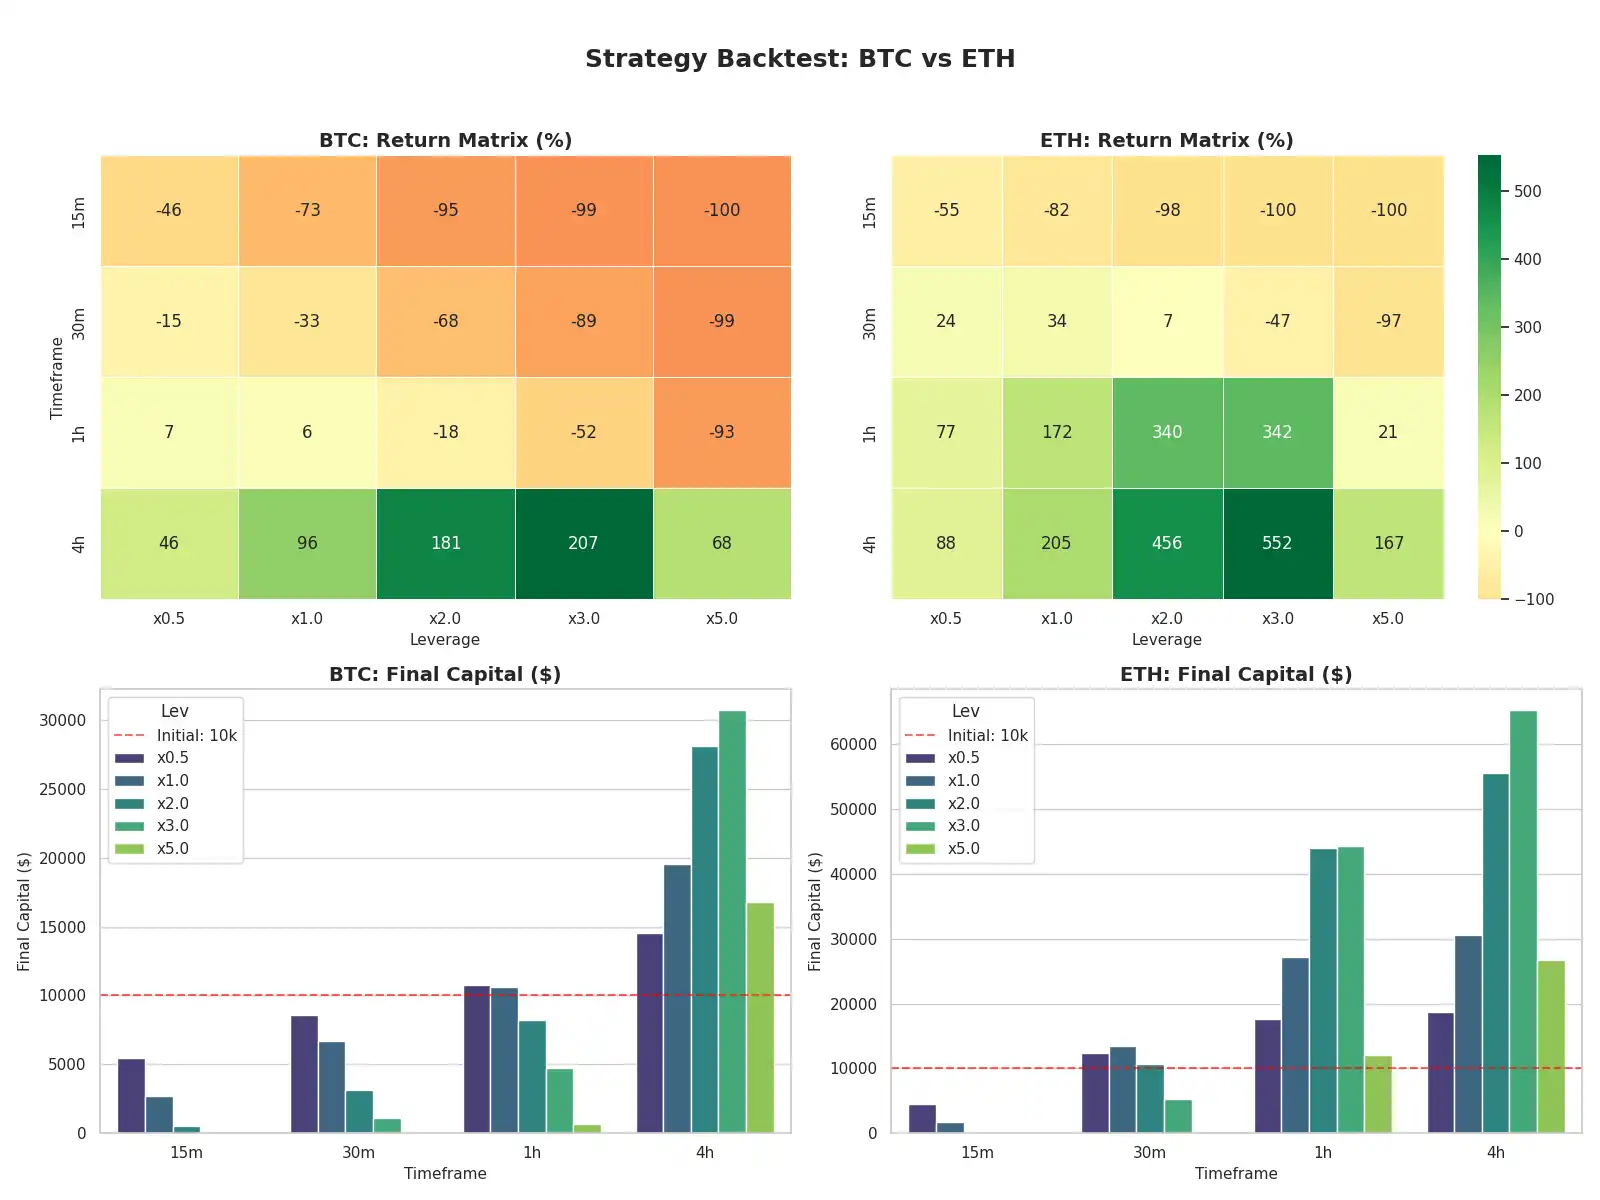
| English Label (Chart Label) | Chinese Meaning (Meaning) |
| Strategy Backtest | Strategy Backtest Analysis |
| Return Matrix (%) | Return Heatmap (Redder colors indicate more loss, greener colors indicate more profit) |
| Final Capital ($) | Final Capital (Initial capital is 10,000 U) |
| Timeframe (TF) | Timeframe (15m, 30m, 1h, 4h) |
| Leverage (Lev) | Leverage Multiplier (x0.5, x1.0, x2.0, x3.0, x5.0) |
| Initial: 10k | Initial Capital (Red dashed baseline) |
-
Top Left & Top Right (Heatmap - Return Rate):
-
Danger Zone (Red/Dark Orange): Concentrated in short timeframes like 15m and 30m. Especially with high leverage (x3.0, x5.0), capital is almost wiped out (-99%, -100%).
-
Golden Zone (Dark Green): Concentrated in the 4h timeframe. ETH's performance on the 4h chart is particularly outstanding, with almost all blocks being green.
-
-
Bottom Left & Bottom Right (Bar Chart - Final Capital):
- Red Dashed Line (10k): This is the break-even line. Bars below the red line represent losses, bars above represent profits.
-
BTC vs ETH: Notice the ETH 4h bars in the bottom right corner. When using x2.0 or x3.0 leverage, the capital bars are extremely tall, far exceeding BTC's performance. This verifies that ETH's volatility brings higher excess returns during trending markets.
I. Painful Lesson: 90% of Short-Term Operations Are "Negative Optimization"
The data reveals a brutal fact: On small and medium timeframes (15m, 30m, 1h), the MACD strategy not only failed to create excess returns (Alpha) but also significantly underperformed "foolish coin hoarding" due to overtrading and friction costs.
1. BTC 1-Hour Timeframe's "Busy Work"
-
Strategy Performance: BTC 1h x1.0 return rate is +6%.
-
Benchmark Performance: BTC spot hoarding return rate is +48.86%.
-
In-depth Interpretation:
At the 1-hour level, you stared at the charts diligently for 5 years, executed thousands of golden cross/death cross trades with MACD, paid huge fees to the exchange, and only made 6% in the end. If you had done nothing, you would have made 49%.
Conclusion: Running the MACD strategy on the 1H timeframe essentially destroys value. Your frantic operations look impressive, but the收益 turns from positive to negative (relative to opportunity cost).
2. The Complete Rout of Short-Term Trading (15m / 30m)
-
All Strategies: All resulted in losses or liquidation.
-
Compared to Benchmark: Compared to the +50% positive return of hoarding, short-term strategies represent a -100% devastating blow.
-
Cause of Death Analysis:
-
Noise: Most fluctuations at the 15m level are meaningless random walks.
-
Fee Erosion: Frequent opening positions incur手续费 and slippage, eating away at the principal like termites.
-
Mental Breakdown: High-frequency stop-losses lead to operational distortion.
-
II. The Only Way to Outperform: "Excess Returns" on the 4-Hour Timeframe
Only when the timeframe is extended to 4 hours does the MACD strategy demonstrate the ability to beat "coin hoarding." This is the only reason quantitative trading exists.
1. BTC 4h: A Narrow Victory
-
MACD x1.0 (Spot): Return approximately +96%.
-
Hoarding Benchmark: +48.86%.
-
Winning Logic:
MACD successfully helped BTC avoid the main下跌浪 of the deep bear market (e.g., the big drop in 2022) at the 4H level. Although it made a little less during the bull market's initial and final phases, the advantage gained from being空仓 for risk avoidance ultimately allowed it to outperform buy-and-hold.
2. ETH 4h: Absolute Crushing
-
MACD x1.0 (Spot): Return approximately +205%.
-
Hoarding Benchmark: +53.00%.
-
MACD x3.0 (Optimal Leverage): Return +552%.
-
Winning Logic:
ETH has extremely strong trend characteristics. Hoarders enjoyed the rise but also fully endured the -80% drawdown. The MACD strategy preserved profits by being空仓 during the bear market and compounded them in the next bull market. A return 4 times that of hoarding (205% vs 53%) proves the huge value of timing on ETH.
III. The True Meaning of Leverage: Amplifying "Win Rate" or Amplifying "Gambling Nature"?
Combined with the baseline data, we can redefine the role of leverage.
1. x2.0 - x3.0: The Secret of the Golden Zone
-
BTC 4h x3.0 (+207%) vs BTC Hoarding (+48.86%):
With 3x leverage, the strategy放大 the return by 4 times. This is a healthy放大 ratio, indicating the strategy captured the real trend, and leverage played a "pushing the boat with the current" role.
-
ETH 4h x3.0 (+552%) vs ETH Hoarding (+53.00%):
The return was放大 by 10 times! This is the peak performance of quantitative trading - achieving class-leaping returns on high-volatility assets with reasonable leverage and the correct timeframe.
2. x5.0: The "Inversion" of Return Rate
-
ETH 4h x5.0 (+167%):
Note! Although it beat hoarding (+53%), it significantly underperformed the low-leverage strategy (+552%).
-
Warning: When you increase leverage to 5x, you are essentially working for the exchange (high funding fees) and giving money to the market (high volatility erosion). You bear the risk of liquidation and归零, but only get mediocre returns.
IV. Your "Death Matrix" Report (The Death Matrix)
To make you give up hope, we list the final outcomes under different configurations.
| Asset | Timeframe | Leverage | Status | Final Return Rate | Outcome Evaluation |
| BTC | 15m | x5.0 | 💥 Liquidated | -100% | Certain Death. Pure gambling, fees alone can eat you alive. |
| BTC | 15m | x1.0 | -73% | Slow suicide. Worse than putting money in the bank. | |
| BTC | 1h | x1.0 | +6% | Busy work. Underperformed hoarding (+49%), wasted 5 years of youth. | |
| BTC | 4h | x1.0 | ✅ | +96% | Excellent. Beat hoarding by double, stable mentality. |
| BTC | 4h | x3.0 | ✅ | +207% | Outstanding. Maximized returns, controllable risk. |
| --- | --- | --- | --- | --- | --- |
| ETH | 15m | x5.极0 | 💥 Liquidated | -100% | Certain Death. Victim of noise trading. |
| ETH | 1h | x1.0 | ✅ | +172% | Acceptable. ETH is volatile, can make some money short-term, but tiring. |
| ETH | 4h | x1.0 | ✅ | +205% | Excellent. 4 times the return of hoarding, and no need to stay up late. |
| ETH | 4h | x3.0 | ✅ | +552% | King. This is the holy grail zone of quantitative trading. |
| ETH | 4h | x5.0 | ✅ | +167% | Mediocre. Risk increases dramatically, returns反而 decrease (funding fees + erosion). |
V. Final Decision Guide: What Should You Do?
Based on the passing grade of hoarding (+50%), we give the final strategy recommendations:
-
If you don't want to bother / have no time / have a weak mentality:
-
Strategy: Pure Hoarding (Buy & Hold) or MACD 4h x1.0 (Spot).
-
Expectation: ~50% - 100% return.
-
Cost: Need to endure asset drawdowns, but this is infinitely better than losing money through胡乱操作.
-
-
If you want to beat the market (BTC):
-
Strategy: MACD 4h (x1.5 - x2.0).
-
Expectation: ~150% - 200% return.
-
Key: Must strictly stop loss, only trade the 4H large timeframe, never look at 15m.
-
-
If you pursue excess returns (ETH):
-
Strategy: MACD 4h (x2.0 - x3.0).
-
Expectation: ~400% - 550% return.
-
Key: This is the optimal sweet spot. Utilize ETH's high volatility + moderate leverage. Remember, do not exceed 3x.
-
-
If you are a gambler / short-term trader:
-
Strategy: MACD 15m/1h + x5.0 or higher.
-
Expectation: -100% (Zero out).
-
Warning: Data proves this cannot beat hoarding, and is even worse than donating the money.
-
Core Conclusion
"Since spot hoarding only yielded about 50% over 5 years, this反而 proves the value of excellent quantitative strategies."
However, this value is limited to the 4-hour level.
On timeframes below 1 hour, all your efforts are counterproductive, worse than simply doing nothing.
Only by standing at the golden intersection of 4H + 3x can you truly laugh at those who "hold until death."
(The data in this article is based on historical backtesting and does not represent future returns. The market is risky, use leverage cautiously.)