In options markets, dealer hedging flows play a central role in shaping short-term price behavior. Gamma Exposure (GEX) is used to identify where those hedging flows are likely to stabilize price action and where they may amplify moves. While GEX is well established in equity and index options, applying it directly to crypto markets is problematic.
Crypto options differ materially in participant behavior, trade motivation, and data availability. To account for this, we reconstruct a flow-based GEX measure tailored to crypto options markets, designed to recover how dealer positioning evolves across strikes and maturities. We show how this framework can be used to interpret volatility regimes and identify price zones where dealer hedging may meaningfully influence market dynamics.
What is Gamma Exposure and Why it Matters
Gamma Exposure (GEX) measures how options market-makers’ hedging flows react to movements in the underlying asset.
Market makers, who typically maintain delta-neutral positions, must continuously hedge their gamma exposure by buying or selling futures or spot to offset the delta of the options they’ve sold or bought. When price moves, option deltas change (that is gamma), forcing dealers to rebalance. These rebalancing flows create structural feedback loops in the market and are a source of some of the most significant mechanically driven flows observed in the equity markets.
At the core of this dynamic, the taker is the end user — a trader or investor buying or selling options, while the dealer (or market-maker) is the counterparty providing liquidity. Their positions are mirror images of each other: when the taker buys a call, the dealer sells it.
Why is GEX useful?
- At price levels with high positive gamma, dealers hedge in a way that tends to absorb price shocks. They typically buy on dips and sell on rallies, which dampens volatility and can keep price pinned near certain strikes: a phenomenon often described “gamma gravity” or “pinning”.
- At price levels with high negative gamma, dealer hedging flows work in the opposite direction and amplify price moves. Dealers sell as prices fall and buy as prices rise, often increasing short-term volatility.
In short, GEX highlights where dealer hedging is likely to stabilize or destabilize the market, turning the options surface into a map of potential volatility regimes rather than a passive snapshot of positioning.
TradFi Origins: Gamma Exposure Calculation in Traditional Finance
Gamma exposure metrics originated in equity and index options markets (for example, SPX). The classic construction is:
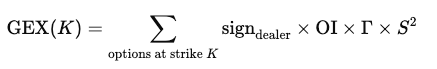
Where:
- OI is open interest at that strike
- Γ is option gamma
- S is the underlying spot price
- sign_dealer is the assumed sign of the dealer position (long or short)
Because traditional equity datasets do not label who is the taker on a trade, this framework relies on a simple heuristic about who typically holds which side of the options market:
- Call options are sold by investors and bought by dealers
- Put options are bought by investors and sold by dealers
In the classic equity context, investors typically write calls for yield enhancement and use puts as downside insurance.
Why the Equity Heuristic Fails in Crypto
In crypto options, the equity-style assumptions break down. A large share of participants actively buy calls to speculate on upside, rather than systematically selling them for yield. Meanwhile, puts are frequently traded tactically rather than used purely as hedges for long-only portfolios. If we continue to assume “calls = investor short, dealer long” and “puts = investor long, dealer short,” we construct a dealer profile that does not reflect actual positioning.
There is a second, more subtle issue. The classical approach treats open interest at each strike as a single block position with one sign. In practice, a strike’s OI is built from both buying and selling flows. A simple case where 50% of OI came from takers buying (dealers short) and 50% from takers selling (dealers long), the net dealer exposure is close to zero — yet the heuristic would still report a large exposure. Instead, what we actually want is:
- A realistic sign of dealer positioning (long vs short);
- A realistic net size of that position after netting out opposing flows.
A Flow-First Approach to Gamma Exposure (GEX) in Crypto
Unlike traditional equity markets, crypto options venues expose who is the taker on each trade. For every transaction, we can observe whether the taker bought or sold a call or a put. We then make a clear modeling assumption: the maker on the other side of the trade is a dealer providing liquidity.
This allows us to treat the taker as the end user and infer dealer positioning as the mirror image of cumulative taker flow, strike by strike and maturity by maturity. Over time, this builds a realistic picture of how dealers are positioned across the volatility surface.
On this foundation, we build a methodology that tracks dealer inventory through time and translate that inventory into gamma exposure using option greeks and spot price. The result is a structural GEX measure anchored in actual trading flow, rather than static heuristics. A full description of this process is provided in the Appendix at the end.
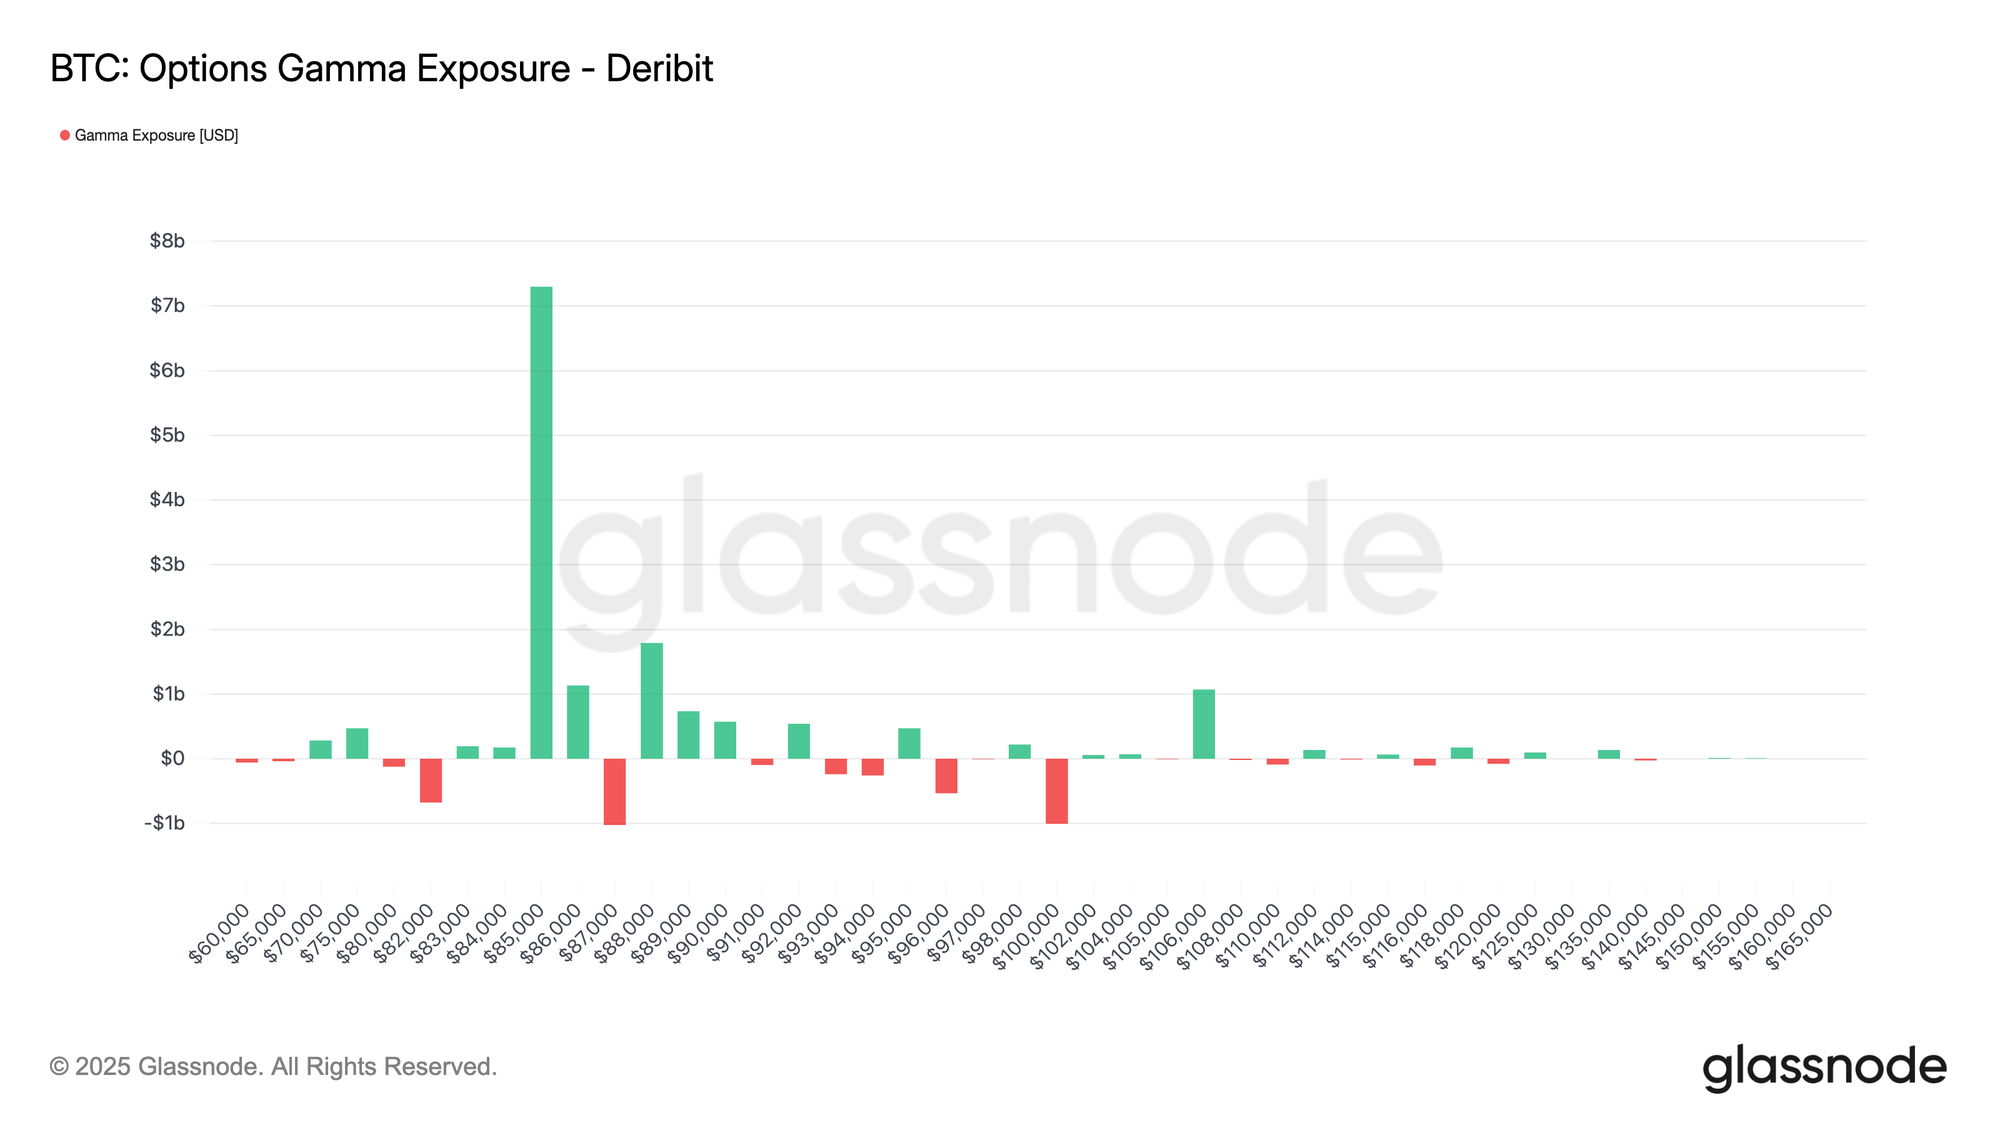
The chart below shows BTC options gamma exposure across strike prices on Deribit. Each bar represents the net gamma exposure (in USD) concentrated at that strike: green indicates positive exposure, red indicates negative exposure. The distribution shows a dominant positive gamma cluster around ~$86k–$87k, with smaller pockets of negative exposure around ~$83k and ~$101k.
Metric Interpretation
Gamma exposure helps map where hedging flows may impact price action. Large positive GEX near ~$85k–$86k suggests a zone where dealer hedging is likely to be mean-reverting (buying dips and selling rallies), contributing to pinning or slower price movement around those strikes. By contrast, negative GEX pockets mark areas where hedging becomes momentum-reinforcing (selling into weakness / buying into strength), increasing the likelihood of faster, more directional moves if spot trades into them.
Available for:
- Resolution: 10-minute
- Assets: BTC, ETH, SOL, XRP, PAXG
- Exchanges: Deribit
Trading Use-Cases: How to Use GEX in Practice
From a trading perspective, GEX turns the options surface into a map of where dealer flows are likely to amplify or dampen price moves.
Identifying “sticky” vs “slippery” price zones
- High positive GEX near spot: When GEX is strongly positive around a band of strikes near spot, dealers are long gamma in that zone. As the market trades inside this band, their hedging flows tend to buy on dips and sell into rallies, which creates a pinning effect: moves fade, breakouts struggle, and realized volatility often comes in below implied. This is typically a mean-reverting, “sticky” regime, where short-gamma carry trades can work if volatility indeed remains contained.
- High negative GEX near or below spot: When GEX is strongly negative around or just below spot, the opposite holds: dealers are short gamma, so as spot trades into that region, hedging flows sell into weakness and buy into strength. Instead of dampening moves, they amplify them. Price action becomes more “slippery”: intraday swings can expand, order books can feel thinner, and liquidations or squeezes become more likely. In that environment, traders often respond with lower leverage, wider stops, and more respect for momentum.
Watching for gamma flips
A particularly important dynamic is the gamma flip, when net GEX around spot changes sign. For example, if price exits a positive-gamma zone and moves into a pocket of negative gamma below, the market can transition from a pinned, mean-reverting regime to one where moves begin to reinforce themselves.
Appendix – Our Methodology: Taker-Flow-Based GEX
We construct Gamma Exposure on a 10-minute grid per asset, exchange, strike K, maturity M. The key idea is to reconstruct the dealer inventory over time from taker flows, and then translate that inventory into gamma exposure using option greeks.
We define the net taker flow in contracts over each 10-minute interval:
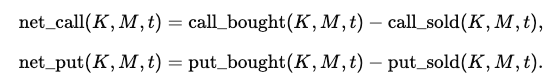
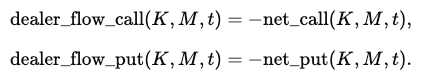
Under the assumption that dealers are primarily on the passive side, the dealer flow is simply the mirror image of taker flow:
We then cumulate these flows over time to obtain a dealer inventory in number of contracts. For calls, this is:

and analogously for puts:

Here Δt is the 10-minute step. Positive inventory values correspond to dealers being net long contracts at that strike and maturity; negative values correspond to net short.
To translate this inventory into gamma exposure, we combine it with option greeks and the underlying price. Let m denote the contract multiplier (e.g. BTC per contract), and S the spot price at time t. For each bucket we define the notional exposure:
Using the option gammas Γcall(K,M,t) and Γput(K,M,t) from our options chain, the gamma exposure of each leg is:


Γcall(K,M,t) is the gamma of the call option at that strike and maturity. This tells you how quickly the option’s delta changes when the underlying price moves.
And then total gamma exposure at that strike/maturity is just: