How to Systematically Track High-Winning-Rate Addresses on Polymarket?

Odaily星球日报Опубліковано о 2026-03-02Востаннє оновлено о 2026-03-02

Анотація

How to Systematically Track High-Win-Rate Wallets on Polymarket This article explores methods to identify and track high-performing wallets on Polymarket, a blockchain-based prediction market where all transactions are publicly recorded on-chain. While the platform's data is transparent, the key challenge lies in interpreting this data to find wallets that consistently demonstrate an informational edge. The piece outlines common characteristics of potentially "insider" wallets, which are not necessarily illegal but show patterns of highly informed trading. These include: new addresses making large, concentrated bets; wallets specializing in a single niche topic; sudden, significant increases in position size; and extremely precise timing, repeatedly entering positions hours before major public news breaks. A three-step methodology for systematically identifying these wallets is provided: 1. Analyze Polymarket's leaderboard to filter for addresses with sustained profitability over 30 days, a high win rate (>55%), and significant profits in liquid markets. 2. Drill down into specific event markets to examine the top holders, looking for wallets that consistently hold large positions before the market has fully priced in an outcome. 3. Conduct a detailed analysis of the candidate wallets' on-chain history, focusing on their entry timing (pre-news vs. post-news), position-building strategy (rapid vs. gradual), holding period, and trading focus (specialized vs. generalized)....

Original Title:How To Find 100X Insider Polymarket Wallets To Cop,Author: Aleiah(@AleiahLock)

Compiled | Odaily Planet Daily (@OdailyChina); Translator | Asher (@Asher_ 0210)

An address on Polymarket turned $35,000 into $442,000, achieving a 12.6x return. Notably, the position was established hours before a major market movement, with the trade largely completed and cashed out before the news spread to mainstream channels. This is not an isolated incident; before the news of the "Venezuela raid" political event became public, three addresses had already positioned themselves and collectively profited $630,000 from the same event.

If such trading occurred in traditional financial markets, one might easily think of information asymmetry. But in prediction markets, all fund flows and position changes are recorded on the public blockchain; there are no hidden accounts or private transactions.

Public does not mean without gaps. The key is not whether the trades can be seen, but whether one can discern truly informative signals from the vast amount of data.
Every Trade on Polymarket is Public Data

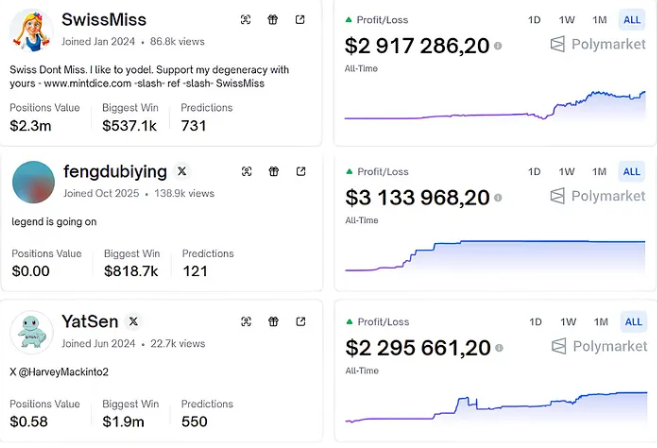
Many prediction market participants still view Polymarket as a traditional betting platform: watch the odds, choose a direction, and bet on the outcome. But Polymarket's underlying structure is completely different from DraftKings or ordinary sports betting. All trades occur on-chain; fund flows, position sizes, and entry/exit times are all publicly visible. The operational paths of those with the most accurate judgments and sharpest timing are not post-hoc speculations but real-time on-chain records.
Polymarket's API is also open. Trading records, market data, historical transactions—anyone can directly call it; there is no permission barrier.

Therefore, the gap is not about who can see the data, but who can extract meaning from it. On-chain information is public, but what is valuable are the wallets worth tracking continuously and the ability to recognize behavioral changes before prices fully reflect them.

What Characteristics Do True "Insider Addresses" Typically Have?

It's important to emphasize that not all profitable wallets imply insider information. Some traders have solid research capabilities, while others rely on quantitative models and algorithmic advantages. But when profitability is repeatedly combined with specific behavioral patterns, one can observe structural features that distinguish them from "luck."

First Type: Combination of New Addresses and Unusually Large Bets

A wallet created just days ago, with very few transactions, suddenly invests a large amount of capital in a low-liquidity niche market—this behavior is not common. Especially in the absence of public catalysts, large, concentrated positions often carry stronger informational significance.

Second Type: Highly Vertical Trading Focus

Some addresses do not operate across markets but focus long-term on a specific niche, maintaining a stable and significant win rate in that area. They do not diversify across crypto prices, elections, sports, etc., but concentrate firepower on a single theme, with more decisive position decisions.

Third Type: Abnormal Changes in Position Size

When an address that has been betting with medium-sized positions suddenly significantly increases its stake in a particular market, this behavior often indicates a change in the strength of conviction. Position size itself is an attitude; a sudden change in scale usually reflects an upgrade in information or belief.

Fourth Type: Overly Precise Timing

Occasional early positioning can be attributed to coincidence, but if an address repeatedly completes its position establishment hours before major news is announced, with highly consistent direction, this temporal lead is difficult to explain simply as luck. Once is random; repeated occurrences are more likely to indicate an information advantage.

How to Systematically Screen for Potential "Information-Advantaged Addresses"

Step 1: Analyze Performance on Polymarket Leaderboards

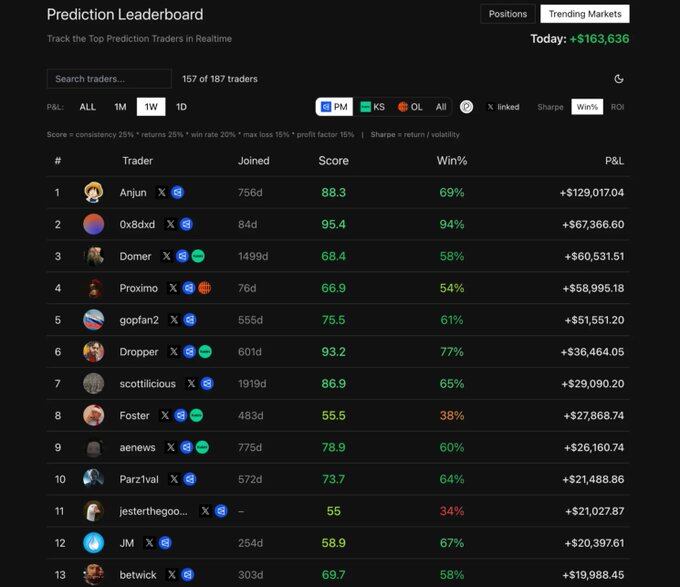
Start with the leaderboards on Polymarket Analytics (link: https://polymarketanalytics.com/traders), sorted by 30-day P&L, using recent stable profitability as the first filter. Focus on wallet addresses with an overall positive return over 30 consecutive days, a win rate above 55%, and total profits significantly higher than total losses. Also, confirm that their trading is concentrated in markets with real liquidity, not low-volume prediction events with little participation.
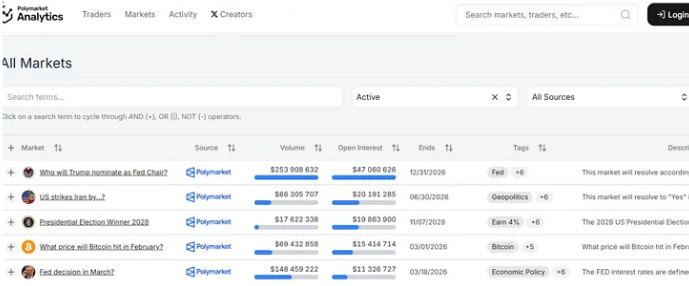
The goal at this stage is not to directly judge whether they have an information advantage, but to establish a watchlist of consistently profitable entities. A stable profit record is the foundation for subsequent behavioral analysis.

Step 2: Analyze Position Structure in Specific Events

After the initial screening, drill down into specific trading events. Enter active prediction markets and check the Top Holders list for that event. Polymarket publicly displays the addresses with the largest current positions; these large positions often represent stronger conviction.
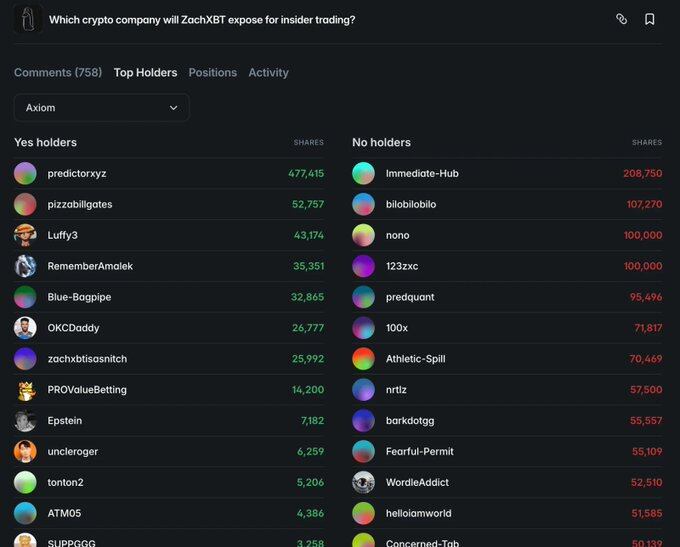
The key is not whether an address hits a single large bet, but whether its behavior is consistent. If a wallet repeatedly appears in the top holder lists for multiple significant events, and these positions are established before the market has fully priced them in, this repetition itself constitutes a signal.

A single successful bet might be chance, but repeatedly establishing large positions early, with consistent direction and verified outcomes, often indicates a judgment system with a stable advantage.

Step 3: Analyze Trading Behavior and Position Timing

After identifying candidate addresses, further analyze their on-chain transaction history, focusing on entry timing, position structure, and holding rhythm.
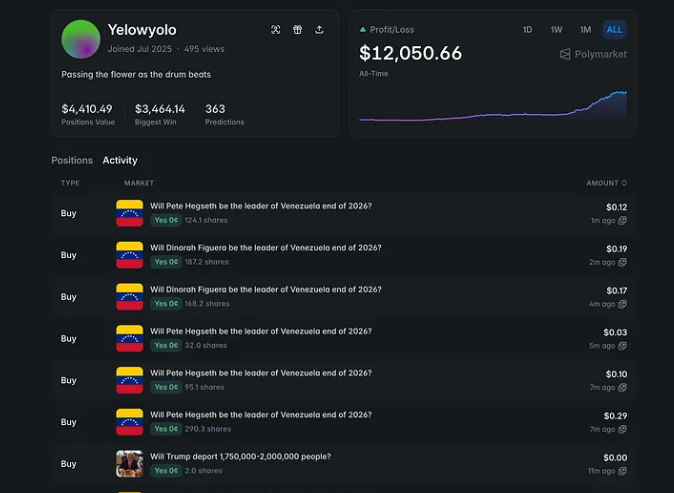
First, observe the entry time. If the purchase occurs hours before official news announcement and repeats multiple times, the timing advantage itself becomes an important variable; entering after media reports is more likely just information following.

Second, analyze the method of position building. Mature traders typically build positions in batches and add gradually, while wallets with strong informational judgment often complete concentrated positioning quickly within a short time window because their opportunity is limited.

Third, pay attention to the holding period. Some high-quality addresses choose to exit during the mid-stage of a trend's development, rather than waiting for the tail end of extreme volatility, indicating their goal is to capture the main trend rather than marginal profits.

Finally, observe their trading scope. Addresses that are highly vertical and long-term focused on a single niche are more likely to develop stable information advantages; addresses that frequently operate across sectors are more likely to rely on market sentiment rather than specific domain judgment.

Advanced Address Tracking Strategies

After mastering the basic screening methods, what truly makes a difference is the further dissection of the details of fund behavior.

First, focus on exit behavior, not just entry timing. Addresses with information advantages often not only position early but also actively reduce positions before potential negative news emerges. When a large address with a long-term stable holding suddenly significantly reduces its position without obvious catalysts, the informational content of this action is often higher than the initial buying behavior. Especially when the reduction reaches a significant proportion, this change is itself a signal.

Second, perform wallet clustering analysis using on-chain data. The relationships between addresses are not completely untraceable. Identical funding sources, similar Gas usage patterns, and transactions occurring consecutively within a very short time may reveal relationships between addresses. Many seemingly "new" accounts can often be traced back to a long-term active old address through 2 or 3 fund transfers. Tracking along the fund flow path helps identify new potential high-quality accounts before the market notices.

Additionally, pay attention to abnormal volume changes in niche markets. If a market with usually small daily trading volume suddenly experiences significant capital inflow without public news, this structural increase in volume often means some participants have acted early. Analyzing the specific addresses driving the volume change can help build a new watchlist.

Finally, cross-verify on-chain behavior with external public information. The so-called "Pizza Index" once inferred potential military action from abnormal order volumes at pizzerias near the Pentagon. Similarly, flight tracking data, social media activity of key figures, adjustments to public schedules, and other information can provide corroboration or counter-evidence for on-chain position behavior. The联动 (linkage) between on-chain fund flows and real-world signals can often strengthen the reliability of judgment.


Пов'язані питання

QWhat are the key characteristics of a potential 'insider address' on Polymarket?

AKey characteristics include: 1) New addresses making unusually large bets; 2) High specialization in a specific trading niche; 3) Abnormal changes in position size; 4) Exceptionally precise timing of trades, repeatedly entering positions hours before major news breaks.

QWhat is the first step in systematically screening for potentially informative addresses?

AThe first step is to analyze the Polymarket Analytics leaderboard, sorting by 30-day P&L to create a watchlist of addresses with consistent profitability, a win rate above 55%, and total profits significantly exceeding losses in liquid markets.

QWhy is analyzing exit behavior of an address as important as its entry timing?

AExit behavior is crucial because addresses with informational advantages often reduce their positions proactively before potential negative news emerges. A significant, unexplained reduction in a large, stable position can be an even stronger signal than the initial entry.

QHow can on-chain data be used for wallet clustering analysis?

AWallet clustering analysis involves tracing connections between addresses through common funding sources, similar gas usage patterns, and transactions occurring in quick succession. This can help identify relationships and trace new 'fresh' accounts back to long-active master addresses.

QWhat is the significance of abnormal volume changes in low-liquidity markets?

AA sudden, large inflow of capital into a typically low-volume market without public news can indicate that some participants are acting on early information. Analyzing the specific addresses driving this volume can help build a new watchlist of potential high-quality traders.

Пов'язані матеріали

Goldman Sachs: July Smashes Through Crowded Trades, U.S. Stock Bull Market Not Broken but Harder to Navigate

Goldman Sachs: July Sees Crowded Trades Unwound, U.S. Bull Market Intact but Getting Tougher. The U.S. stock market in July did not see an index-level crash, but rather a significant unwinding of speculative positions. While the S&P 500 remained stable—trading within a narrow 3.5% range and staying within 2% of its high—underlying market dynamics were volatile. Heavily crowded trades, particularly in high-momentum tech, AI-linked stocks, and Asian strategies, faced severe pressure and forced deleveraging. Data indicates this was a meaningful cleanse, not a minor adjustment. Global tech exposure saw its largest sell-off in over five years, leverage in Korean equity ETFs plummeted, and Goldman's prime brokerage recorded the largest gross exposure reduction since late 2022. Leverage on momentum factors among fundamental long/short clients fell to the 28th percentile of its one-year range. The AI trade narrative shifted from pure potential to a focus on tangible returns. While Meta failed to show clear AI monetization, Microsoft and Amazon provided evidence that massive capital expenditure is translating into scalable revenue and product growth, preventing a blanket sell-off of the AI sector. The Federal Reserve's more opaque communication style and volatility in long-end Treasury yields have introduced new friction, particularly for rate-sensitive growth and tech stocks. The broader outlook for U.S. equities remains favorable, supported by a strong economy, robust earnings, and substantial AI capital expenditure. However, risk/reward is no longer cheap, and the market's upward elasticity has weakened. The Nasdaq 100's trajectory—up 12% year-to-date despite significant pullbacks—illustrates that the bull trend persists but the path is becoming more difficult. The key lesson from July is that the market no longer rewards crowded, highly leveraged trades, requiring more disciplined and liquid portfolio approaches.

marsbit18 хв тому

Goldman Sachs: July Smashes Through Crowded Trades, U.S. Stock Bull Market Not Broken but Harder to Navigate

marsbit18 хв тому

Interview with Robinhood Executive: Meme + Tokenized US Stocks as "Barbell" Customer Acquisition Strategy, All Business Lines Achieve Hundreds of Millions in Revenue

Interview with Robinhood executive Johann Kerbrat reveals the company's "barbell" customer acquisition strategy for its new Robinhood Chain, combining meme tokens with tokenized stocks. Three weeks after mainnet launch, the chain has seen over $3B in weekly DEX volume and 105M transactions. Kerbrat explains the logic behind the permissionless chain: meme tokens attract DeFi users, while tokenized real-world assets (RWA), currently over 90 US stocks and ETFs accessible in 120+ countries, serve global users. The goal is to bring Robinhood's 27 million funded accounts on-chain by simplifying DeFi with a user-friendly interface, exemplified by features like Robinhood Earn which offers yield without requiring wallet management. Built on Arbitrum's technology stack for its speed, low cost, and Ethereum's security, the chain focuses on financial products like Earn, spot trading, and perpetuals. Kerbrat downplays direct competition with platforms like Base, emphasizing the goal of expanding the overall market for on-chain assets. He details selective partnerships (e.g., Morpho, Lighter) based on compliance, unique UX, and differentiation. While regulatory clarity is pending for US perpetuals, the expansion continues via Bitstamp in Europe. Finally, Kerbrat positions Robinhood as a "super app" integrating stocks, options, crypto, banking, and AI trading, with all major business lines generating hundreds of millions in revenue. For the chain, current priority is driving adoption over maximizing gas fee revenue.

marsbit2 год тому

Interview with Robinhood Executive: Meme + Tokenized US Stocks as "Barbell" Customer Acquisition Strategy, All Business Lines Achieve Hundreds of Millions in Revenue

marsbit2 год тому

Fidelity Q3 Report: BTC, ETH, and SOL Continue to Build Bottoms; How Much Further Will This Crypto Bear Market Go?

Fidelity's Q3 Crypto Signal Report analyzes the current bear market, noting Bitcoin (BTC), Ethereum (ETH), and Solana (SOL) are in a prolonged bottoming phase. Key indicators like the weighted Net Unrealized Profit/Loss (NUPL) have turned negative (-0.01), signaling the market is slightly below its aggregate cost basis, with BTC acting as the primary stabilizing asset. BTC's dominance has risen to 68%, indicating a lack of capital rotation to other digital assets. Performance has been weak across the board, with BTC, ETH, and SOL down significantly year-to-date. Market sentiment is depressed, exacerbated by substantial outflows from spot ETPs and a challenging macro environment. The report compares the current ~203-day downtrend to historical ~300-day bottoming cycles, suggesting the process may be two-thirds complete, with late 2026 as a potential timeframe to monitor. For Bitcoin, NUPL at 0.09 indicates cautious sentiment, while momentum signals remain negative. The Yardstick metric points to potential undervaluation relative to network security (hashrate). Ethereum's NUPL is deep in the "capitulation" zone at -0.43, a historically positive signal for future returns, though its momentum and network fee revenue are negative. Solana shows the deepest NUPL at -0.72 but demonstrates relative resilience in on-chain activity and stablecoin transfer volume. The report concludes that while several metrics are near historical capitulation levels, a definitive market bottom has not yet been established. The path forward likely involves continued consolidation, with BTC's relative strength and fundamental on-chain usage for ETH and SOL providing key areas for investor observation.

marsbit2 год тому

Fidelity Q3 Report: BTC, ETH, and SOL Continue to Build Bottoms; How Much Further Will This Crypto Bear Market Go?

marsbit2 год тому

Торгівля

Спот
活动图片