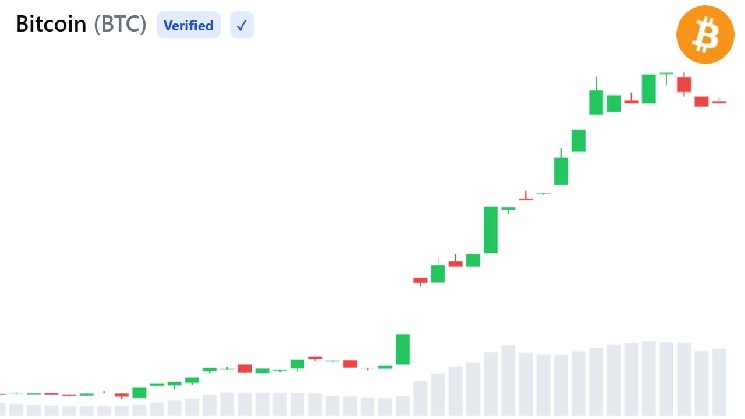
Bitcoin is approaching a technical level that has often separated bear market rallies from sustained recoveries.
Galaxy Research analyzed every completed Bitcoin bear market since 2011 using a mechanical definition: a drawdown in closing price of at least 50%, lasting at least 90 days. The research identified six completed bear markets, as well as the current decline.
During these completed cycles, Bitcoin regained its 50-week moving average 13 times. In 11 of those instances, the cryptocurrency held above this level without subsequently establishing a lower closing low.
Galaxy Research stated:
"All eyes are on Bitcoin's 50-week moving average."
That level is currently near $82,470. As of August 22, 8:50 a.m. ET, Bitcoin is trading around $77,190, roughly 30% above its June 30 low and about 6% below the weekly average.
Weekly Signals Outperform Daily Recoveries
The research found that Bitcoin's 50-day moving average gives faster signals but with far more false starts. Across the six completed bear markets, 43 out of 106 attempts to reclaim the 50-day average failed. Notably, the first attempt to reclaim the 50-day average failed in every single bear market studied.
The most glaring example was the 2013–2015 drawdown. Bitcoin crossed above its 50-day average 13 times before ultimately finding its final low. Some rallies held above the level for nearly two months before reversing.
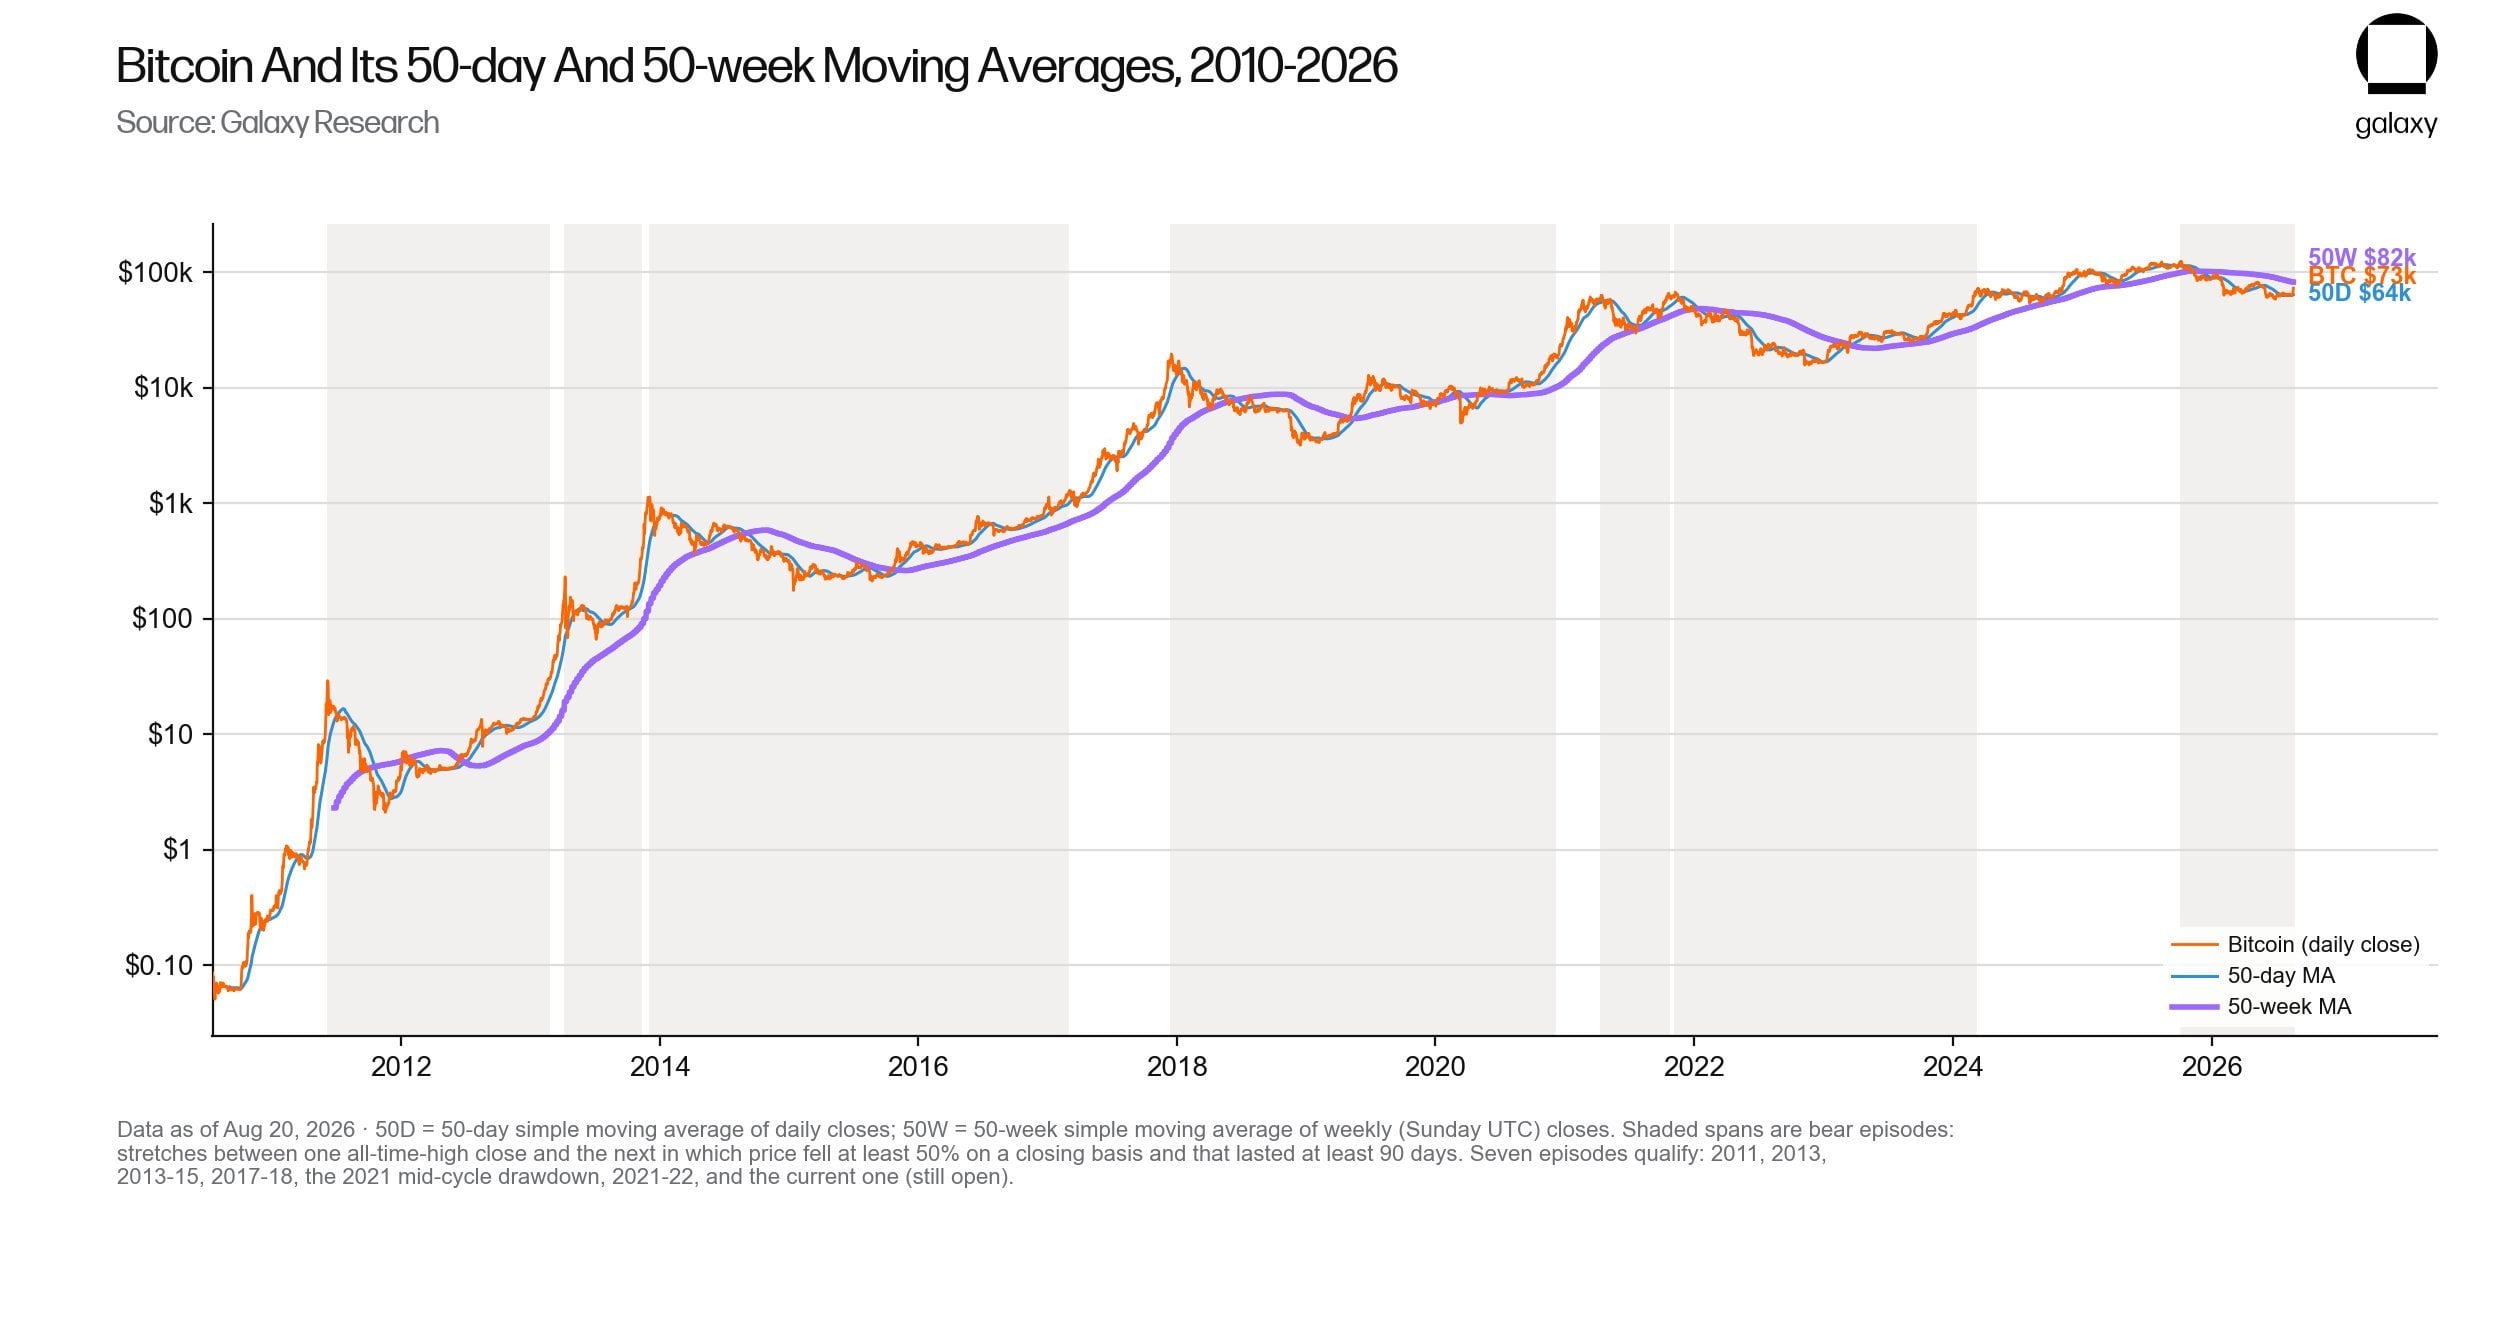
In contrast, the final recovery of the 50-week average was sustained for 945 days. "Bottoms are always accompanied by a 50-day average recovery, but a 50-day average recovery does not prove a bottom," Galaxy notes.
The only two failed recoveries of the 50-week level occurred during Bitcoin's 2021–2022 "double top" cycle — in December 2021 and March 2022. Bitcoin later fell to $15,758.
Stronger Confirmation Comes at a Cost
The trade-off is time.
During Bitcoin's three longer bear markets, the first successful recovery of the 50-week average occurred between 130 and 284 days after the price bottom. By that point, BTC had already rallied 63–80%.
The 2011 cycle was even more extreme. Bitcoin reclaimed the weekly average 51 days after the bottom, but by then it had already gained 237%.
There are exceptions. During the sharp 2013 drawdown, Bitcoin never fell below its 50-week moving average, and the May 2019 recovery was followed by pandemic-crash volatility without a new bear market low being established.
This makes the indicator useful, but not definitive.
For the current cycle, the takeaway is simple: the recent recovery is encouraging, but more substantial historical confirmation lies above the $82,000 level. A weekly close above it would bolster the argument that Bitcoin's June low marked the bottom. Until then, history shows, the recovery remains unconfirmed.
end-content