Ford's stock price surged 20% in a single day: The traditional automaker is also pivoting to AI

marsbitОпубліковано о 2026-05-15Востаннє оновлено о 2026-05-15

Анотація

Ford's stock surged 20% after it announced the creation of a new subsidiary, Ford Energy, investing $2 billion to build a 20 GWh energy storage system plant. Morgan Stanley valued this business at $10 billion, betting its margins could far exceed Ford's traditional auto division. The valuation is tied to a projected 49 GW U.S. power shortage by 2028, driven by booming data center demand concentrated in four key corridors. However, the massive subsidies funding this AI infrastructure boom, like a $3.3 billion package for a Meta data center in Louisiana, face growing scrutiny. Public opposition to local data centers (70%) now exceeds that for nuclear plants due to their strain on grids, limited job creation, and high fiscal cost. Ford's $8 billion market cap gain hinges on the continuation of this ecosystem: sustained subsidies, unmet power demand, and manageable public backlash. If any of these constraints—physical power shortages, state budget limits, or voter opposition—tightens, a widespread repricing could follow.

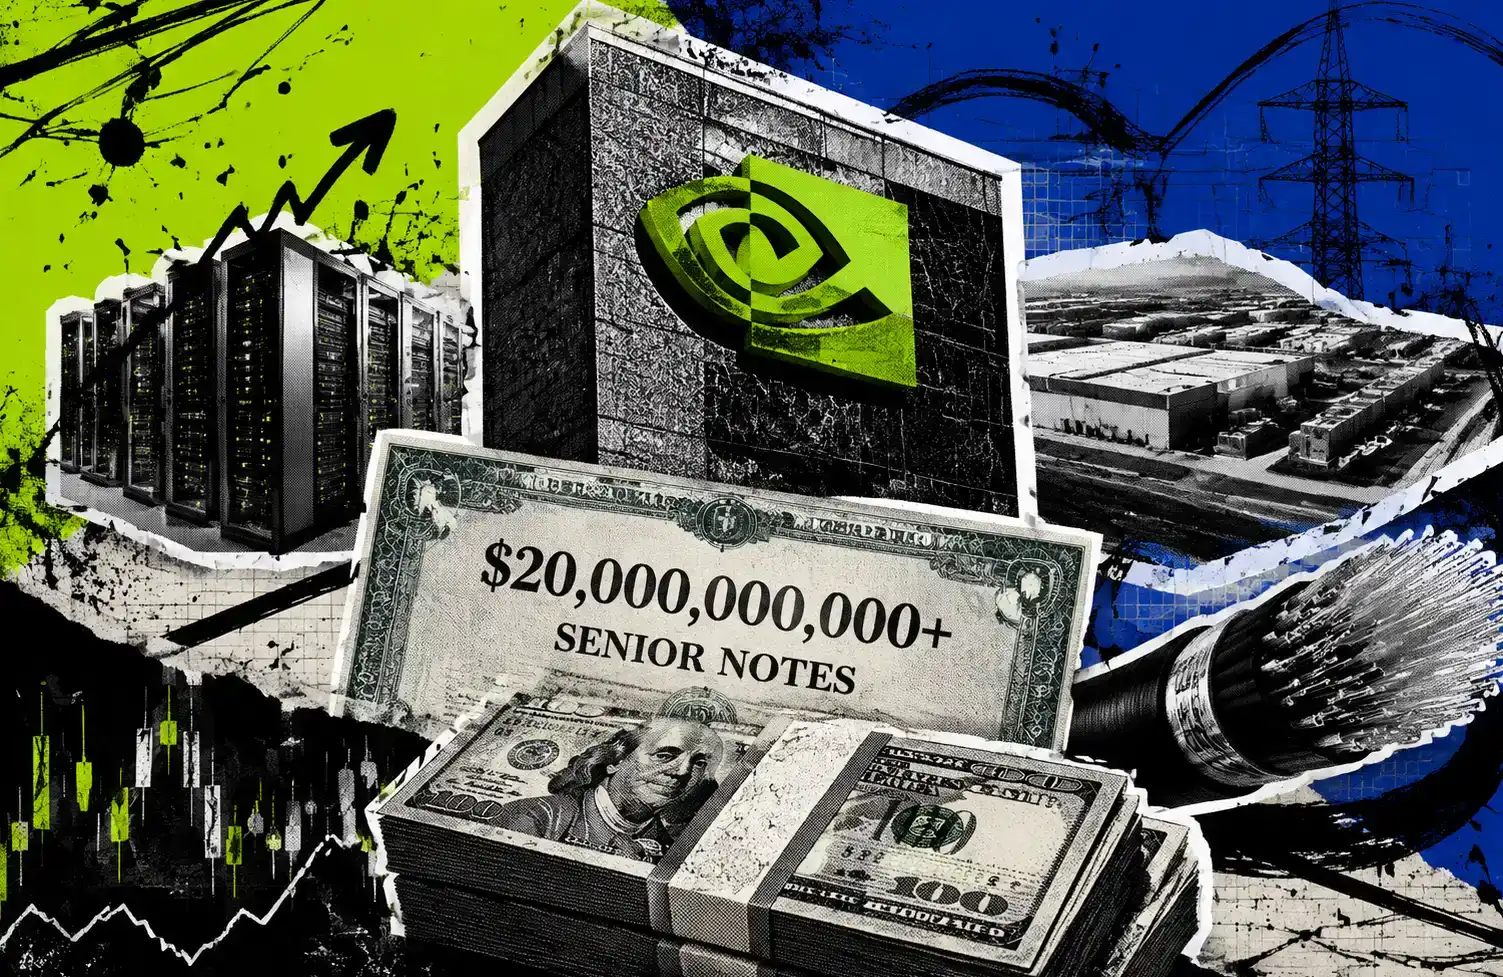
On May 11th, Ford established its wholly-owned subsidiary Ford Energy, investing $2 billion to transform its Glendale factory in Kentucky, targeting an annual production capacity of 20 GWh for energy storage systems. The next day, Morgan Stanley analyst Andrew Percoco valued this standalone business unit at $10 billion. The market reaction was immediate: Ford's stock price rose from $11.99 to $14.48 over two trading days, adding approximately $8 billion to its market cap.

The story up to this point resembles the standard script of another "traditional automaker being repriced by AI." But a look at the supply-side ledger reveals another name: the state of Louisiana.

What is the market revaluing?

Morgan Stanley's $10 billion valuation for Ford Energy was not pulled out of thin air. Percoco's report assumed Ford Energy would achieve a 25% gross margin and $346 million in EBIT by 2028, then applied the price-to-sales multiples of leading energy storage companies to work backwards. Compared to the profit structure of Ford's existing business, this is an entirely different species.

Ford's 2024 financial report shows that its Ford Blue internal combustion engine division generated annual revenue of $145.4 billion with an EBIT of only $5.28 billion, a margin of 3.6%. Industry estimates place the per-vehicle gross margin for selling an F-150 in the 10-13% range. The energy storage industry, meanwhile, operates on a completely different scale. According to various company reports, Tesla's Megapack business boasts a 26.2% gross margin, Sungrow Power's energy storage business exceeded 28% in the first half of 2024, and pure-play system integrator Fluence sits between 12-14%. Morgan Stanley is betting that Ford's cost structure—building its own LFP battery cells and retrofitting existing EV factories—can place it within the leading range, with a per-GWh gross margin at least double that of selling an F-150.

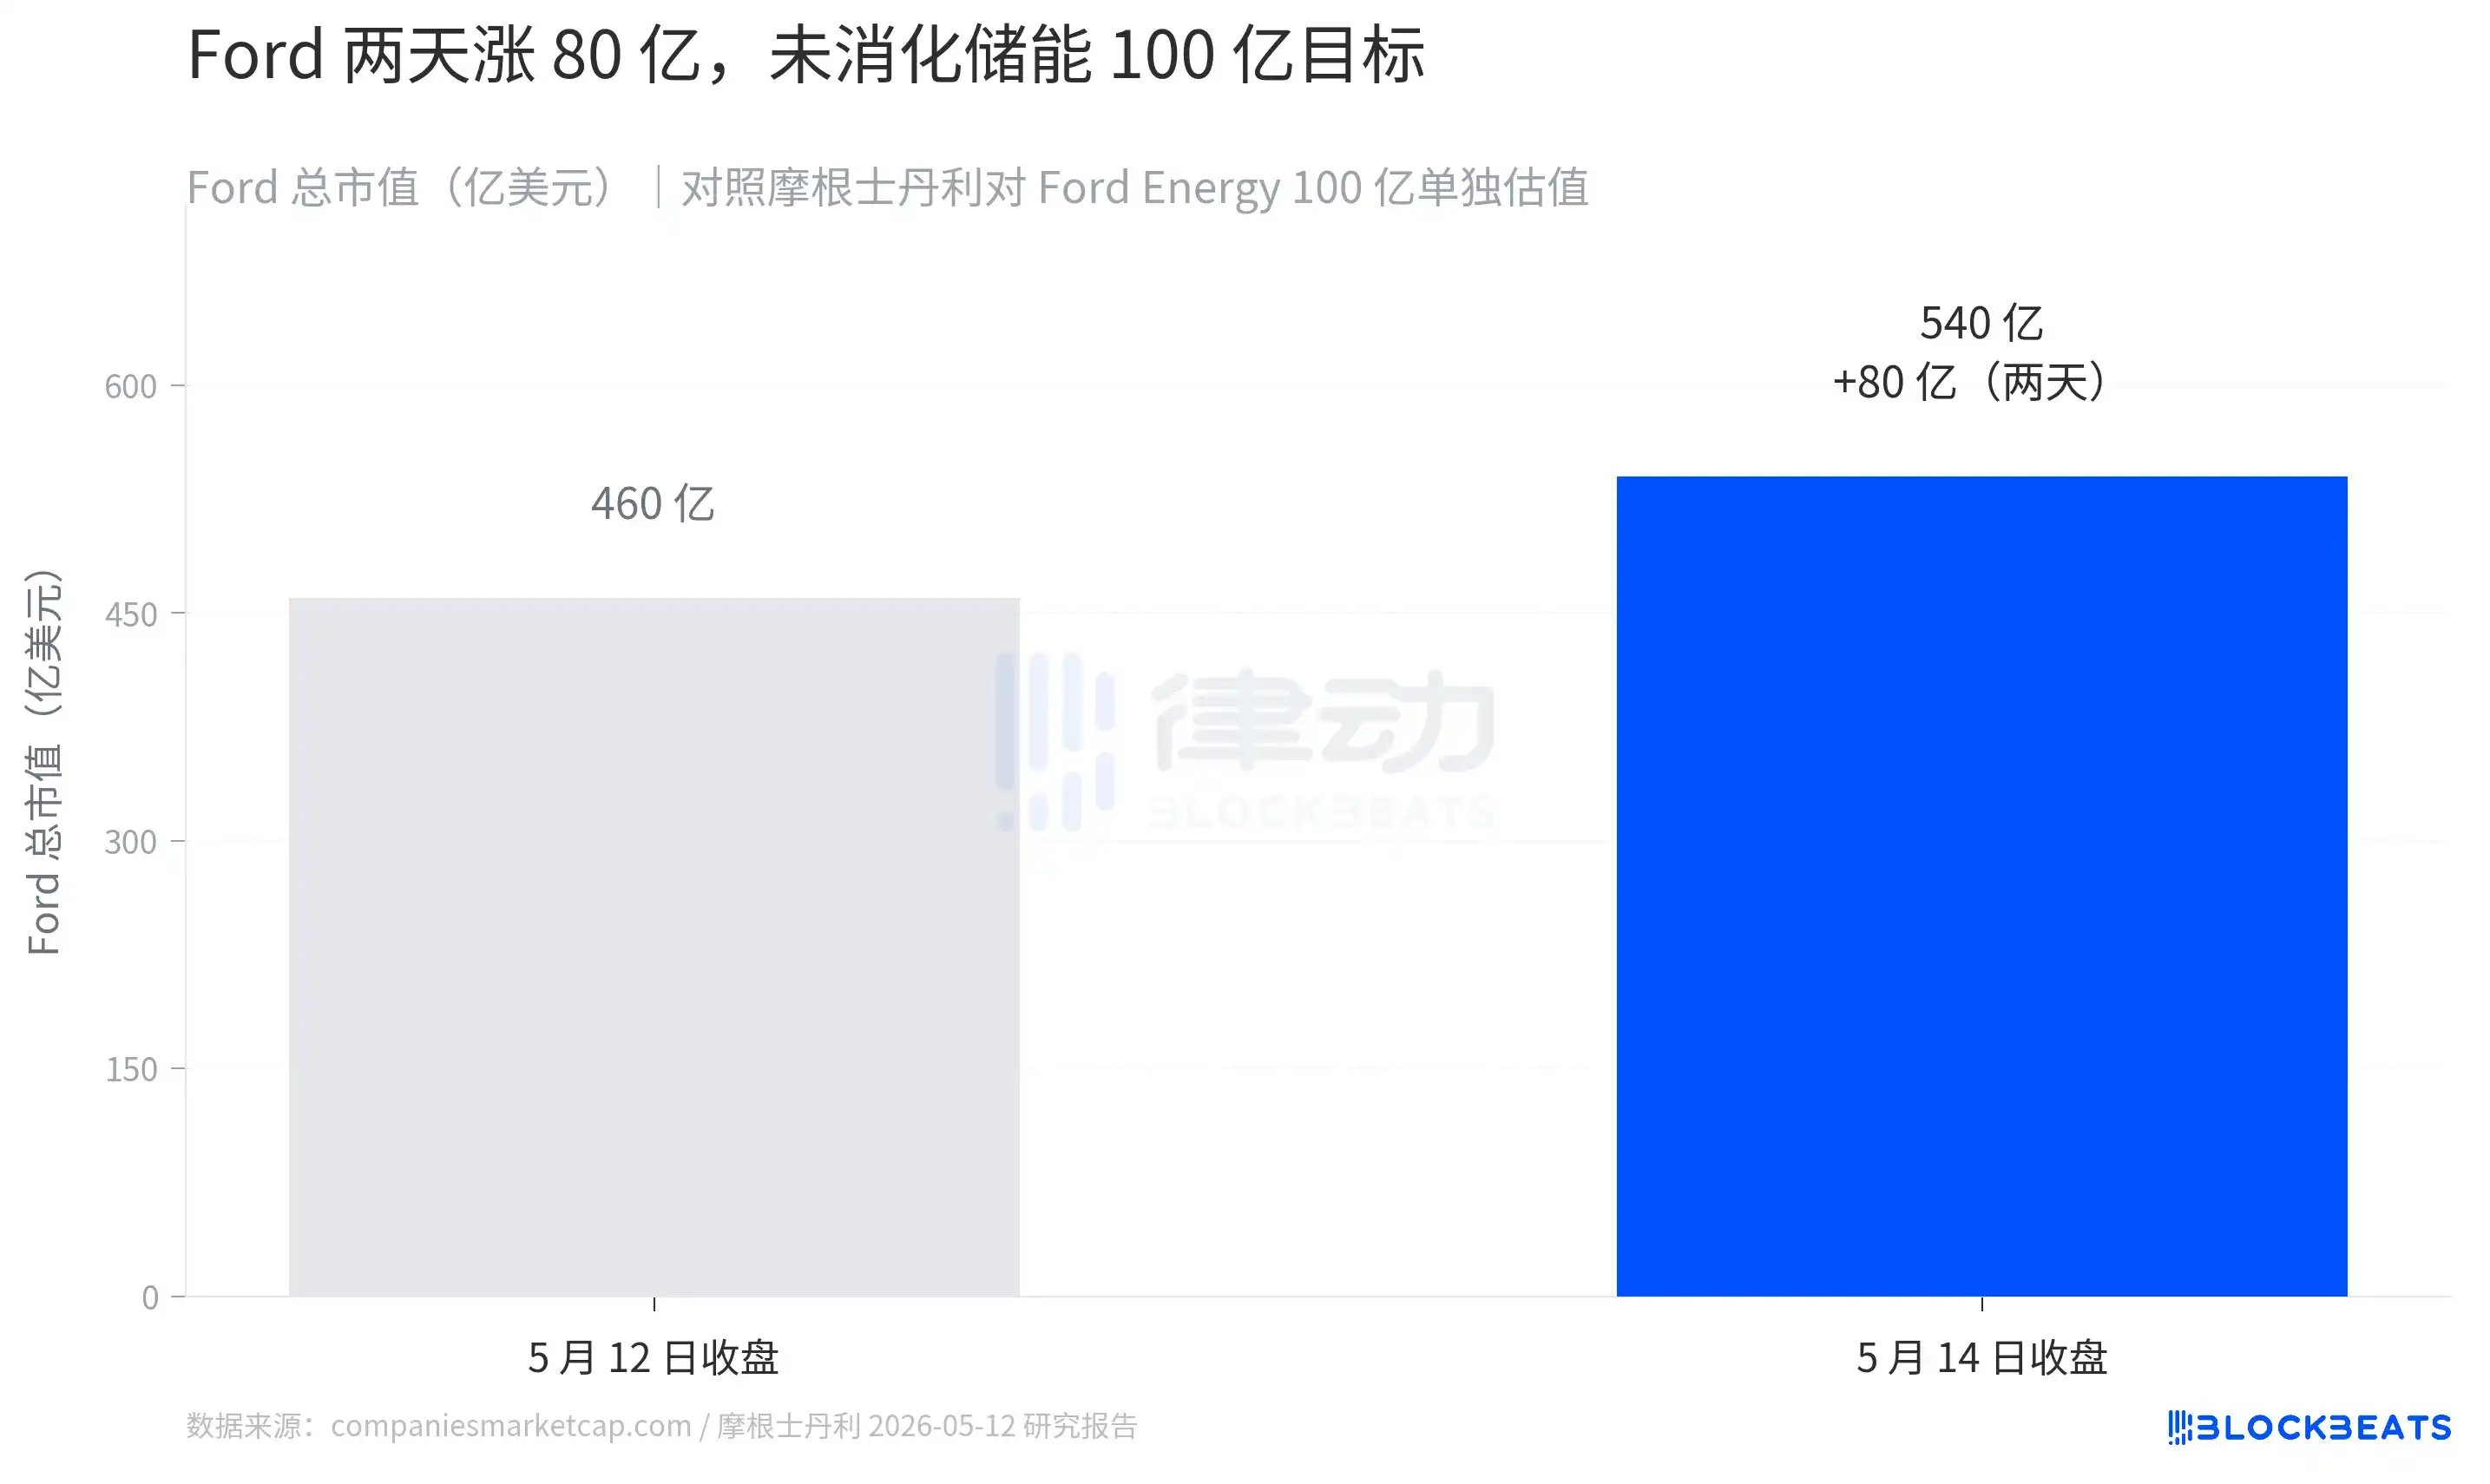
This is the reason the market is willing to pay a premium. But the market has only priced in $8 billion so far. Morgan Stanley's $10 billion target implies an additional $2 billion not yet digested. The revaluation is in its early stages.

To absorb that remaining $2 billion, Ford Energy needs to deliver on capacity, contracts, and pricing. Production capacity is expected only in the second half of 2027, while contracts depend on downstream buyers—those regions scrambling most aggressively for electricity.

The Four Corridors

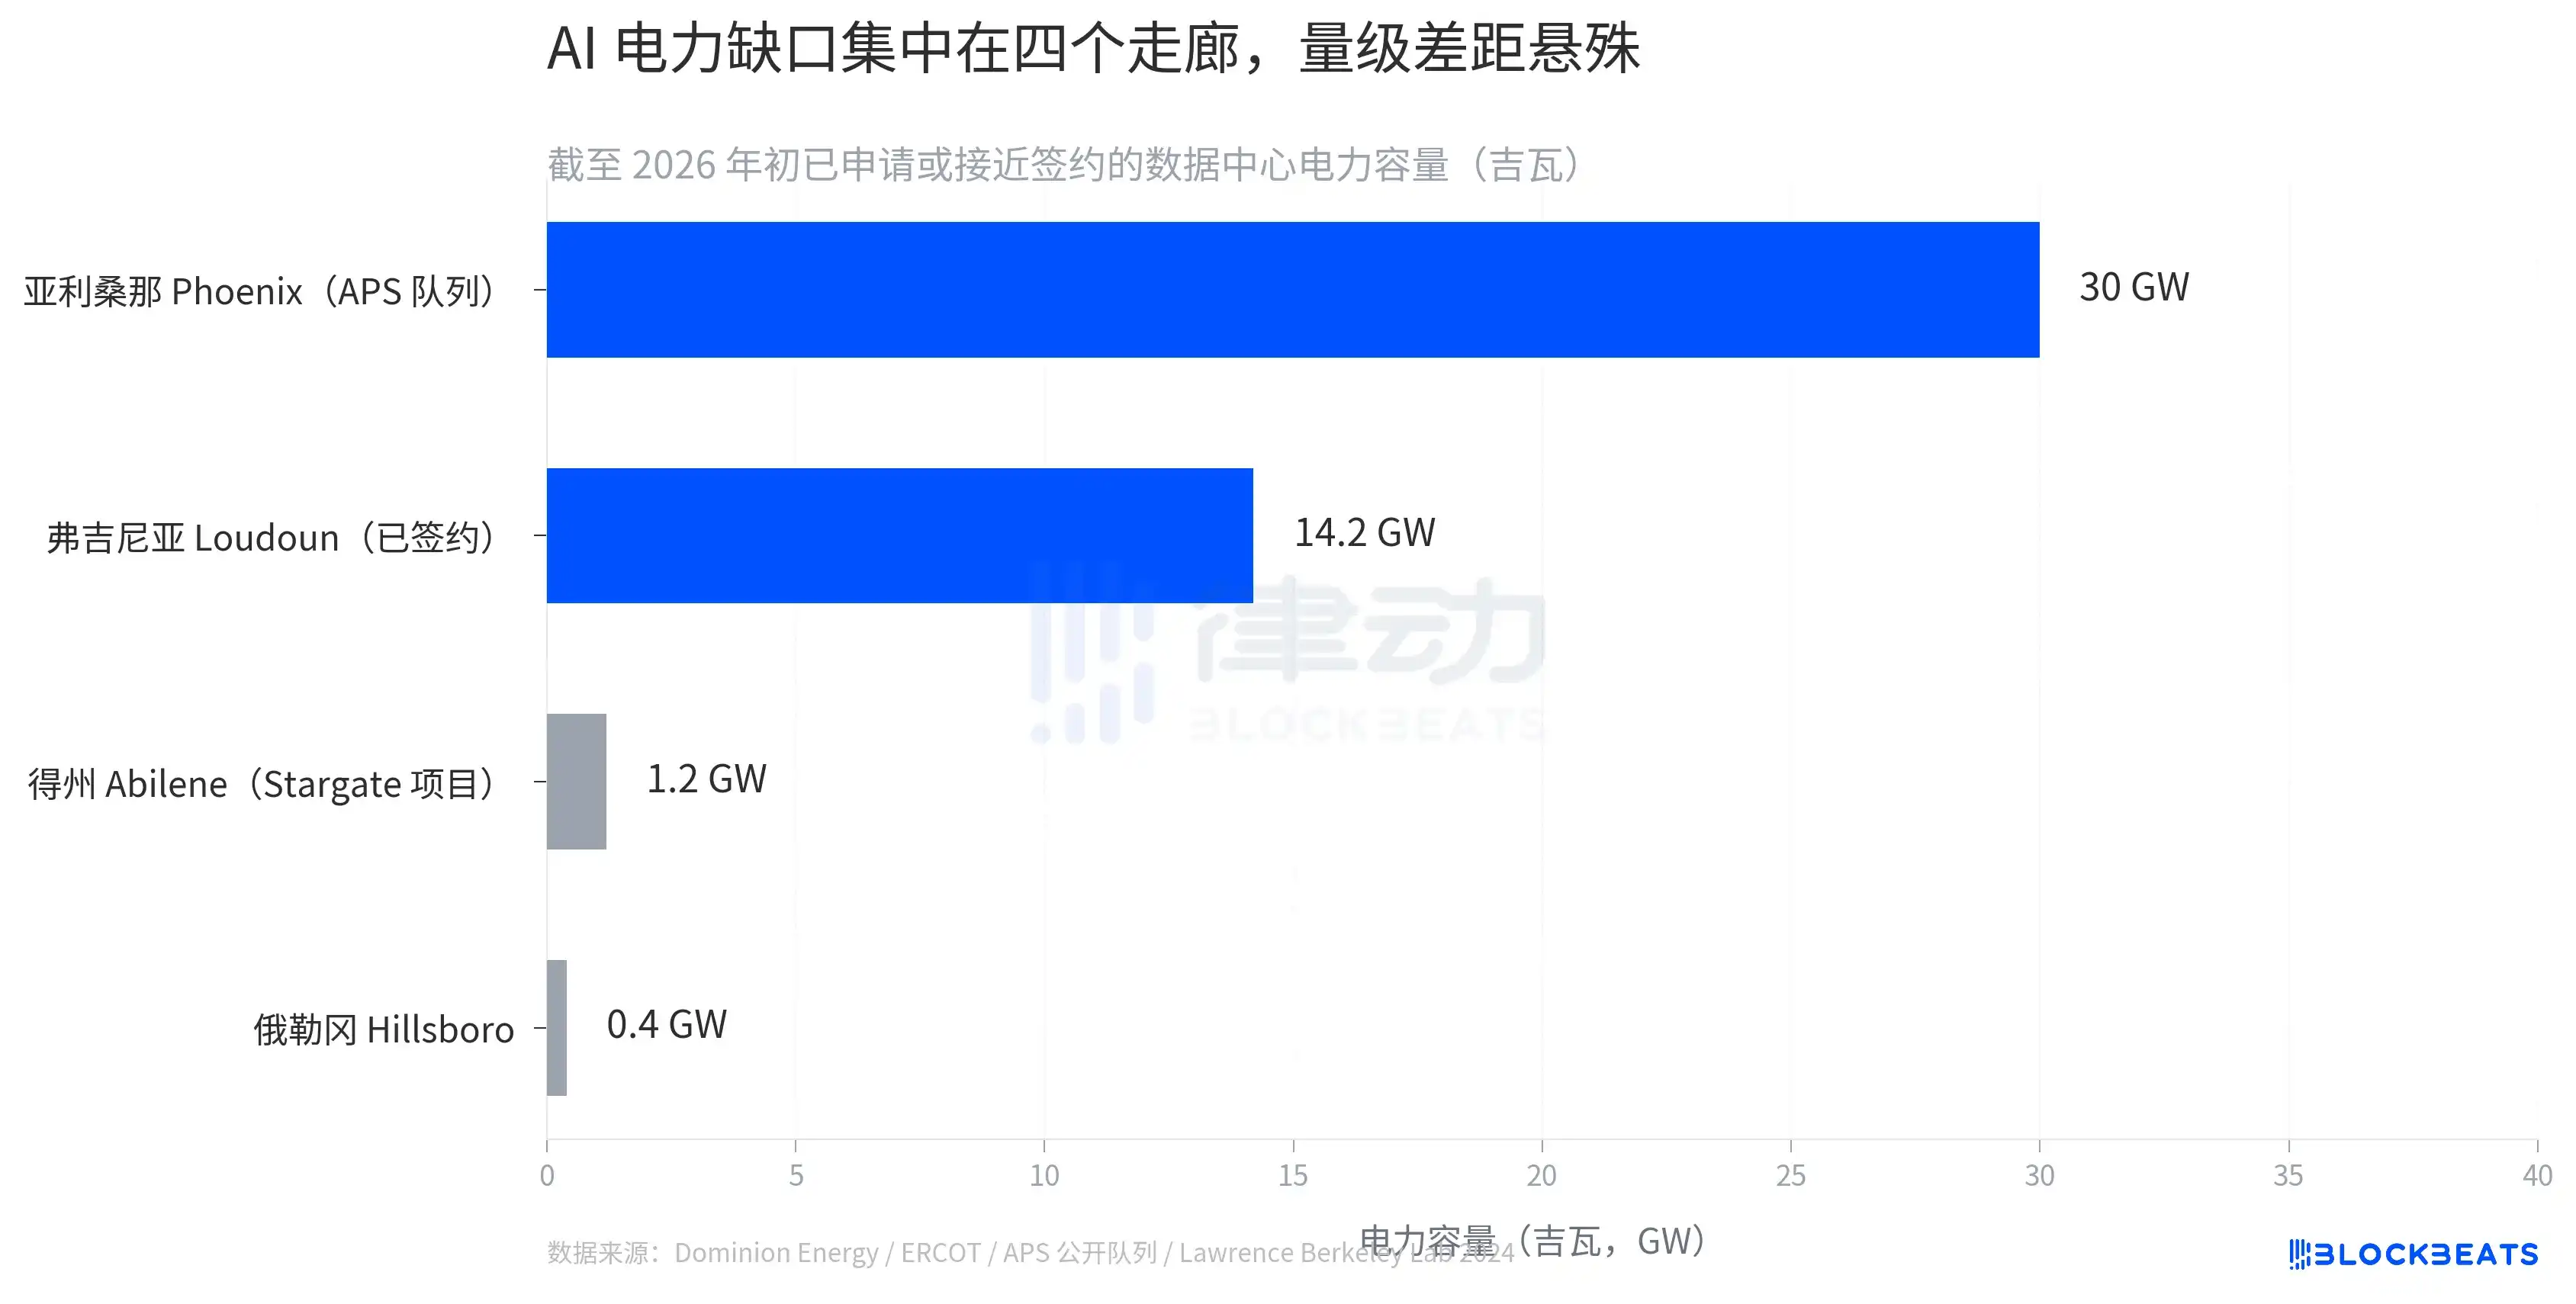
In the same research report, Morgan Stanley provided another figure. U.S. data center installed power capacity was 40 GW in 2024 and is projected to reach 79 GW by 2027. By 2028, a gap of approximately 49 GW is expected between demand and supply, representing a 20% shortfall. This gap will not be evenly distributed across 50 states.

Based on currently public data center power applications, the gap is concentrated in four corridors. The APS service area in Phoenix, Arizona, has a backlog of 30 GW in its queue. Loudoun County, Virginia, has capacity either signed or nearing signature of 14.2 GW. In Abilene, Texas, the OpenAI-led Stargate project alone requires 1.2 GW. Hillsboro, Oregon, has another 0.4 GW. The figures differ in scope: Phoenix's 30 GW includes projects in utility queues yet to be finalized, while Loudoun's 14.2 GW represents actual capacity close to being contracted.

This is the demand-side foundation for Ford Energy's $10 billion valuation. When a region's grid capacity growth can't keep pace with data centers' electricity grab, space for energy storage arbitrage is created. On one side are training loads during peak hours that are almost impossible to cut, and on the other is a supply curve the grid cannot instantly respond to. In the middle lies the deterministic cash flow for energy storage providers.

But grabbing electricity comes at a cost. The question is, who pays?

The Bill Lands in Louisiana

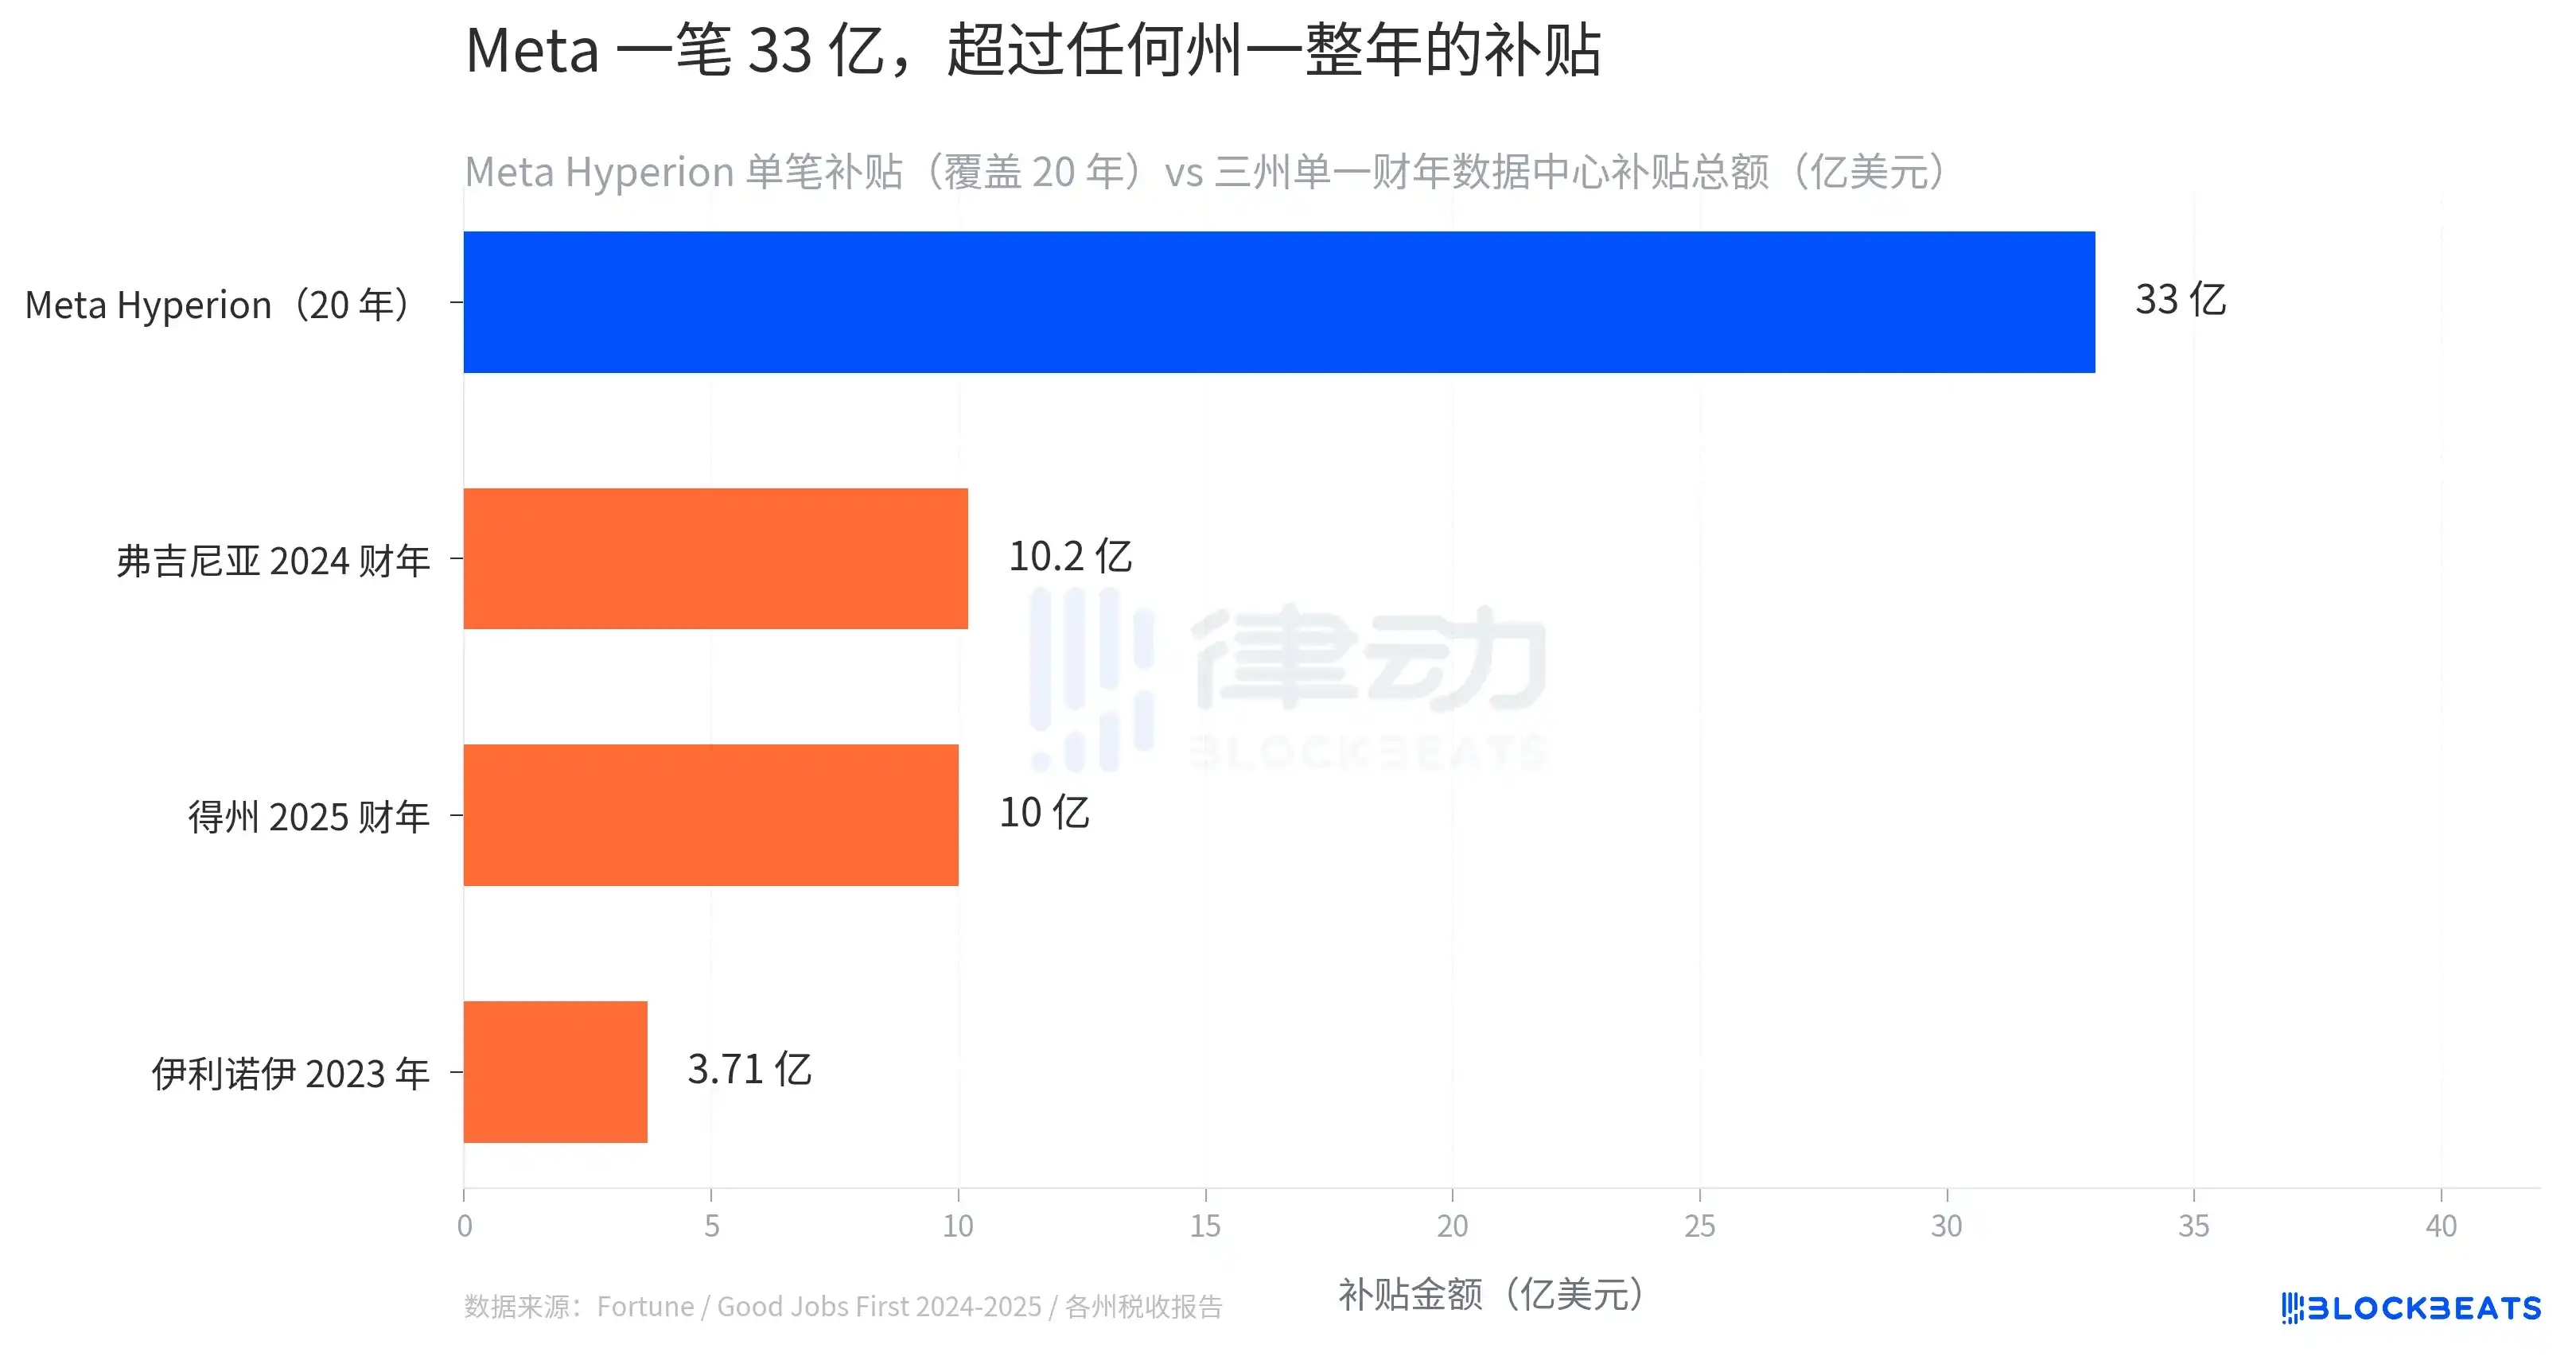
On May 14th, Fortune's front page reported on Meta's Hyperion project in Richland Parish, Louisiana. This flagship data center, Meta's bet on "AI advantage," costs $10 billion. In July 2024, the Richland Parish Commission approved sales and use tax exemptions totaling $3.3 billion, covering 20 years.

This abatement exceeds the combined police budgets of the state of Louisiana for seven years.

Meta also secured a 60% local property tax exemption through a PILOT agreement, conditional on hiring 300 local permanent positions. This project's predicted power consumption could account for 20% of Louisiana's total electricity usage.

A more crucial comparison lies across state lines. Texas's total data center sales tax exemption losses for the 2025 fiscal year amounted to about $1 billion, making it the state's costliest industry subsidy. Virginia's was $1.02 billion in FY2024, and Illinois's was $371 million in 2023. The $3.3 billion subsidy for Meta's single project exceeds any single state's total annual data center subsidies.

This is not an isolated case. According to Good Jobs First, at least 36 states have authorized data center sales tax exemptions through specific legislation, with only 11 publicly disclosing beneficiary company names. Official calculations in some states are more direct: for every dollar given in data center tax breaks, state coffers incur a net loss of 52 to 70 cents. The $8 billion increase in Ford's valuation is built on the implicit assumption that "this subsidy arms race will continue."

The continuation of this subsidy arms race depends on state legislators' ability to explain why an abatement exceeding seven years of police budgets is justified. This is becoming increasingly difficult.

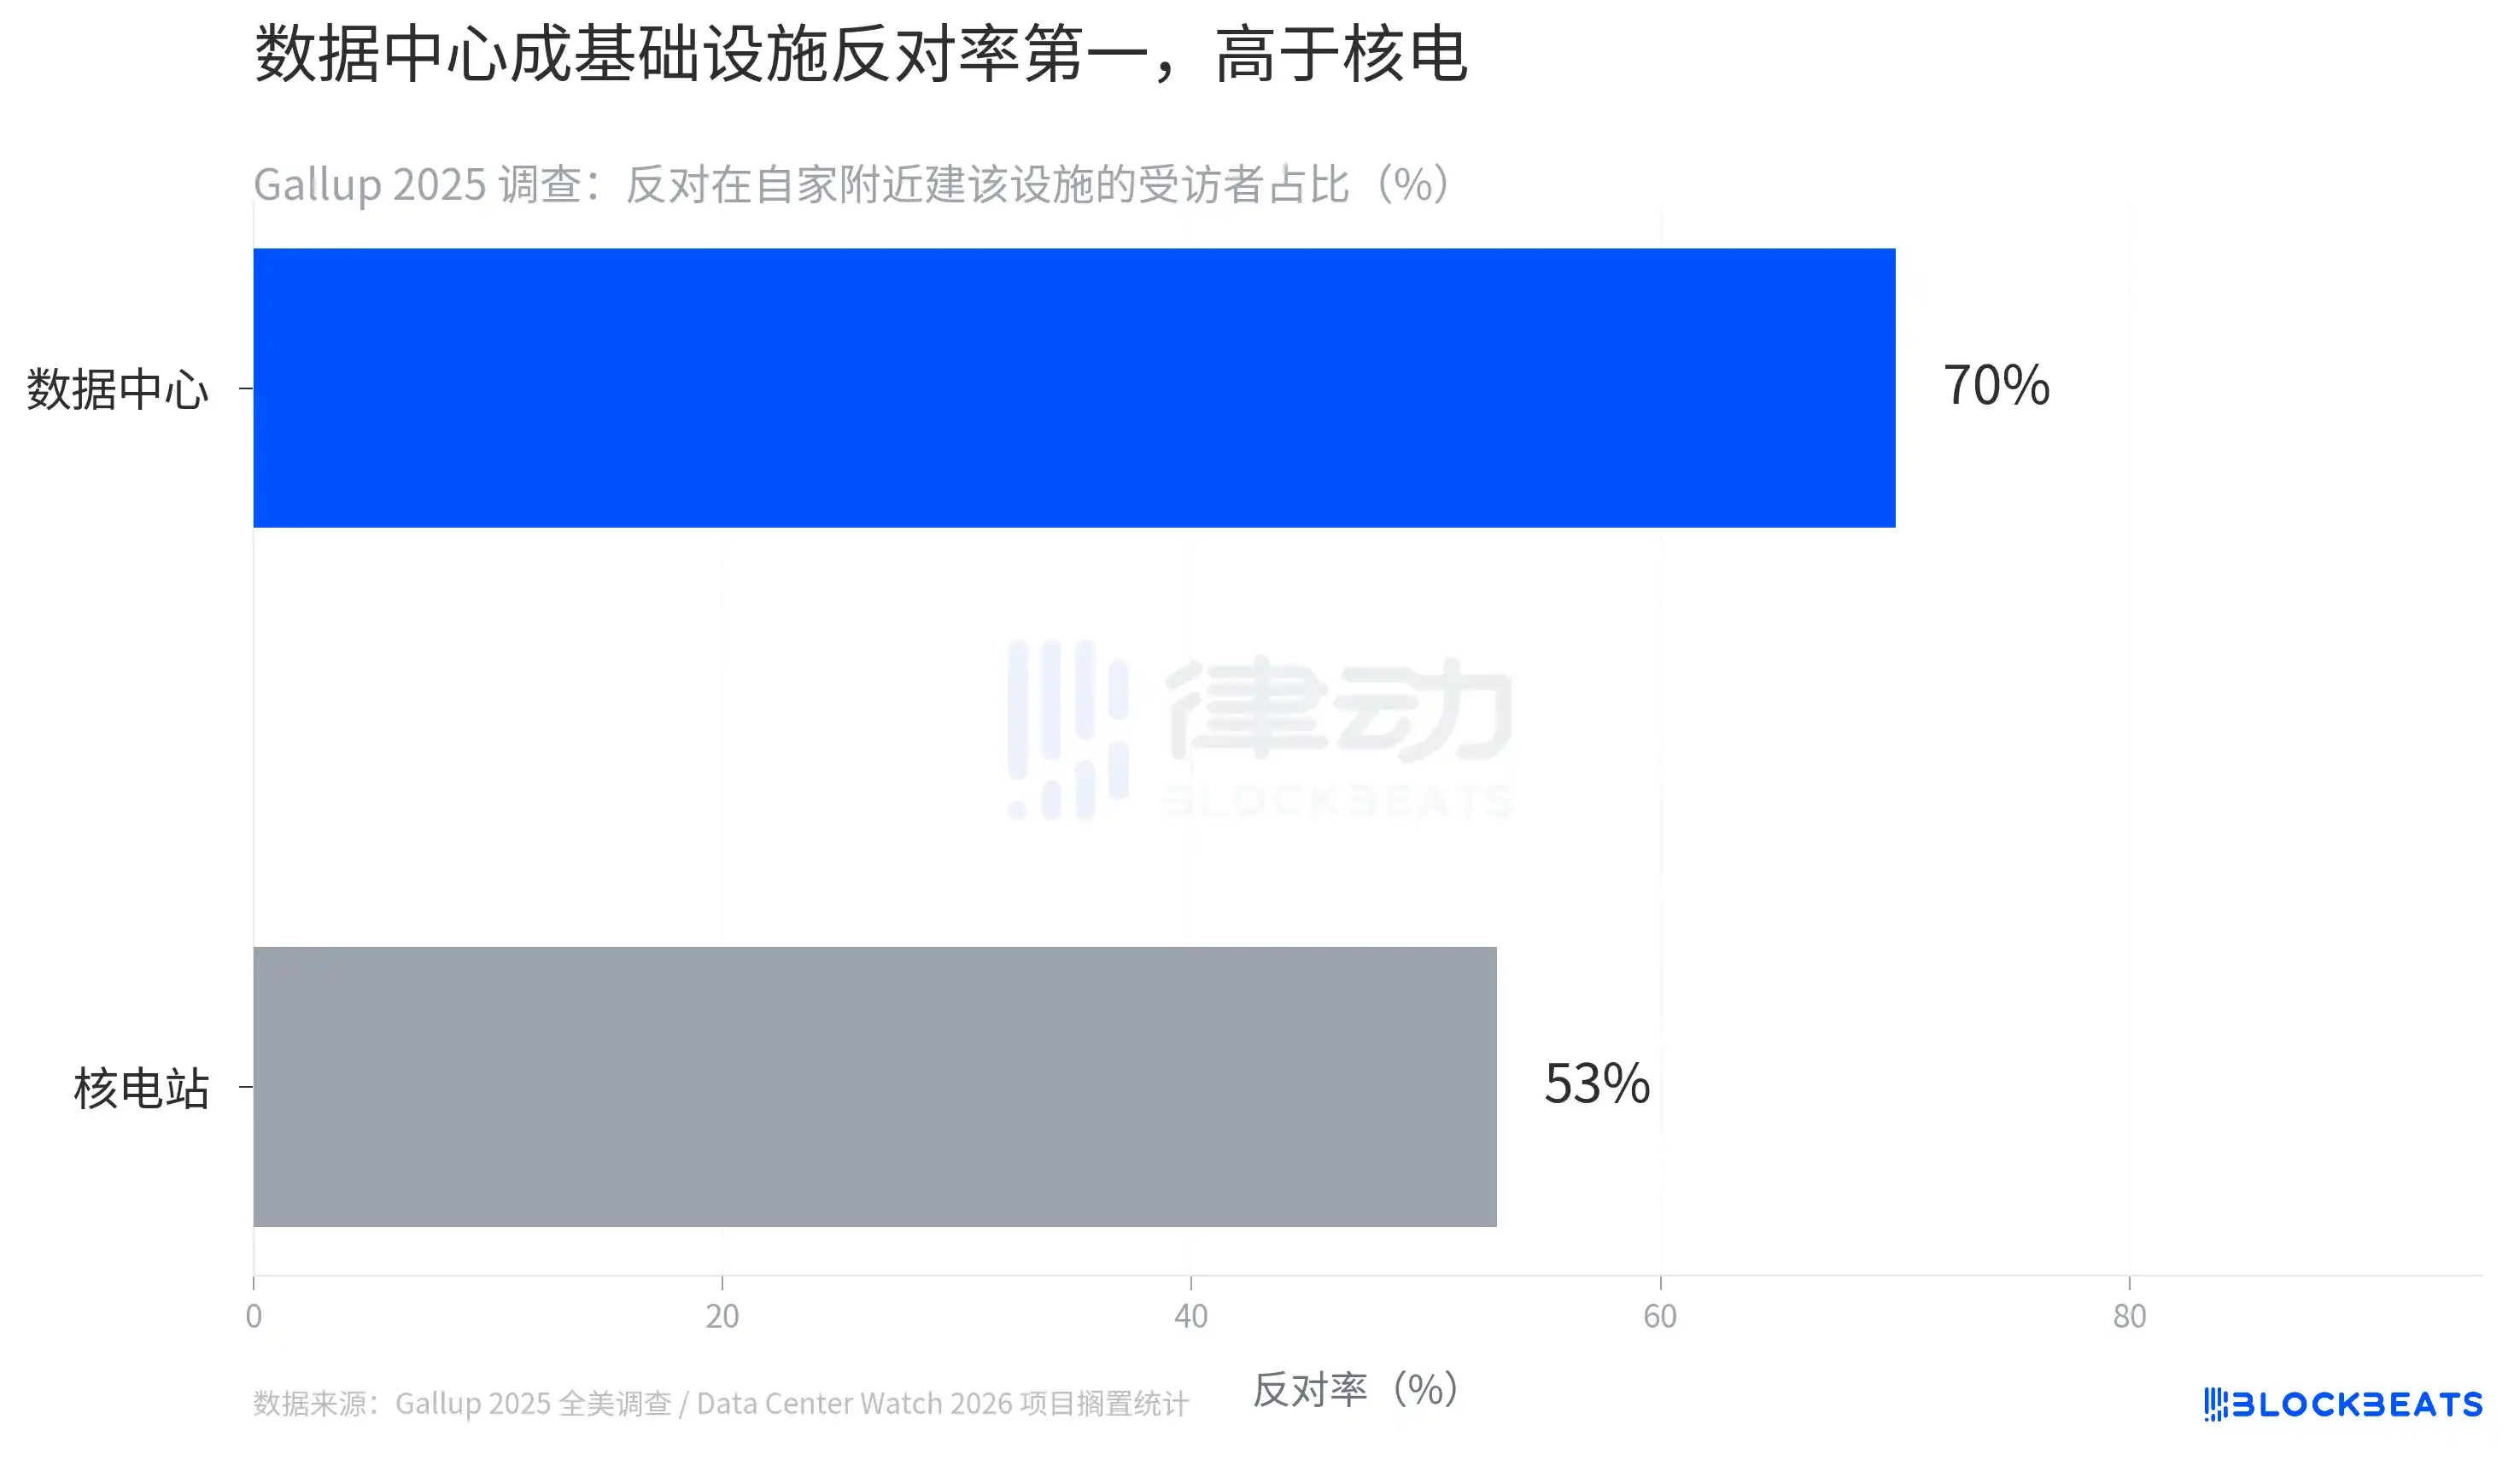
Data Center Opposition Rates Now Exceed Nuclear Power Plants

A 2025 Gallup national survey shows 70% of respondents oppose building a data center near their homes. The opposition rate for nuclear power plants in the same survey is 53%. Data centers are now the most opposed-to infrastructure in the United States.

This is not an abstract number. Data Center Watch's database as of early 2026 shows 69 jurisdictions have halted approvals or rejected data centers through local referendums or moratorium resolutions, stalling $64 billion in planned projects. In Loudoun County, Virginia, data center tax breaks caused a $267 million loss for the public school system in 2024, a fact now entering voters' consciousness.

The reasons data centers are disliked are more complex than those for nuclear plants. Nuclear plants are typically tens of kilometers from residential areas, while data centers hug urban edges. They consume water for cooling, increase grid load, generate low-frequency noise, yet provide local employment mostly in the hundreds, far lower than the job density of steel mills or auto plants. Hyperion's 326 operational jobs for $3.3 billion in abatement equates to a fiscal cost of $10 million per job. The room for explanation by local governments is narrowing.

The path to realizing Ford Energy's $10 billion valuation requires this grid to keep running, subsidies to hold, the electricity grab to proceed as usual, and opposition not to translate into legal mandates. If any link weakens, repricing will follow.

Ford's $8 billion gain, Meta's $3.3 billion subsidy, Phoenix's 30 GW queue, and the 70% opposition rate are readings from four cross-sections of the same grid. They remain disparate data points for now. Once one hard constraint emerges—whether physical power shortage, state fiscal breach, or public vote—the others will be repriced simultaneously.

Пов'язані питання

QAccording to the article, what is the estimated valuation given by Morgan Stanley for Ford's new energy subsidiary 'Ford Energy', and what key assumptions underpin this valuation?

AMorgan Stanley analyst Andrew Percoco gave Ford Energy a separate valuation of $10 billion. The valuation is based on the assumptions that Ford Energy will achieve a 25% gross margin and $346 million in EBIT by 2028, and that it will be valued using the price-to-sales multiples of leading energy storage companies like Tesla.

QWhy is the energy storage business considered significantly more profitable than Ford's traditional automotive business, based on the figures provided?

ABased on 2024 financials, Ford's Blue (internal combustion engine) division had an EBIT margin of only 3.6%. In contrast, the energy storage industry shows much higher profitability: Tesla's Megapack business has a gross margin of 26.2%, and Sungrow's energy storage business exceeded 28% in the first half of 2024. Morgan Stanley estimates that the gross margin per GWh for Ford Energy could be at least double that of selling an F-150 truck.

QThe article states that a massive power supply-demand gap for data centers is projected by 2028. What is the estimated size of this gap, and where is the demand primarily concentrated?

AMorgan Stanley projects that by 2028, the power demand from US data centers will reach about 79 GW, creating a supply-demand gap of approximately 49 GW. This demand is primarily concentrated in four key corridors: Phoenix, Arizona (30 GW in the utility queue); Loudoun County, Virginia (14.2 GW nearing contract); Abilene, Texas (e.g., the 1.2 GW Stargate project); and Hillsboro, Oregon (0.4 GW).

QWhat specific tax incentives did Meta secure for its Hyperion data center project in Louisiana, and how do these subsidies compare to those in other states?

AMeta secured a combined $3.3 billion in sales and use tax exemptions over 20 years for its Hyperion project in Richland Parish, Louisiana. This single project's subsidy exceeds the total annual data center tax exemptions for any other state, such as Texas's ~$1 billion in FY2025 or Virginia's $1.02 billion in FY2024.

QWhat is the primary public sentiment towards building new data centers in the US according to the article, and what are some key reasons behind this opposition?

AA 2025 Gallup poll cited in the article shows that 70% of respondents oppose building a data center in their local area, making it the most opposed type of infrastructure (more than nuclear power at 53%). Key reasons for opposition include high water and electricity consumption, low-frequency noise, proximity to residential areas, and the perception of providing relatively few local jobs (often in the hundreds) compared to the massive scale of tax incentives received.

Пов'язані матеріали

Will the Next Crypto Bull Run Start with On-Chain Trading of SpaceX?

This article presents a scenario-based forecast for the crypto industry from 2026 to 2029, arguing that the next major cycle will be driven not by technological narratives but by legal access to real-world assets. The author predicts that by mid-2026, pre-IPO perpetual contracts for top private companies like SpaceX, OpenAI, and Anthropic on platforms like Hyperliquid will become the primary gateway for accessing quality assets, as most crypto-native tokens fail to capture real value. The much-hyped AI x Crypto intersection largely fails except for prediction markets, which thrive on betting on AI model supremacy. By 2027, public blockchain foundations are forced to choose between catering to retail speculation or building compliant infrastructure for institutions, with many opting for the latter. Growth in stablecoins and tokenized private credit/equity hits a "triple ceiling" due to regulatory and political uncertainty rather than market demand. The pivotal shift is forecast for 2028. A major liquidation event in pre-IPO perpetuals exposes the structural flaw of synthetic markets lacking a real underlying asset anchor. In response, regulatory changes finally allow the public solicitation of private securities resales to verified accredited investors. This creates a legitimate secondary market for real company equity, which then becomes the core asset class of the new bull market, relegating synthetic perps to a niche role. By 2029, the industry becomes "boring" but foundational. Tokens without claims on real cash flows or assets cease trading. Stablecoin growth is steady but politically capped. Crypto infrastructure fades from view as it gets absorbed into traditional finance backends. The article's central thesis is that the key bottleneck for crypto's next phase is legal and regulatory channels for real asset ownership, not technology.

marsbit20 хв тому

Will the Next Crypto Bull Run Start with On-Chain Trading of SpaceX?

marsbit20 хв тому

The Value Distribution of Stablecoins

**Summary: The Value Distribution of Stablecoins** The article argues that stablecoins are evolving from mere trading tools into broader channels for dollar access. It divides the stablecoin ecosystem into four layers to analyze how value is distributed: 1. **Issuance Layer:** Mints stablecoins, holds reserve assets, and captures the spread between reserve yield and user costs (e.g., Tether, Circle). This layer currently earns the largest profit margin. 2. **Infrastructure Layer:** Connects stablecoins to the traditional financial system, handling fiat on/off-ramps, banking integration, compliance (KYC/AML), and asset management (e.g., Bridge, BVNK). This is the "unglamorous" but critical work, building the essential bridges between crypto and real-world finance. 3. **Acquiring/Distribution Layer:** Integrates stablecoins into merchant systems, manages payment flows, and provides enterprise financial software (e.g., Stripe, Coinbase). They act as the access point for businesses. 4. **Application Layer:** The end-users and businesses that ultimately use stablecoins for payments, settlements, or as a store of value. They benefit from convenience but have little pricing power. The core thesis is that while the issuance layer currently dominates profits, the often-overlooked **infrastructure layer holds significant long-term potential**. The real challenge and barrier to mass adoption is not the on-chain transfer of stablecoins (which is simple), but the complex "last mile" integration into existing business workflows, banking systems, and regulatory frameworks across different countries. Companies in this layer are currently in a "land grab" phase, investing heavily to build networks, secure bank partnerships, and establish compliance pathways. While their position is currently pressured by the profitable issuers above and distribution platforms below, the article suggests that if stablecoins become a default financial rail for businesses, the infrastructure providers who have done the hard work of integration will ultimately gain strong pricing power and become entrenched, essential players.

marsbit7 год тому

The Value Distribution of Stablecoins

marsbit7 год тому

The Value Distribution of Stablecoins

The Value Distribution of Stablecoins The article argues that stablecoins are evolving from a mere trading tool into a broad "dollar channel." It analyzes the industry's value chain through four layers: 1. **Issuance Layer (e.g., Tether, Circle):** The top layer that mints stablecoins, holds reserve assets, and captures the thickest interest rate spread. 2. **Infrastructure Layer (e.g., Bridge, BVNK):** Connects stablecoins to the traditional financial system, handling critical but complex "dirty work" like fiat on/off-ramps, banking integration, compliance (KYC/AML), and cross-border settlement. 3. **Acquiring/Distribution Layer (e.g., Stripe, Coinbase):** Embeds stablecoins into merchant systems, manages payment flows, and integrates with enterprise software. 4. **Application Layer:** End-users and businesses that ultimately use stablecoins for payments, settlement, or storing value. The author posits that while the issuance layer currently captures the most profit, the most overlooked and potentially critical layer is infrastructure. The core challenge for stablecoin adoption isn't the on-chain transfer (which is simple), but bridging the gap between blockchain and the real-world financial system. This involves solving practical problems for businesses: fiat conversion, reconciliation, tax handling, and user onboarding. Infrastructure companies are currently in a difficult "land-grab" phase—building networks, securing banking relationships, and achieving compliance country-by-country. They face pressure from both the profitable issuance layer above and distribution platforms below. However, the author suggests this layer is building a crucial moat. Once stablecoins become a default business rail, the infrastructure players who have done the hard work of integration may gain significant, durable value and pricing power.

链捕手7 год тому

The Value Distribution of Stablecoins

链捕手7 год тому

Торгівля

Спот
Ф'ючерси
活动图片