Don’t Celebrate Bitcoin Yet: The Trend Is Still Bearish, And This Is Why

bitcoinistОпубліковано о 2026-03-21Востаннє оновлено о 2026-03-21

Анотація

Based on technical analysis, Bitcoin's recent rally above $75,000 is insufficient to confirm a bullish reversal, as the overall structure remains bearish. The daily chart shows BTC is consolidating within a rising channel, identified as a bear flag pattern, following a prior downtrend. This pattern previously led to a breakdown to $60,000 in early February 2026. A key resistance zone exists around $76,000, where BTC faced rejection. Currently trading near $70,000, a weekly close below this level could trigger a further decline toward $65,000. Analysis of the weekly timeframe using the Gaussian Channel indicator, which has accurately signaled major cycle bottoms in the past, suggests that the February low may not be the final market bottom. The indicator turned bearish after that low, a deviation from historical patterns where the transition preceded the bottom. Consequently, the trend remains cautiously bearish despite short-term rallies.

Bitcoin’s brief rally above $75,000 this week led to bullish optimism in some corners of the crypto market, but technical analysis shows the trend might still be bearish. A close look at BTC’s daily and weekly charts tells a more sobering story, one that shows that the crypto king might continue on a lower correction move in the coming days.

Bitcoin Is Still Trapped Inside A Bear Flag

Bitcoin’s price recovery into the mid-$70,000s this week is not enough on its own to confirm that Bitcoin is out of danger. According to crypto analyst CrypFlow, the bigger trend is starting to look constructive on higher timeframes, but the daily chart still shows a bearish structure that has not been invalidated. Until that changes, the latest bounce may be nothing.

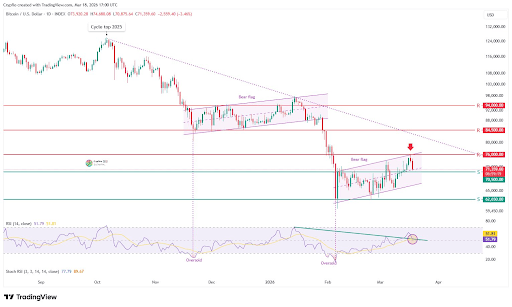
The daily candlestick timeframe chart shows that BTC has spent the past several weeks since early February consolidating within a rising channel structure. This is a pattern that, in the context of a prior downtrend, is technically classified as a bear flag.
Source: Chart from CrypFlow on X

The chart shows Bitcoin rallying into the upper boundary of the flag near the $76,000 area before getting rejected. That same region also lines up with a major resistance band marked on the chart, reinforcing the idea that bulls have not yet done enough to flip the structure. The BTC price has since fallen back toward the middle of the channel, leaving the leading cryptocurrency at a short-term decision point.

As seen in the chart below, a similar bear flag was formed from mid-November 2025 to late January 2026, and this eventually led to the breakdown to $60,000 in early February 2026.

The $70,000 To $76,000 Zone Now Matters More Than Ever

The current battle is taking place between the midline of the flag and the recent rejection zone is at $76,000. At the time of writing, Bitcoin is trading at $70,610, which places it close to support around $70,000. If BTC closes the week below $70,000, then the bear flag projects the price on the path to at least $65,000.

In a separate analysis, CrypFlow turned attention to the weekly timeframe and raised a more macro-level concern using Bitcoin’s Gaussian Channel indicator. This model looks at how Bitcoin has behaved across full market cycles.

According to the analyst, Bitcoin has never formed its cycle bottom before the Gaussian Channel flips from green to red. Each major bottom has come after that transition has already taken place. This pattern played out consistently in 2015, 2018, and again in 2022, where the final lows only arrived once the channel had fully turned bearish.

Interestingly, the Gaussian Channel transitioned from green to red after Bitcoin’s low in early February, not before. Although the Bitcoin price is still holding above $60,000 for now, the implication is that this level may not be the final bottom.

BTC trading at $70,379 on the 1D chart | Source: BTCUSDT on Tradingview.com

Трендові криптовалюти

Пов'язані питання

QAccording to the technical analysis, why is Bitcoin's trend still considered bearish despite its recent rally above $75,000?

ABecause the daily chart shows a bear flag pattern that has not been invalidated, and the price was rejected at a major resistance near $76,000, indicating the bullish structure is not yet confirmed.

QWhat is the significance of the $70,000 to $76,000 price zone for Bitcoin's near-term movement?

AThis zone represents a critical battle between support and resistance. A weekly close below $70,000 could project a price drop to at least $65,000, according to the bear flag pattern.

QWhat does the Gaussian Channel indicator suggest about whether Bitcoin has reached its cycle bottom?

AThe Gaussian Channel transitioned from green to red after February's low, not before. Historically, major bottoms have only occurred after this transition, suggesting the $60,000 level may not be the final cycle bottom.

QWhat pattern from late 2025 to early 2026 does the current price action resemble, and what was its outcome?

AIt resembles a bear flag pattern that formed from mid-November 2025 to late January 2026, which eventually led to a breakdown to $60,000 in early February 2026.

QWhat key level must Bitcoin break to invalidate the current bearish structure on the daily chart?

ABitcoin must break and hold above the major resistance zone near $76,000 to invalidate the bear flag structure and signal a potential trend reversal.

Пов'язані матеріали

Bitcoin Withdrawals Continue: 8 Years of Storage in a Coldcard Cold Wallet Ended in Zero

Coldcard Hardware Wallet Hacked: Losses Mount Due to Vulnerable Seed Generation A critical vulnerability in Coldcard hardware wallets has led to a continued wave of fund thefts. According to Galaxy Research, the total stolen has reached 1,367.05 BTC (approx. $88.6 million) from 4,585 addresses, a significant increase from the initial 594.5 BTC reported on July 30, 2026. Most of the stolen funds remain on the attackers' addresses. The issue is not with the current firmware, which Coinkite has updated, but with seed phrases generated on vulnerable devices between March 2021 and the release of fixed firmware versions. Due to a programmer error, devices switched from using a hardware random number generator to the software-based Yasmarang generator, which was initialized with publicly accessible data like the chip's serial number. This made the seed phrases predictable through offline brute-force attacks, meaning wallets remain at risk until funds are moved to a new wallet generated with the patched firmware. Affected devices include Mk2/Mk3 with firmware 4.0.1–4.1.9 (and up to 5.0.3), Mk4/Mk5 up to version 5.6.0, and Q models up to 1.5.0Q. The only exceptions are seeds created with a high-entropy method like at least 50 independent dice rolls or a strong unique BIP-39 passphrase. All other owners must generate a new seed on the fixed firmware and transfer their assets. A case highlighting the human impact involves a 39-year-old long-term investor who lost 2 BTC (approx. $130,000) in minutes. He had accumulated the Bitcoin over eight years through physical labor, viewing it as a financial lifeline and a retirement plan in a country suffering from hyperinflation. His story underscores that even conservative "buy and hold in cold storage" strategies can be compromised by such underlying technical flaws. From a technical perspective, this incident echoes historical failures where weak random number generators undermined cryptographic security, challenging the assumption that offline storage is automatically foolproof.

cryptonews.ru2 год тому

Bitcoin Withdrawals Continue: 8 Years of Storage in a Coldcard Cold Wallet Ended in Zero

cryptonews.ru2 год тому

Торгівля

Спот

Популярні статті

Як купити T

Ласкаво просимо до HTX.com! Ми зробили покупку Threshold Network Token (T) простою та зручною. Дотримуйтесь нашої покрокової інструкції, щоб розпочати свою криптовалютну подорож.Крок 1: Створіть обліковий запис на HTXВикористовуйте свою електронну пошту або номер телефону, щоб зареєструвати обліковий запис на HTX безплатно. Пройдіть безпроблемну реєстрацію й отримайте доступ до всіх функцій.ЗареєструватисьКрок 2: Перейдіть до розділу Купити крипту і виберіть спосіб оплатиКредитна/дебетова картка: використовуйте вашу картку Visa або Mastercard, щоб миттєво купити Threshold Network Token (T).Баланс: використовуйте кошти з балансу вашого рахунку HTX для безперешкодної торгівлі.Треті особи: ми додали популярні способи оплати, такі як Google Pay та Apple Pay, щоб підвищити зручність.P2P: Торгуйте безпосередньо з іншими користувачами на HTX.Позабіржова торгівля (OTC): ми пропонуємо індивідуальні послуги та конкурентні обмінні курси для трейдерів.Крок 3: Зберігайте свої Threshold Network Token (T)Після придбання Threshold Network Token (T) збережіть його у своєму обліковому записі на HTX. Крім того, ви можете відправити його в інше місце за допомогою блокчейн-переказу або використовувати його для торгівлі іншими криптовалютами.Крок 4: Торгівля Threshold Network Token (T)Легко торгуйте Threshold Network Token (T) на спотовому ринку HTX. Просто увійдіть до свого облікового запису, виберіть торгову пару, укладайте угоди та спостерігайте за ними в режимі реального часу. Ми пропонуємо зручний досвід як для початківців, так і для досвідчених трейдерів.

560 переглядів усьогоОпубліковано 2024.12.10Оновлено 2026.06.02

Як купити T

Обговорення

Ласкаво просимо до спільноти HTX. Тут ви можете бути в курсі останніх подій розвитку платформи та отримати доступ до професійної ринкової інформації. Нижче представлені думки користувачів щодо ціни T (T).

活动图片