Crypto Funds See Six Consecutive Weeks of Net Inflows, CLARITY Act Drives $858 Million Influx

marsbitОпубліковано о 2026-05-11Востаннє оновлено о 2026-05-11

Анотація

Global cryptocurrency investment products recorded a net inflow of $857.9 million last week, marking the sixth consecutive week of positive flows and the largest single-week inflow since April 24, according to CoinShares' latest report. The primary catalyst was legislative progress on the U.S. CLARITY Act, specifically the final compromise text for stablecoin yield provisions, alongside Bitcoin's price breaking above $80,000. U.S.-listed products dominated with $776.6 million in inflows, a significant jump from the prior week's $47.5 million. European markets also saw increased participation. Bitcoin products led with $706.1 million in inflows, while short-Bitcoin products experienced their largest weekly outflow of 2026, indicating unwinding bearish positions. Major altcoins like Ethereum, Solana, and XRP all saw renewed positive flows, with Ethereum reversing its prior week's outflow to attract $77.1 million. Total assets under management (AUM) climbed to $160 billion.

Author: James Butterfill (Head of Research, CoinShares)

Compiled by: Deep Tide TechFlow

Deep Tide Introduction: The latest weekly report from CoinShares shows that global crypto investment products recorded net inflows of $857.9 million last week, marking the sixth consecutive week of positive flows and the highest single-week inflow since April 24. The direct catalysts were the release of the compromise text for the stablecoin yield provisions in the CLARITY Act and Bitcoin's return above $80,000. Funds from the US market surged to $776.6 million from $47.5 million the previous week. Altcoin participation also expanded simultaneously, with ETH, SOL, and XRP all recording net inflows.

Progress on CLARITY Act Was the Core Variable Driving Fund Flows This Week

Global crypto investment products saw net inflows of $857.9 million last week, marking six consecutive weeks of positive flows and the largest single-week inflow since April 24. James Butterfill, Head of Research at CoinShares, directly attributed this acceleration to legislative progress on the CLARITY Act.

The timeline is clear: On May 1, Senators Tillis and Alsobrooks released the final compromise text for the stablecoin yield provisions; on May 4, the two lawmakers resisted lobbying pressure from the banking industry and maintained the compromise unchanged. A formal markup by the Senate Banking Committee is expected this week.

Bitcoin broke above $80,000 on Monday, reaching a new high since the February pullback. Total Assets Under Management (AUM) rose to $160 billion.

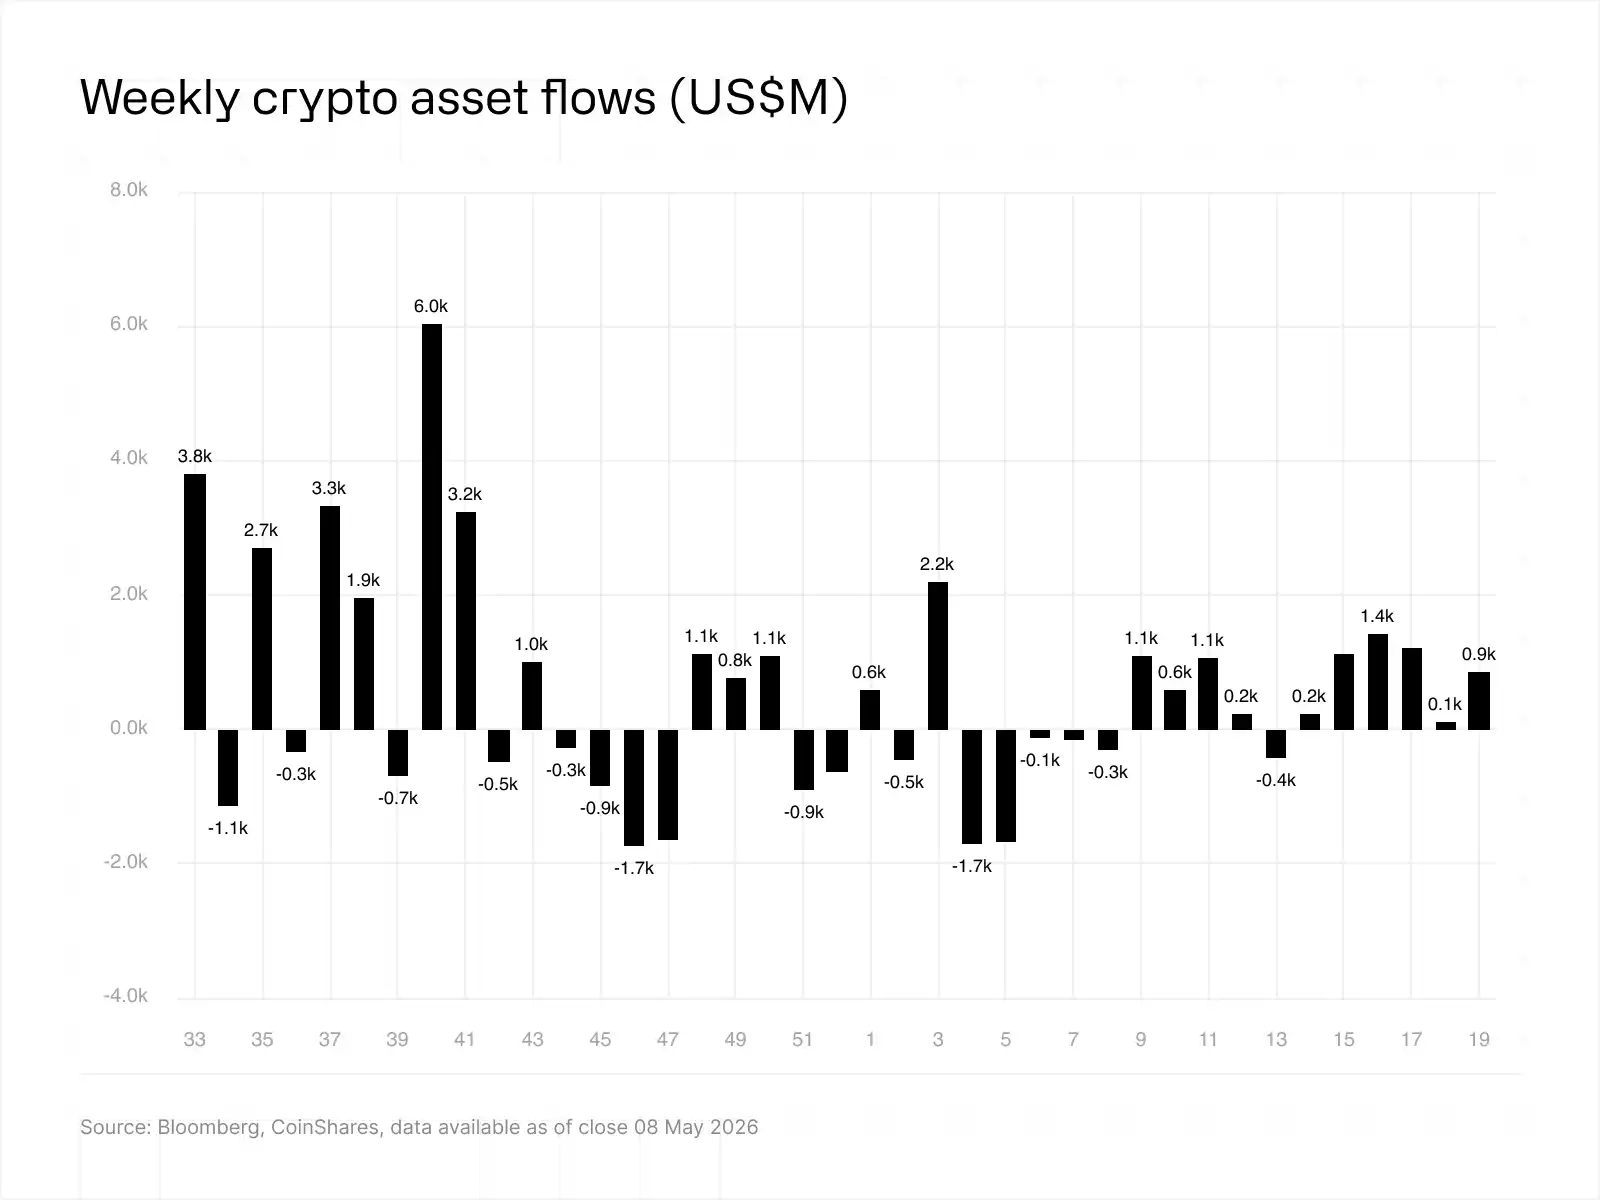
Caption: Weekly Global Crypto Asset Fund Flows, Source: CoinShares

US Fund Rebound Far Exceeds Previous Week

In terms of regional distribution, the United States dominated with net inflows of $776.6 million, showing a sharp rebound compared to the $47.5 million from the previous week.

Europe also showed improvement. Germany recorded $50.6 million, slightly higher than the previous week; Switzerland saw $21.1 million, and the Netherlands $5 million. Butterfill believes this indicates that while the buying momentum has returned to the US, there is also broader participation emerging in Europe.

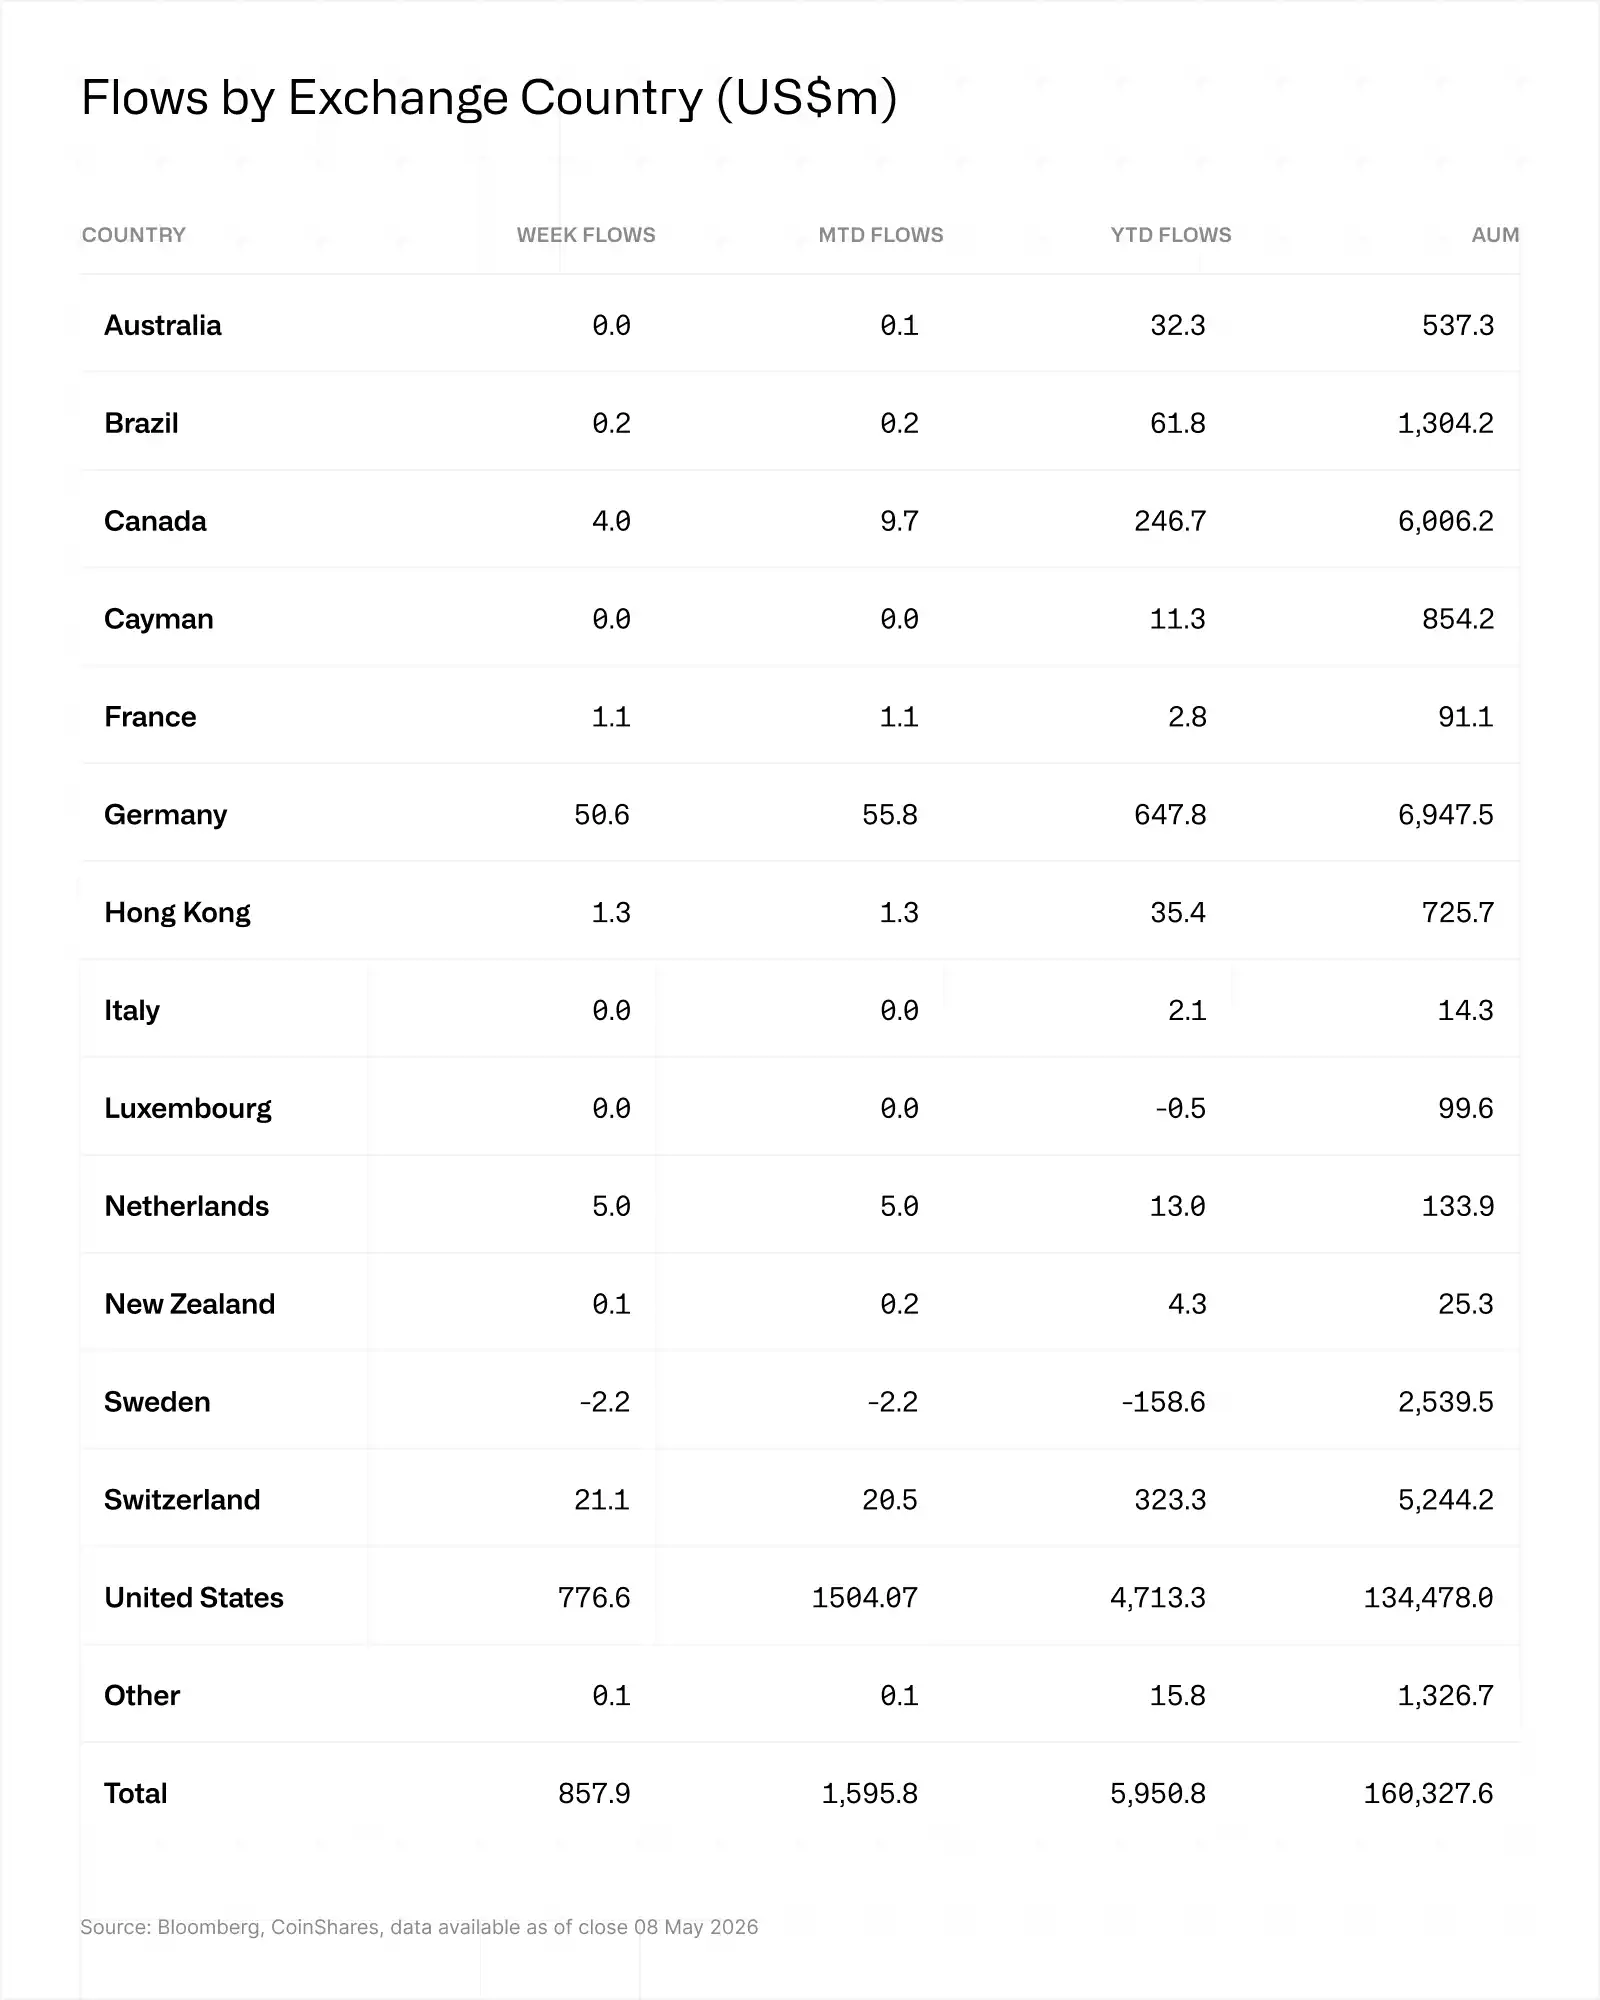
Caption: Fund Flows by Listing Country, Source: CoinShares

BTC Leads, Short Positions Accelerate Unwinding

Bitcoin products absorbed $706.1 million last week, bringing year-to-date cumulative inflows to $4.9 billion.

A noteworthy signal to unpack: Short-bitcoin products saw net outflows of $14.4 million last week, the largest single-week outflow in 2026. This suggests hedge positions are being unwound, indicating growing institutional confidence in the rebound.

Altcoins Rebound Across the Board, ETH Reverses Previous Week's Outflow

Ethereum products saw net inflows of $77.1 million, completely reversing the net outflow of $81.6 million from the previous week. Solana recorded $47.6 million, and XRP saw $39.6 million, both showing a significant acceleration compared to recent activity levels.

The only category with noticeable outflows was multi-asset products, with a net outflow of $5.5 million.

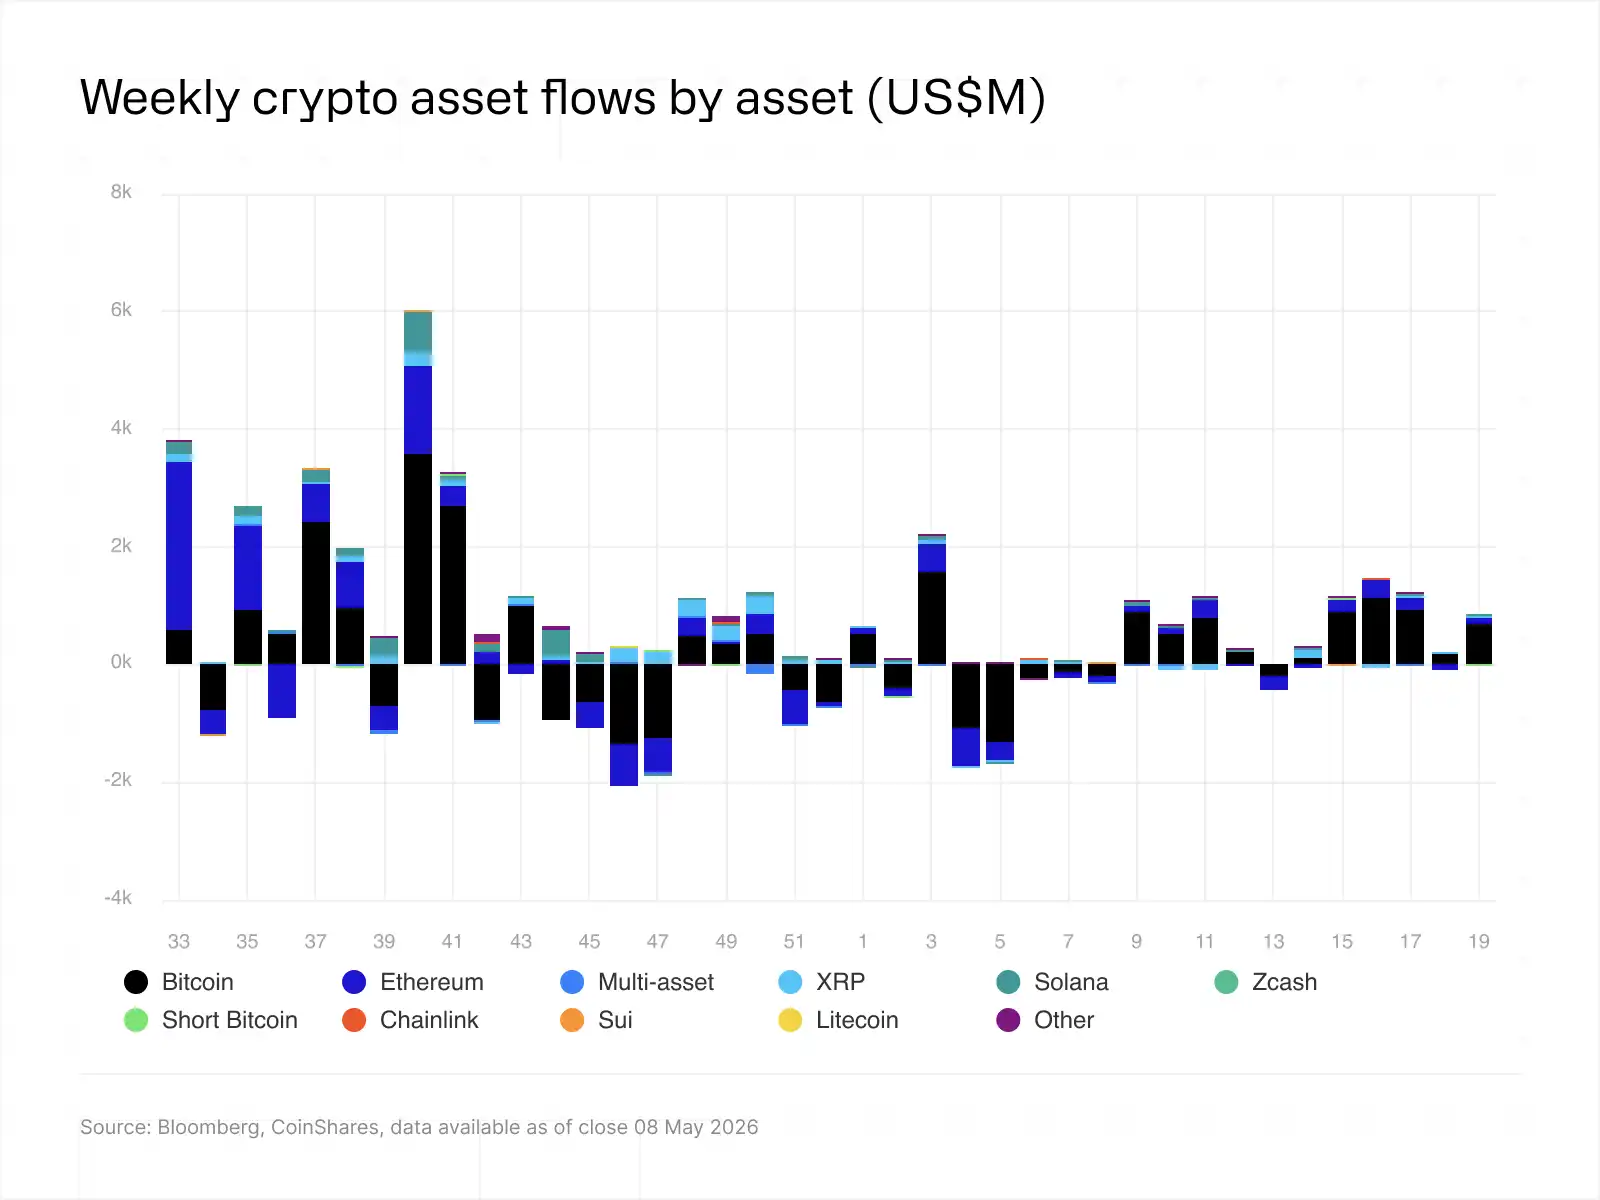
Caption: Weekly Fund Flows by Asset Class, Source: CoinShares

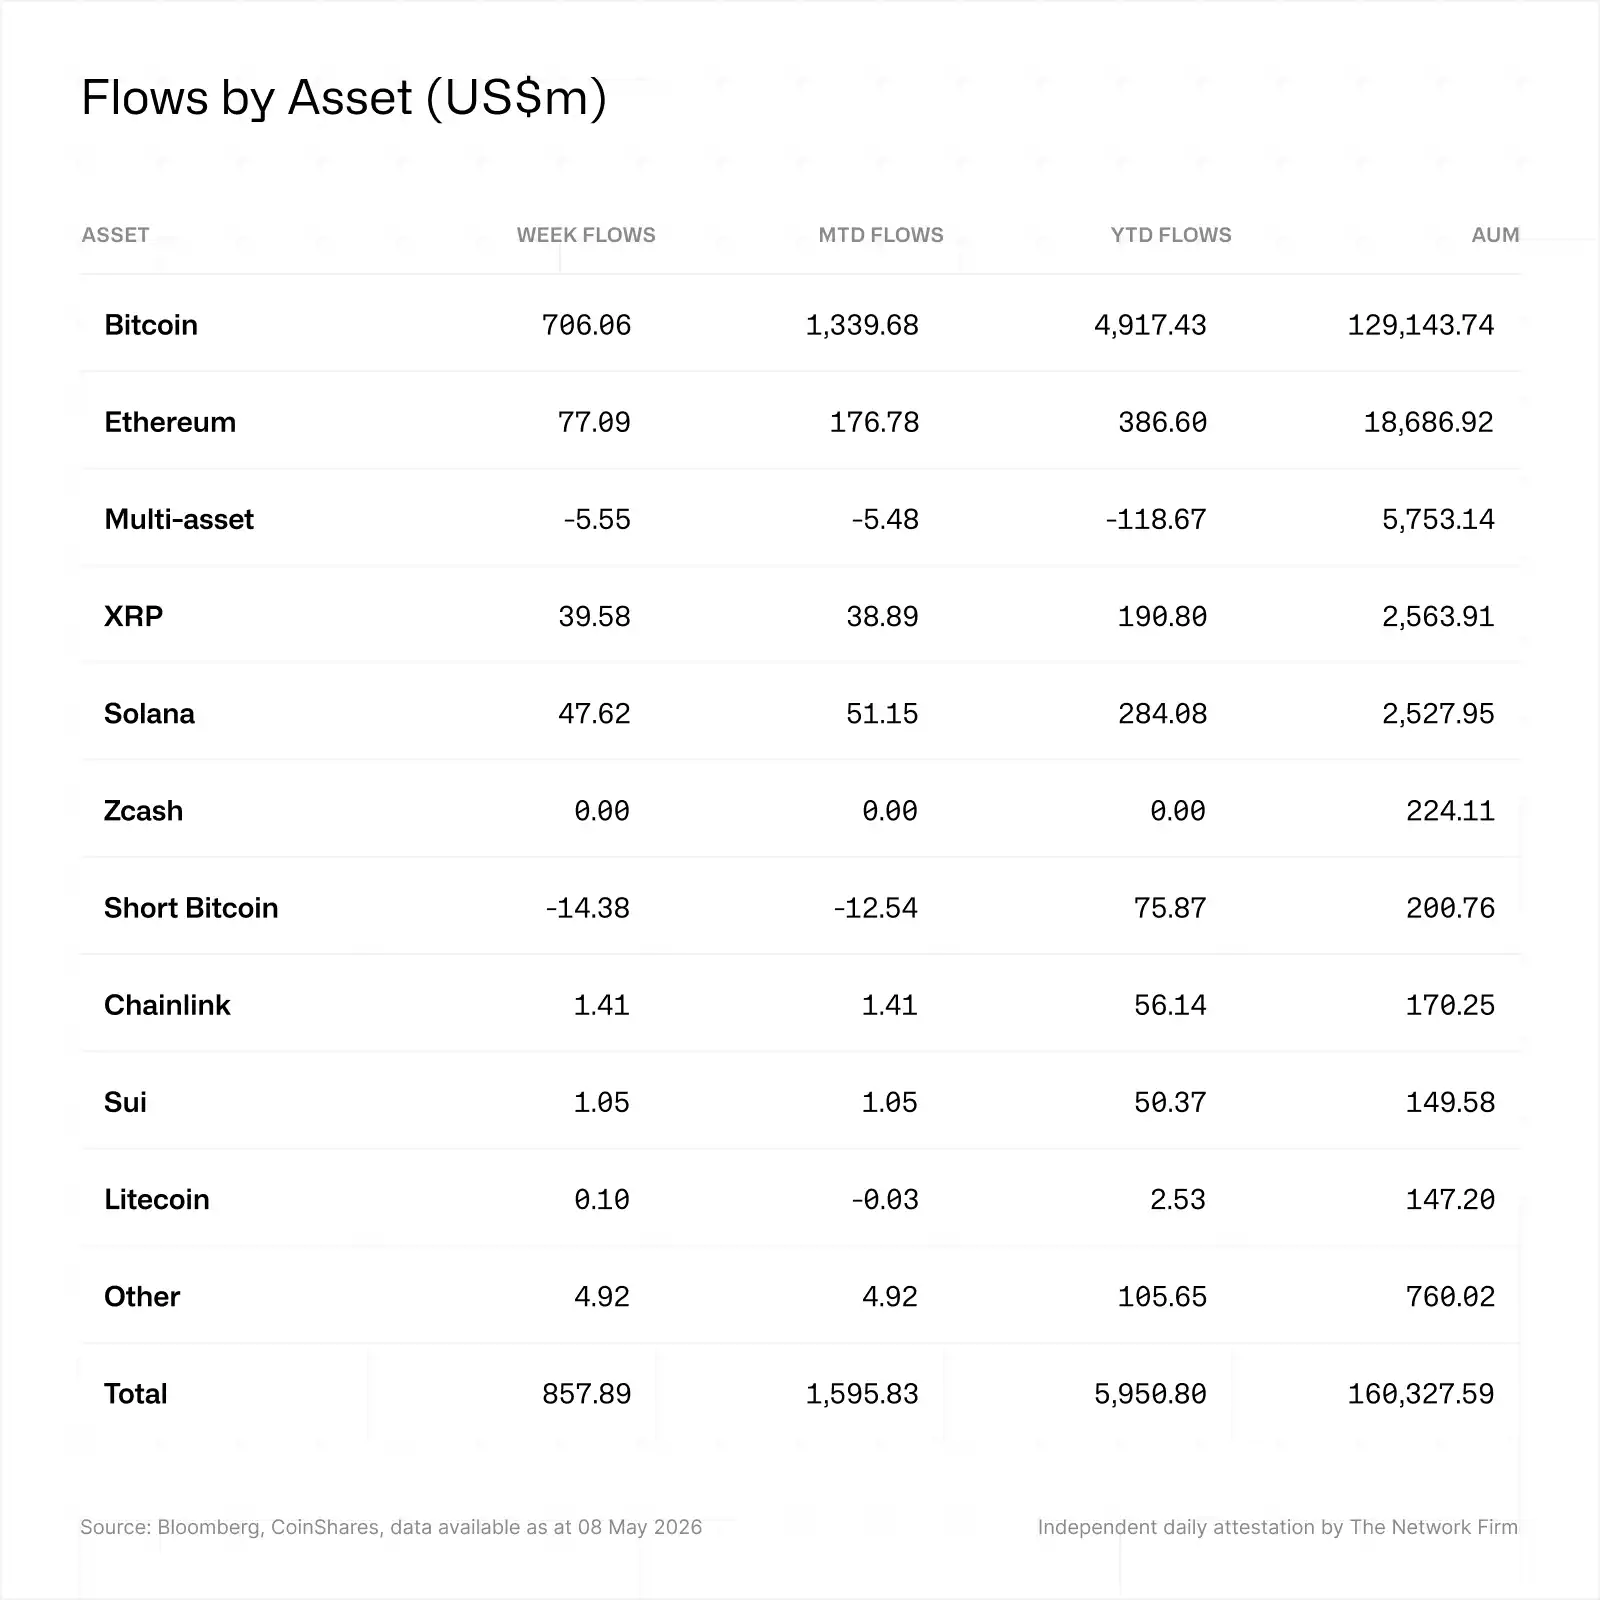
Caption: Detailed Fund Flows by Asset, Source: CoinShares

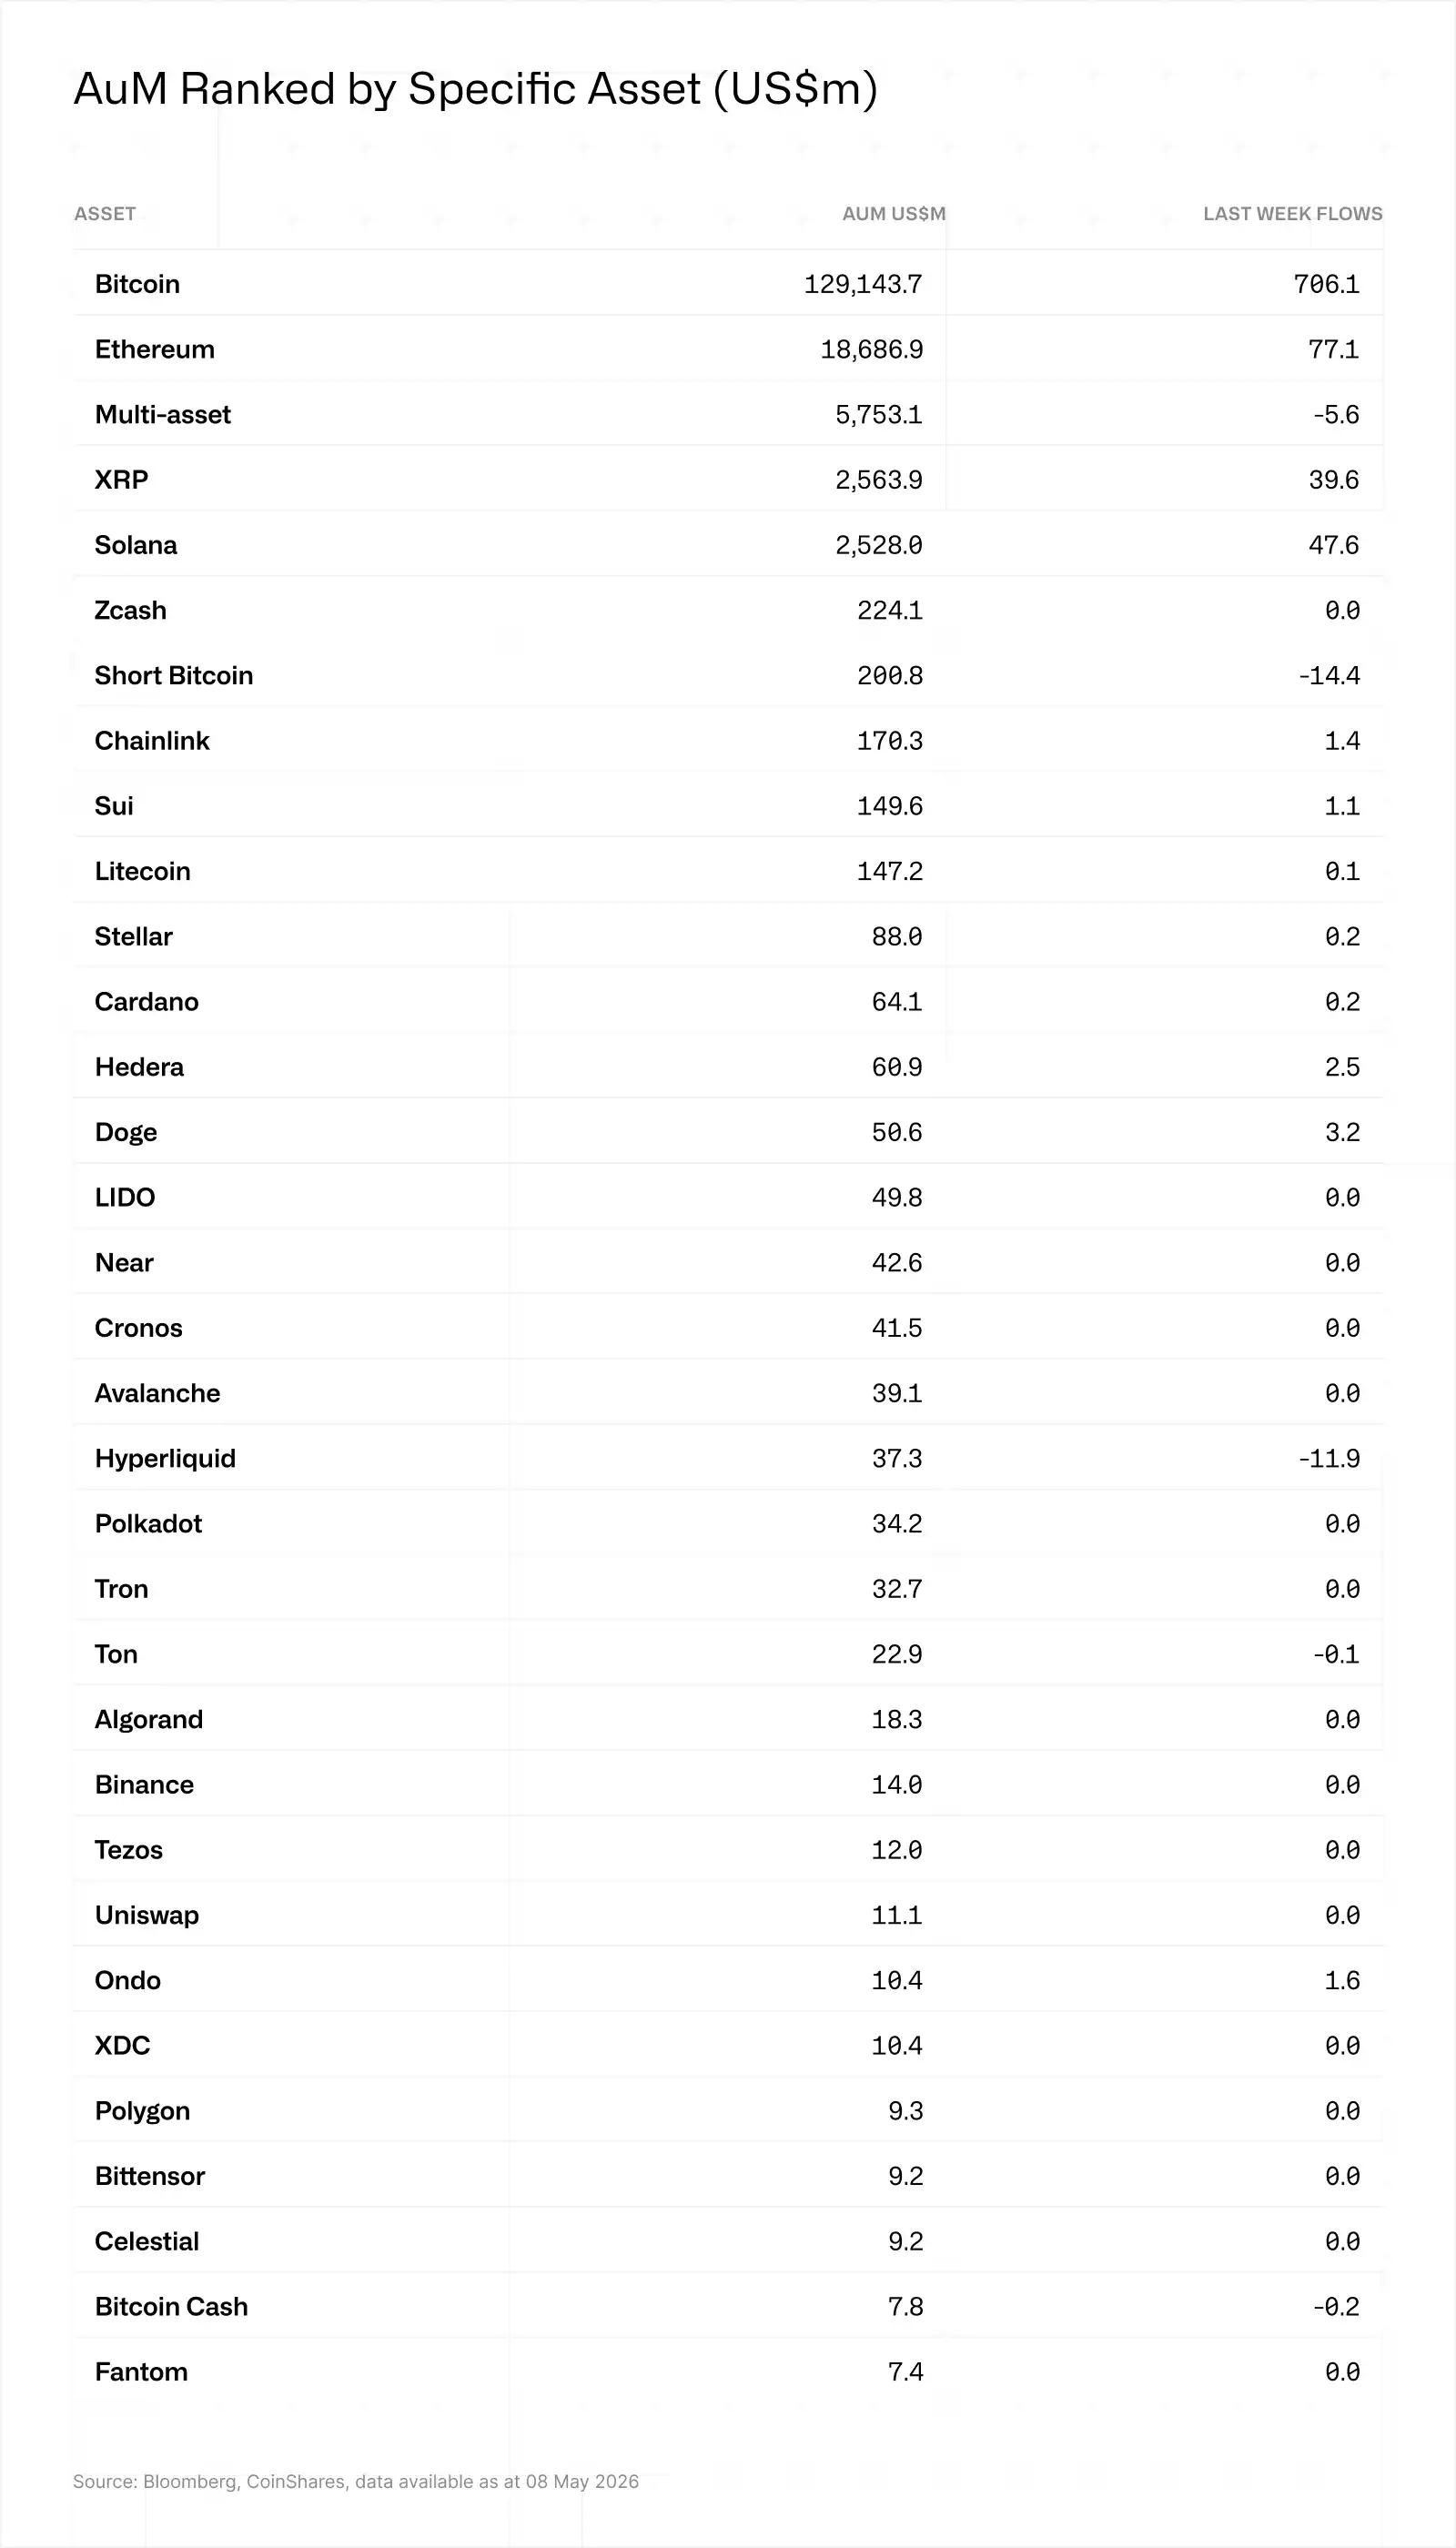
Caption: Assets Under Management Ranked by Specific Asset, Source: CoinShares

Пов'язані питання

QWhat was the main catalyst behind the record $857.9 million weekly inflow into crypto investment products, according to CoinShares?

AThe main catalyst was legislative progress on the CLARITY Act, specifically the release of a final compromise text for the stablecoin yield provision on May 1 and the sponsors' resistance to banking lobbying pressure to keep the compromise intact.

QWhich region saw the most significant week-over-week increase in net inflows for crypto investment products, and by how much?

AThe United States saw the most significant increase, with net inflows surging from $47.5 million the previous week to $776.6 million.

QWhat does the $14.4 million net outflow from short-bitcoin products signal about market sentiment, according to the article?

AThe largest weekly outflow for short-bitcoin products in 2026 signals that hedge positions are being unwound, indicating growing institutional confidence in the market's rebound.

QWhich three altcoin investment products saw notable net inflows alongside Bitcoin?

AEthereum (ETH), Solana (SOL), and XRP investment products all saw notable net inflows of $77.1 million, $47.6 million, and $39.6 million, respectively.

QWhat was the total Assets Under Management (AUM) for global crypto investment products mentioned in the report, and what was Bitcoin's price milestone?

AThe total Assets Under Management (AUM) reached $160 billion, while Bitcoin's price broke above $80,000, marking a new high since its correction in February.

Пов'язані матеріали

GitHub, Transfixed by AI

On the night of February 9th, GitHub suffered a major outage caused by a simple configuration change—reducing a cache refresh interval from 12 to 2 hours—that triggered a cascade of failures. This was not an isolated event, but part of a broader pattern. In early 2026, GitHub experienced at least 8 major incidents, failing to meet its promised 99.9% availability. These outages stemmed from structural issues: explosive growth in load, tight service coupling, and insufficient protection against abnormal traffic. This unprecedented load is driven by AI Agents. In 2025, GitHub handled ~1 billion commits. By 2026, weekly commits reached 275 million, projecting to ~14 billion for the year—a 14x increase. AI tools like Claude Code now contribute 4.5% of all public repository commits, with weekly submissions surging 25x in just three months. AI-generated pull requests jumped from 4 million to 17 million per month in half a year. Unlike human developers, AI Agents work continuously, generating commits at a scale that overwhelms infrastructure designed for human rhythms. The surge also shattered GitHub's business model. Copilot's flat-rate pricing, based on assisting human developers, became unsustainable as Agentic AI sessions consumed resources worth hundreds of dollars for a few dollars in fees. In response, GitHub imposed usage limits and, by June 1st, shifted to a pay-per-use "AI Credits" system. Facing this new reality, GitHub realized a 10x scaling plan was insufficient. It announced a need to *redesign* its architecture for 30x current scale—decoupling services, adding fault isolation, and improving change management to prevent cascading failures. Other platforms like Stripe and AWS are facing similar challenges with AI Agents. Fundamentally, GitHub is transitioning from a human collaboration platform to an "exhaust pipe" for automated AI workflows. Its detailed post-mortem reports aim to maintain trust during this turbulent rebuild. The February outage was not just a technical glitch, but a signal of the software industry's entry into a new, AI-driven era.

marsbit5 хв тому

GitHub, Transfixed by AI

marsbit5 хв тому

Both Suffer Massive Losses Exceeding $90 Billion, Which Is in Greater Peril: Strategy or Bitmine?

Facing massive paper losses exceeding $90 billion each amidst a sharp market downturn, "Digital Asset Treasury" (DAT) giants Strategy and Bitmine find themselves in a precarious position, but with different underlying risks. Strategy, heavily invested in Bitcoin (BTC), faces significant financial strain. Its strategy relies heavily on debt, including convertible notes and preferred stock (STRC) requiring substantial dividend payments. With its cash reserves dwindling and BTC offering no staking yield for cash flow, Strategy's high leverage makes it vulnerable. A continued price decline could force asset sales to meet obligations, potentially creating a negative feedback loop. Its market value has already fallen sharply. In contrast, Bitmine, an Ethereum (ETH) holder, appears on firmer financial ground. It primarily funds its purchases through equity offerings (like ATM programs), avoiding debt pressure. It also generates income by staking a large portion of its ETH holdings. While not immune to market drops and shareholder dilution concerns, Bitmine maintains more flexibility, recently announcing a new preferred share offering to raise further capital. The core divergence lies in their financing: Bitmine uses equity (investor money), while Strategy uses debt (borrowed money). Consequently, Bitmine currently faces less immediate liquidity pressure than Strategy, which must navigate the dual challenge of servicing debt/dividends and a declining core asset (BTC) price.

marsbit12 хв тому

Both Suffer Massive Losses Exceeding $90 Billion, Which Is in Greater Peril: Strategy or Bitmine?

marsbit12 хв тому

Where the AI Bubble Really Is: Which Layer of Players Are Naked

AI Bubble: Where It Really Is and Who's Swimming Naked This analysis dissects the AI industry not as a single entity but as a five-layer pyramid, arguing that bubbles are concentrated in specific tiers, not uniformly distributed. **Key Distinction from the 2000 Dot-com Bubble:** Unlike 2000, where companies had stock prices before revenue, today's leading AI players have massive, contract-backed revenue driving their valuations. Core infrastructure demand is real, with every GPU running at full capacity for paying customers. **The Five-Layer Pyramid & Bubble Assessment:** * **L0 (Fab/Manufacturing) & Top L4 (Leading AI Apps): NO BUBBLE.** Companies like TSMC, NVIDIA, major cloud providers (Microsoft, Google, Meta, Amazon), and top AI labs have real revenues and orders. Supply is tightly constrained by TSMC's disciplined capacity control and physical limits like power/land for data centers, preventing a supply glut. * **L1 (Memory): BATTLEGROUND.** Sky-high HBM margins could signal a new structural cycle or a classic "boom before bust." The oligopoly of three major players may enforce supply discipline, making this a high-stakes bet. * **L2 (Interconnect/Optical Modules): BUBBLE TERRITORY.** Companies like Lumentum and AAOI have seen stock surges (4-10x) far outpacing revenue growth. This hardware segment has lower physical barriers to expansion than fabs, allowing speculation. It mirrors the 2000 bubble's epicenter—optics. * **L3 (Infrastructure/"GPU Landlords"): VULNERABLE.** GPU leasing companies profit from the current compute shortage but own no long-term moat. Their business model relies on a temporary bottleneck that will ease as big tech expands and new tech (e.g., potential space-based data centers) emerges. * **L4 Long Tail (VC-backed Startups): STRONG BUBBLE SIGNALS.** VC funding concentration in AI is twice that of the 1999 peak. Many startups with little revenue use the valuation logic of successful giants to justify their own, creating high risk of a "valuation crunch" when funding dries up. **Critical Risks to Monitor:** 1. **GPU Depreciation & Accounting:** Companies extending the assumed useful life of GPUs artificially boost profits. The true economic life depends on future generational leaps from NVIDIA. 2. **"GPU Credit" & Off-Balance-Sheet Leverage:** Emerging structures where shell companies borrow to buy GPUs and lease them out (with chipmakers sometimes investing) move debt off major balance sheets. This echoes the "vendor financing" of 2000 and the securitization risks of 2008, though currently small-scale. 3. **TSMC Abandoning Caution:** If the primary supply bottleneck (TSMC's conservative capacity planning) breaks, runaway supply could trigger a bust. 4. **Algorithmic Efficiency Breakthrough:** A major leap in software efficiency could drastically reduce the need for raw compute hardware, undermining the investment thesis. **Conclusion:** The AI boom is expensive and has frothy areas, but its core is underpinned by real demand and physical supply constraints. The bubble risk is layered: most present in optical components, GPU leasing, and the long-tail startup ecosystem, while the foundational chip manufacturing and leading application layers remain relatively solid—for now.

marsbit24 хв тому

Where the AI Bubble Really Is: Which Layer of Players Are Naked

marsbit24 хв тому

Торгівля

Спот
Ф'ючерси
活动图片