Chasing Beta, Letting Go of Alpha: The Harsh Conclusion from a Century of U.S. Stock Market Data

比推Опубліковано о 2026-01-07Востаннє оновлено о 2026-01-07

Анотація

Based on an analysis of 100 years of U.S. stock market data, this article argues that investors should prioritize market returns (Beta) over the pursuit of outperforming the market (Alpha). The author illustrates that even a skilled investor generating significant Alpha can underperform a simple index fund if their investment period coincides with a weak market cycle. For example, an investor with a +5% annual Alpha from 1960-1980 would have achieved lower real returns than a poor investor with a -5% Alpha who invested during the strong 1980-2000 bull market. Historical data shows that even with a 3% annual advantage, an active investor still had a 25% probability of underperforming the index over 20-year periods. The core conclusion is that market performance (Beta) is a far more critical determinant of ultimate returns than investment skill (Alpha). Since investors cannot control market cycles, the article suggests this is actually liberating. It allows individuals to redirect their energy away from the futile pressure to "beat the market" and toward factors they can control: optimizing their career, savings rate, health, and family. The potential financial and personal gains from excelling in these areas are argued to be vastly more significant than the marginal benefits of seeking Alpha. The advice for 2026 is to "chase Beta, not Alpha."

Author: Nick Maggiulli, Finance Blogger & Author of "Just Keep Buying"

Compiled by: Felix, PANews

Original Title: A Century of U.S. Stock Market Revelations: Why We Should Chase Beta and Forget Alpha


The investment world widely believes that alpha, or the ability to outperform the market, is the goal investors should pursue. This is entirely logical. All else being equal, more alpha is always better.

However, having alpha does not always mean better investment returns. Because your alpha always depends on the market's performance. If the market performs poorly, alpha may not necessarily bring you profits.

For example, imagine two investors: Alex and Pat. Alex is very skilled at investing, outperforming the market by 5% every year. Pat, on the other hand, is a poor investor, underperforming the market by 5% each year. If Alex and Pat invest during the same period, Alex's annual return will always be 10% higher than Pat's.

But what if Pat and Alex start investing at different times? Is it possible that despite Alex's superior skills, Pat ends up with higher returns than Alex?

The answer is yes. In fact, if Alex invests in U.S. stocks from 1960 to 1980, and Pat invests from 1980 to 2000, then after 20 years, Pat's investment returns will exceed Alex's. The chart below illustrates this:
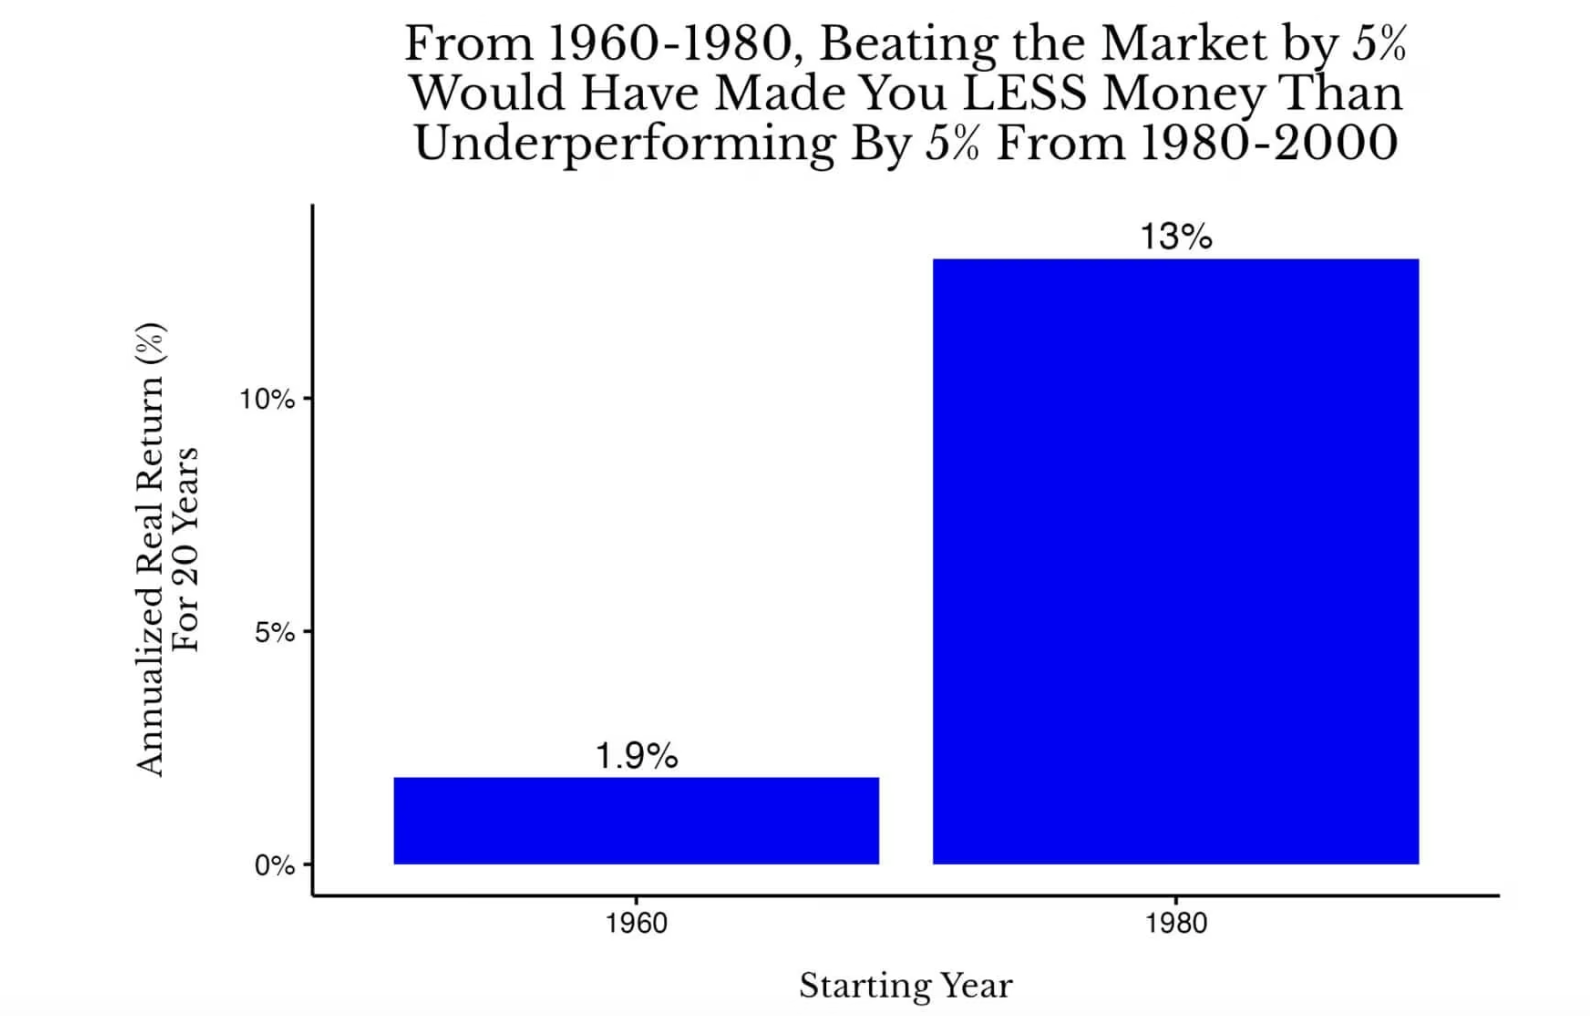
Comparison of 20-year annualized real total returns of U.S. stocks from 1960-1980 vs. 1980-2000

In this scenario, Alex's annual return from 1960 to 1980 is 6.9% (1.9% + 5%), while Pat's annual return from 1980 to 2000 is 8% (13% – 5%). Although Pat is a less skilled investor than Alex, in terms of inflation-adjusted total returns, Pat performs better.

But what if Alex's competitor is a true investor? Now assume Alex's competitor is Pat, the person who lags the market by 5% each year. But in reality, Alex's true competitor should be an index investor who earns returns equal to the market each year.

In this scenario, even if Alex outperforms the market by 10% annually from 1960-1980, he would still lag behind an index investor from 1980-2000.

Although this is an extreme example (an outlier), you might be surprised how frequently having alpha leads to underperformance relative to historical periods. As shown in the chart below:
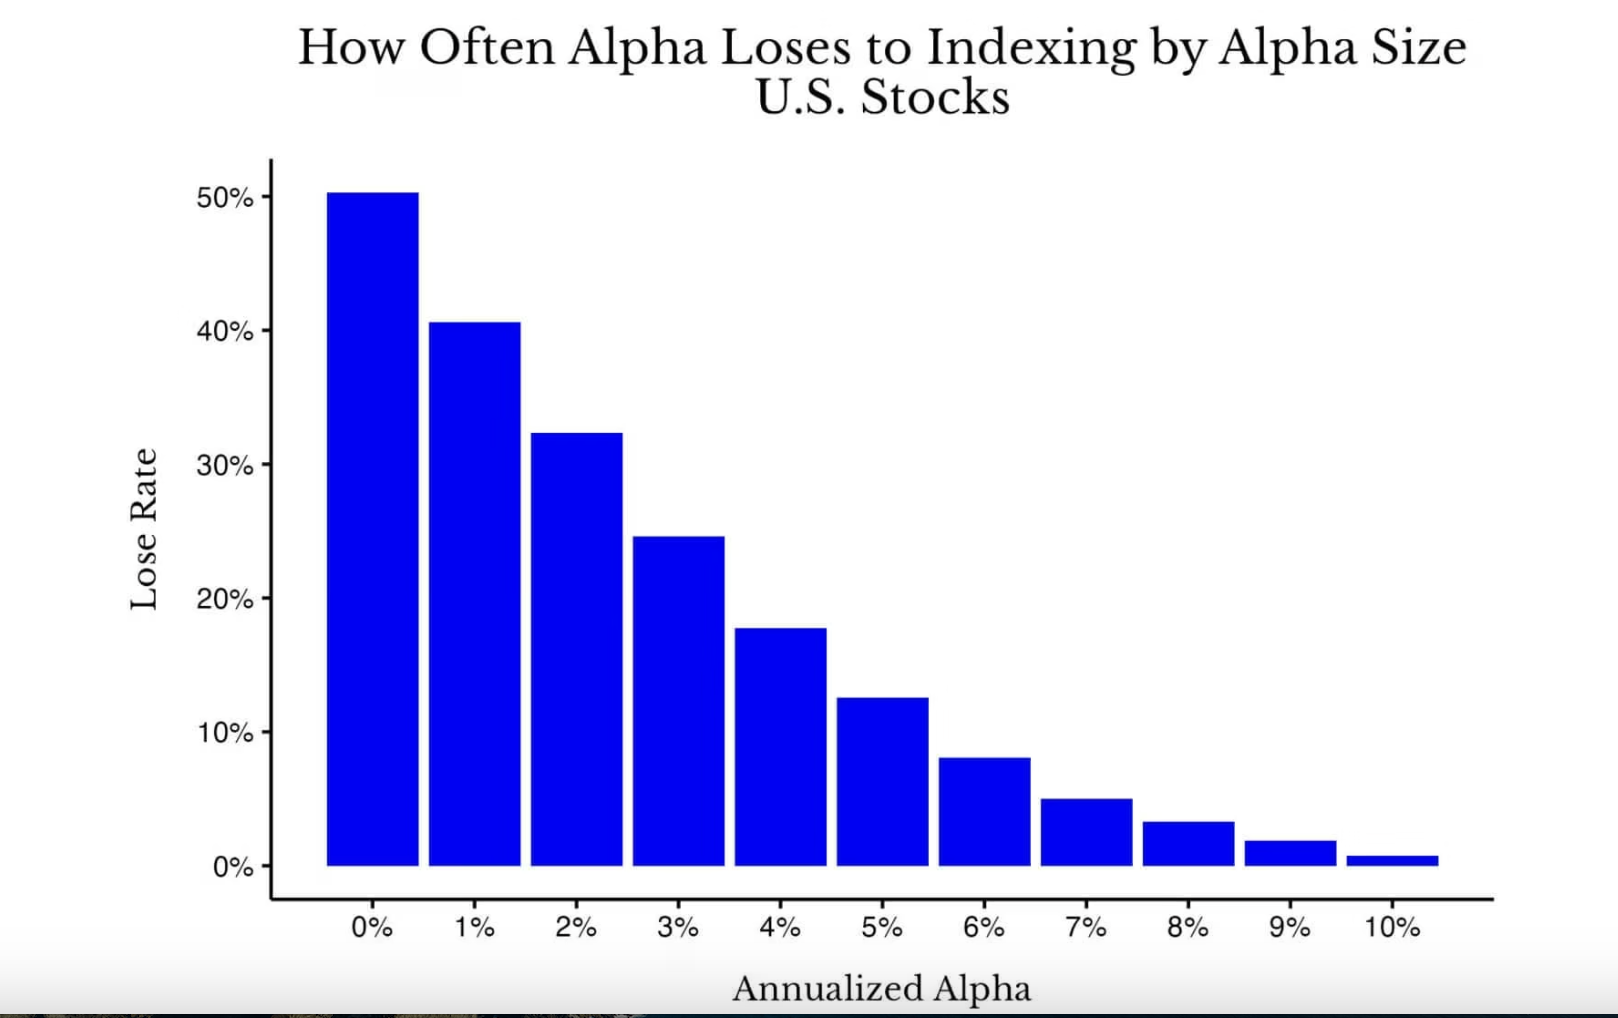
Probability of underperforming the index vs. alpha size across all 20-year periods in the U.S. stock market from 1871 to 2005

As you can see, when you have no alpha (0%), the probability of outperforming the market is essentially a coin flip (about 50%). However, as alpha increases, the compounding effect of returns does reduce the frequency of underperforming the index, but not as much as one might think. For example, even with an annual alpha of 3% over a 20-year period, there is still a 25% probability of underperforming an index fund during other periods in U.S. market history.

Of course, some might argue that relative performance is what matters, but I don't share that view. Ask yourself: would you rather have average market returns during normal times, or just "lose less money" (i.e., achieve positive alpha) during a great depression? I would certainly choose the index returns.

After all, most of the time, index returns deliver fairly good results. As shown below, the annualized real returns of U.S. stocks fluctuated by decade but were mostly positive (Note: Data for the 2020s only shows returns up to 2025):
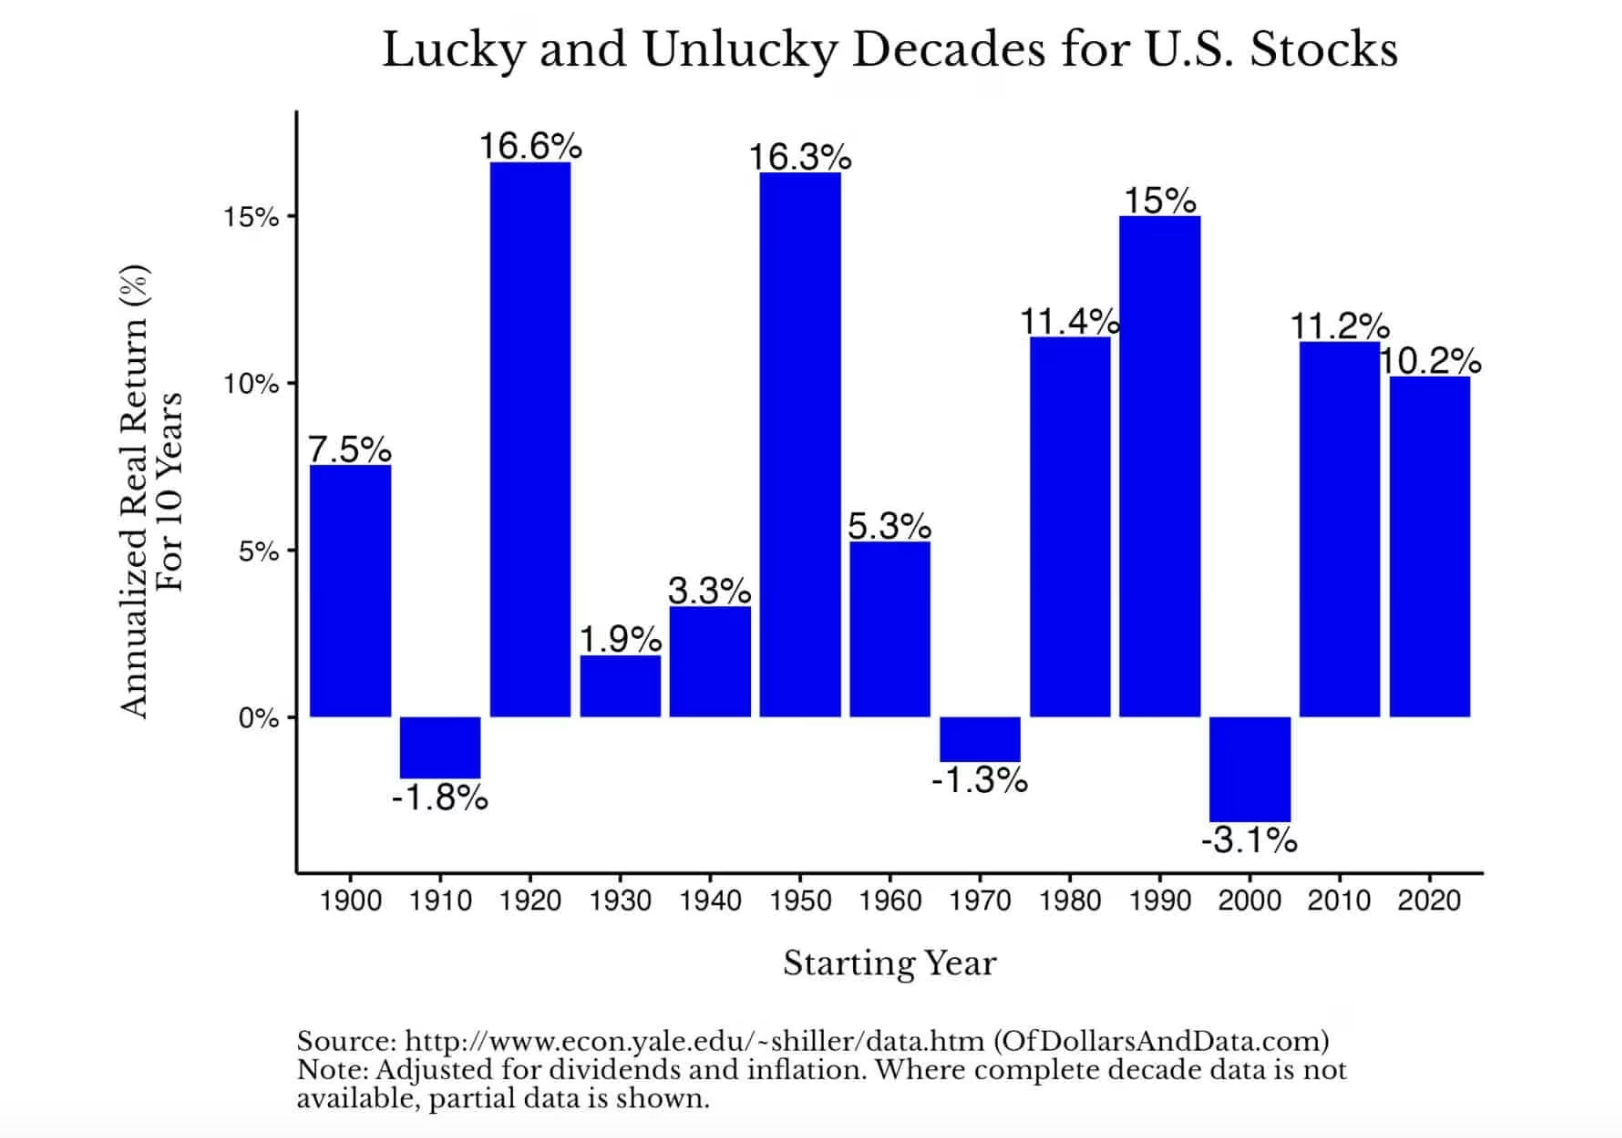
All of this shows that while investment skill is important, market performance is often more critical. In other words, pray for Beta, not Alpha.

Technically, β (Beta) measures the volatility of an asset's returns relative to the market. If a stock has a Beta of 2, it is expected to rise 2% when the market rises 1% (and vice versa). But for simplicity, market return is often referred to as Beta (i.e., a beta coefficient of 1).

The good news is that if the market doesn't provide enough "Beta" in one period, it may make up for it in the next cycle. You can see this in the chart below, which shows the 20-year rolling annualized real returns of U.S. stocks from 1871 to 2025:
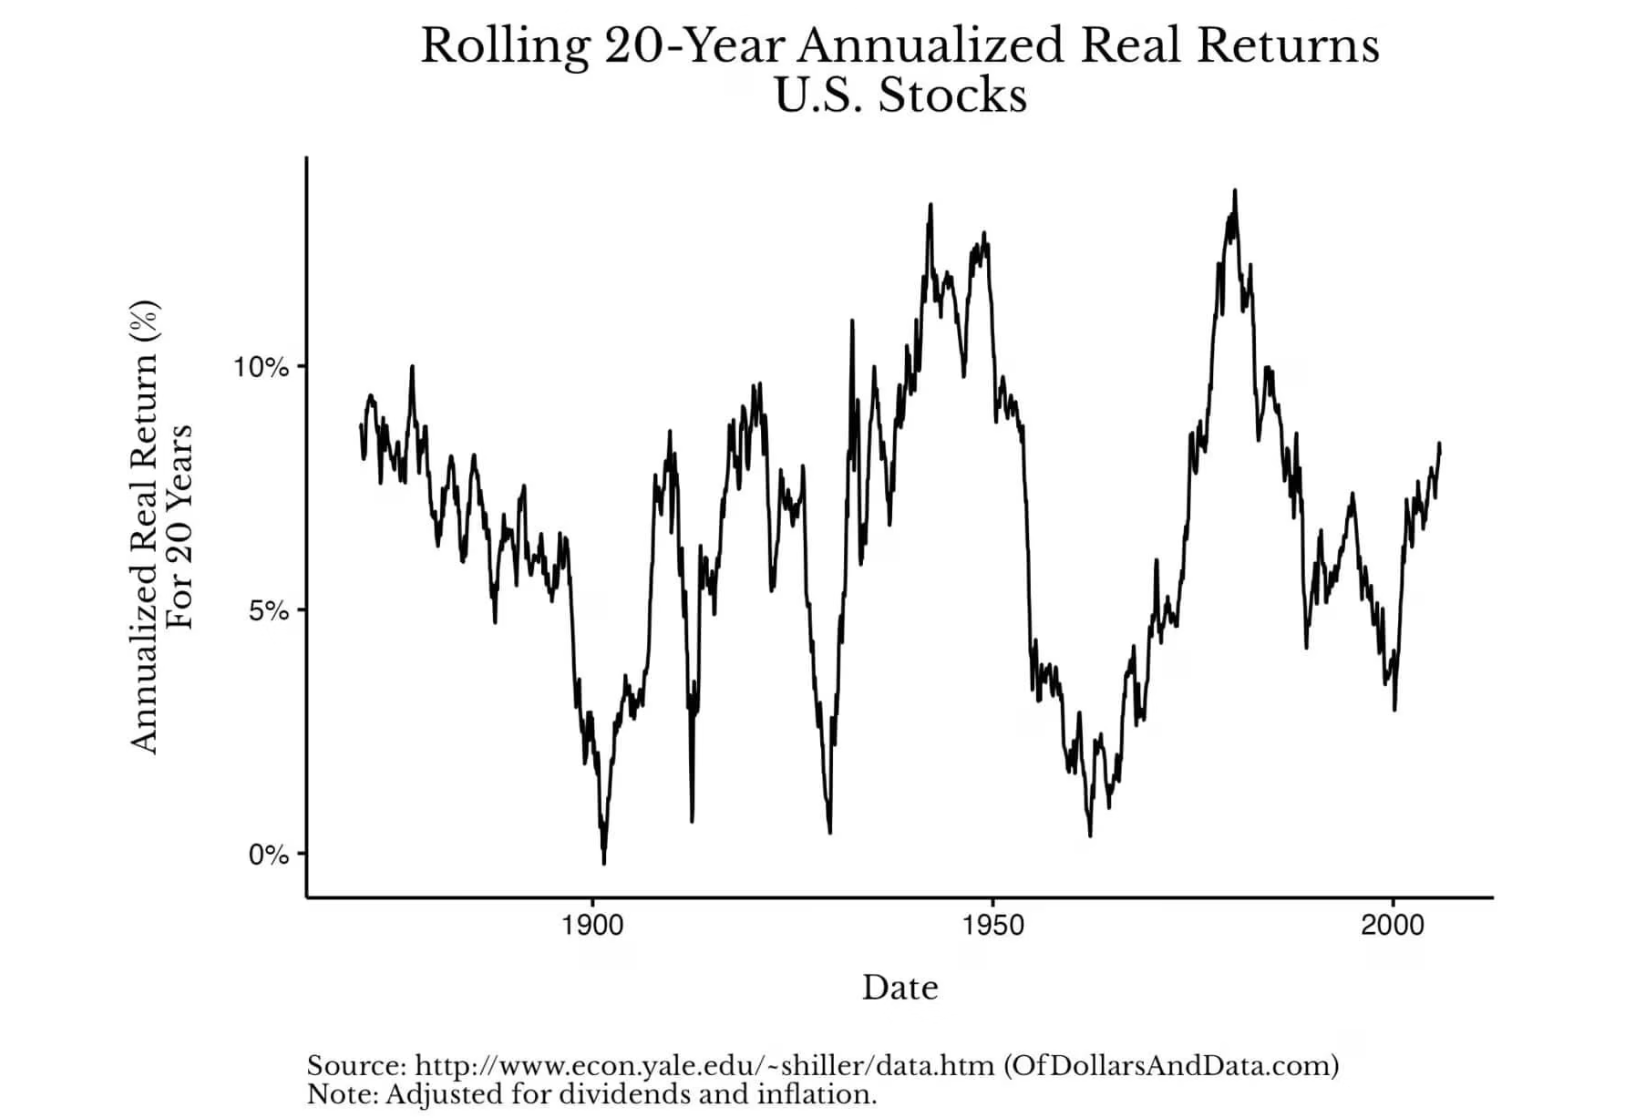
This chart visually shows how returns can rebound strongly after downturns. Taking U.S. stock history as an example, if you invested in U.S. stocks in 1900, your annualized real return over the next 20 years would be close to 0%. But if you invested in 1910, your annualized real return over the next 20 years would be about 7%. Similarly, if invested at the end of 1929, the annualized return was about 1%; whereas if invested in the summer of 1932, the annualized return was as high as 10%.

This huge difference in returns again confirms the importance of overall market performance (Beta) relative to investment skill (Alpha). You might ask, "I can't control where the market goes, so why does this matter?"

It matters because it is a relief. It frees you from the pressure of "having to beat the market" and allows you to focus on what you can truly control. Instead of feeling anxious that the market is beyond your command, see it as one less thing to worry about. See it as a variable you don't need to optimize because you simply cannot optimize it.

So what should you optimize instead? Optimize your career, savings rate, health, family, and so on. Over the long span of life, the value created in these areas is far more meaningful than苦苦追求 a few percentage points of excess returns in your investment portfolio.

Do the simple math: a 5% raise or a strategic career transition can increase your lifetime income by six figures or more. Similarly, maintaining good health is efficient risk management, significantly hedging against future medical expenses. And spending time with family sets a positive example for their future. The benefits of these decisions far exceed the gains most investors can expect from trying to outperform the market.

In 2026, focus your energy on the right things. Chase Beta, not Alpha.


Twitter:https://twitter.com/BitpushNewsCN

Bitpush TG Discussion Group:https://t.me/BitPushCommunity

Bitpush TG Subscription: https://t.me/bitpush

Original link:https://www.bitpush.news/articles/7600652

Пов'язані питання

QWhat is the main argument presented in the article regarding investment returns?

AThe article argues that market performance (Beta) is more important than investment skill (Alpha) for long-term returns. Even skilled investors with positive Alpha can underperform if they invest during a poor market period, while less skilled investors can outperform if they invest during a strong market period.

QAccording to the historical data, what is the probability of underperforming the index even with a 3% annual Alpha over 20 years?

AEven with a 3% annual Alpha over 20 years, there is still a 25% probability of underperforming the index fund, based on U.S. market data from 1871 to 2005.

QWhy does the author suggest that investors should focus on Beta rather than Alpha?

AThe author suggests focusing on Beta because market returns are largely uncontrollable, and investors should instead optimize factors they can control, such as their career, savings rate, health, and family, which can provide greater long-term value than seeking marginal investment outperformance.

QHow does the article illustrate the impact of market timing using the examples of Alex and Pat?

AAlex, who outperforms the market by 5% annually from 1960-1980, achieves a 6.9% real annual return. Pat, who underperforms the market by 5% annually from 1980-2000, achieves an 8% real annual return. This shows Pat's superior results due to better market timing, despite poorer investment skill.

QWhat does the 20-year rolling annualized real returns chart of U.S. stocks from 1871 to 2025 demonstrate?

AThe chart demonstrates that market returns tend to rebound strongly after periods of low returns, highlighting the importance of market cycles (Beta) over individual investment skill (Alpha). For example, returns were near 0% from 1900-1920 but rose to 7% from 1910-1930.

Пов'язані матеріали

Interview with Robinhood Executive: Meme + Tokenized US Stocks as "Barbell" Customer Acquisition Strategy, All Business Lines Achieve Hundreds of Millions in Revenue

Interview with Robinhood executive Johann Kerbrat reveals the company's "barbell" customer acquisition strategy for its new Robinhood Chain, combining meme tokens with tokenized stocks. Three weeks after mainnet launch, the chain has seen over $3B in weekly DEX volume and 105M transactions. Kerbrat explains the logic behind the permissionless chain: meme tokens attract DeFi users, while tokenized real-world assets (RWA), currently over 90 US stocks and ETFs accessible in 120+ countries, serve global users. The goal is to bring Robinhood's 27 million funded accounts on-chain by simplifying DeFi with a user-friendly interface, exemplified by features like Robinhood Earn which offers yield without requiring wallet management. Built on Arbitrum's technology stack for its speed, low cost, and Ethereum's security, the chain focuses on financial products like Earn, spot trading, and perpetuals. Kerbrat downplays direct competition with platforms like Base, emphasizing the goal of expanding the overall market for on-chain assets. He details selective partnerships (e.g., Morpho, Lighter) based on compliance, unique UX, and differentiation. While regulatory clarity is pending for US perpetuals, the expansion continues via Bitstamp in Europe. Finally, Kerbrat positions Robinhood as a "super app" integrating stocks, options, crypto, banking, and AI trading, with all major business lines generating hundreds of millions in revenue. For the chain, current priority is driving adoption over maximizing gas fee revenue.

marsbit1 год тому

Interview with Robinhood Executive: Meme + Tokenized US Stocks as "Barbell" Customer Acquisition Strategy, All Business Lines Achieve Hundreds of Millions in Revenue

marsbit1 год тому

Fidelity Q3 Report: BTC, ETH, and SOL Continue to Build Bottoms; How Much Further Will This Crypto Bear Market Go?

Fidelity's Q3 Crypto Signal Report analyzes the current bear market, noting Bitcoin (BTC), Ethereum (ETH), and Solana (SOL) are in a prolonged bottoming phase. Key indicators like the weighted Net Unrealized Profit/Loss (NUPL) have turned negative (-0.01), signaling the market is slightly below its aggregate cost basis, with BTC acting as the primary stabilizing asset. BTC's dominance has risen to 68%, indicating a lack of capital rotation to other digital assets. Performance has been weak across the board, with BTC, ETH, and SOL down significantly year-to-date. Market sentiment is depressed, exacerbated by substantial outflows from spot ETPs and a challenging macro environment. The report compares the current ~203-day downtrend to historical ~300-day bottoming cycles, suggesting the process may be two-thirds complete, with late 2026 as a potential timeframe to monitor. For Bitcoin, NUPL at 0.09 indicates cautious sentiment, while momentum signals remain negative. The Yardstick metric points to potential undervaluation relative to network security (hashrate). Ethereum's NUPL is deep in the "capitulation" zone at -0.43, a historically positive signal for future returns, though its momentum and network fee revenue are negative. Solana shows the deepest NUPL at -0.72 but demonstrates relative resilience in on-chain activity and stablecoin transfer volume. The report concludes that while several metrics are near historical capitulation levels, a definitive market bottom has not yet been established. The path forward likely involves continued consolidation, with BTC's relative strength and fundamental on-chain usage for ETH and SOL providing key areas for investor observation.

marsbit1 год тому

Fidelity Q3 Report: BTC, ETH, and SOL Continue to Build Bottoms; How Much Further Will This Crypto Bear Market Go?

marsbit1 год тому

Торгівля

Спот
活动图片