Bitcoin is entering a phase where macro rhythms matter more than narratives.
Equity markets are near historic highs, real yields remain elevated, and credit markets are expanding into increasingly opaque corners of the financial system. These conditions don't guarantee an immediate crisis, but together they form a backdrop for a potential window of high volatility in risk assets.
For Bitcoin, the core question is: will stress manifest in an underlying financial system with stretched asset valuations, and how quickly can policymakers move to contain it?
Macro strategist Michael Pento describes the current setup as a "triple bubble": equity valuations near historic extremes, real estate pressured by mortgage rates close to 6%, and private credit AUM racing toward $2 trillion. The label is catchy, but the framework is useful because it emphasizes sequence.
If credit cracks first, liquidity evaporates instantly, and Bitcoin is likely sold off alongside other assets. If policy support arrives before a crisis spreads, Bitcoin becomes a high-beta liquidity trade, rebounding faster than traditional risk assets.
Financial systems rarely collapse because valuations are too high. They break when credit and bond chains face forced selling. Bitcoin's around-the-clock liquidity means its swings during panic and rescue rallies are almost more violent than any other asset.
Recent data shows stress signals are accumulating but haven't yet triggered a break.
On February 23, the ICE BofA High Yield Index Option-Adjusted Spread was 2.95%, still tight by crisis standards.
On February 18, the Fed's balance sheet stood at $6.613 trillion, up about $28.8 billion over four weeks—a mild expansion, not emergency liquidity.
On February 20, the 10-year TIPS real yield was around 1.80%, a level high enough to pressure yieldless assets.
Stablecoin market cap was ~$308.8 billion, with a 30-day change of -0.18%, essentially flat.
Since early 2026, Bitcoin spot ETFs have seen net outflows of ~$2.6 billion, with outflows of ~$4.3 billion over the past five weeks.
Bitcoin Sells Off First, Reasons Discussed Later
Deflationary liquidations often start in credit markets, not stock indices.
High-yield bond spreads widen sharply, funding markets come under pressure, volatility spikes—cash becomes the only position everyone wants.
Bitcoin's behavior in such phases is predictable: perpetual funding rates turn negative, leverage unwinding causes open interest to plummet, liquidity exodus triggers stablecoin supply contraction, ETF outflows accelerate.
March 2020 is a classic reference. In a global liquidity shock, Bitcoin plunged nearly 40% on March 12, sold off alongside stocks, credit, and commodities as market participants scrambled for US dollar liquidity.
A credit-driven liquidation could easily see Bitcoin swing -20% to -40% in a matter of days.
Investment firm VanEck noted in early February 2026 that Bitcoin futures open interest peaked at over $90 billion in October 2025 and has since shed more than 45% of that leverage. If credit stress truly emerges, there is room for further forced selling.
Rating agency Moody's expects private credit AUM to exceed $2 trillion in 2026 and approach $4 trillion by 2030. According to Reuters, Bank of America has deployed $25 billion into the space.
This growth concentrates credit risk in structures with less transparency, longer lock-ups, and weaker covenant protection.
If a credit event triggers forced selling of private credit portfolios, the ripple effects would hit public markets through margin calls and collateral pressure. Bitcoin, as the most liquid, always-traded risk asset, would disproportionately absorb the selling pressure.
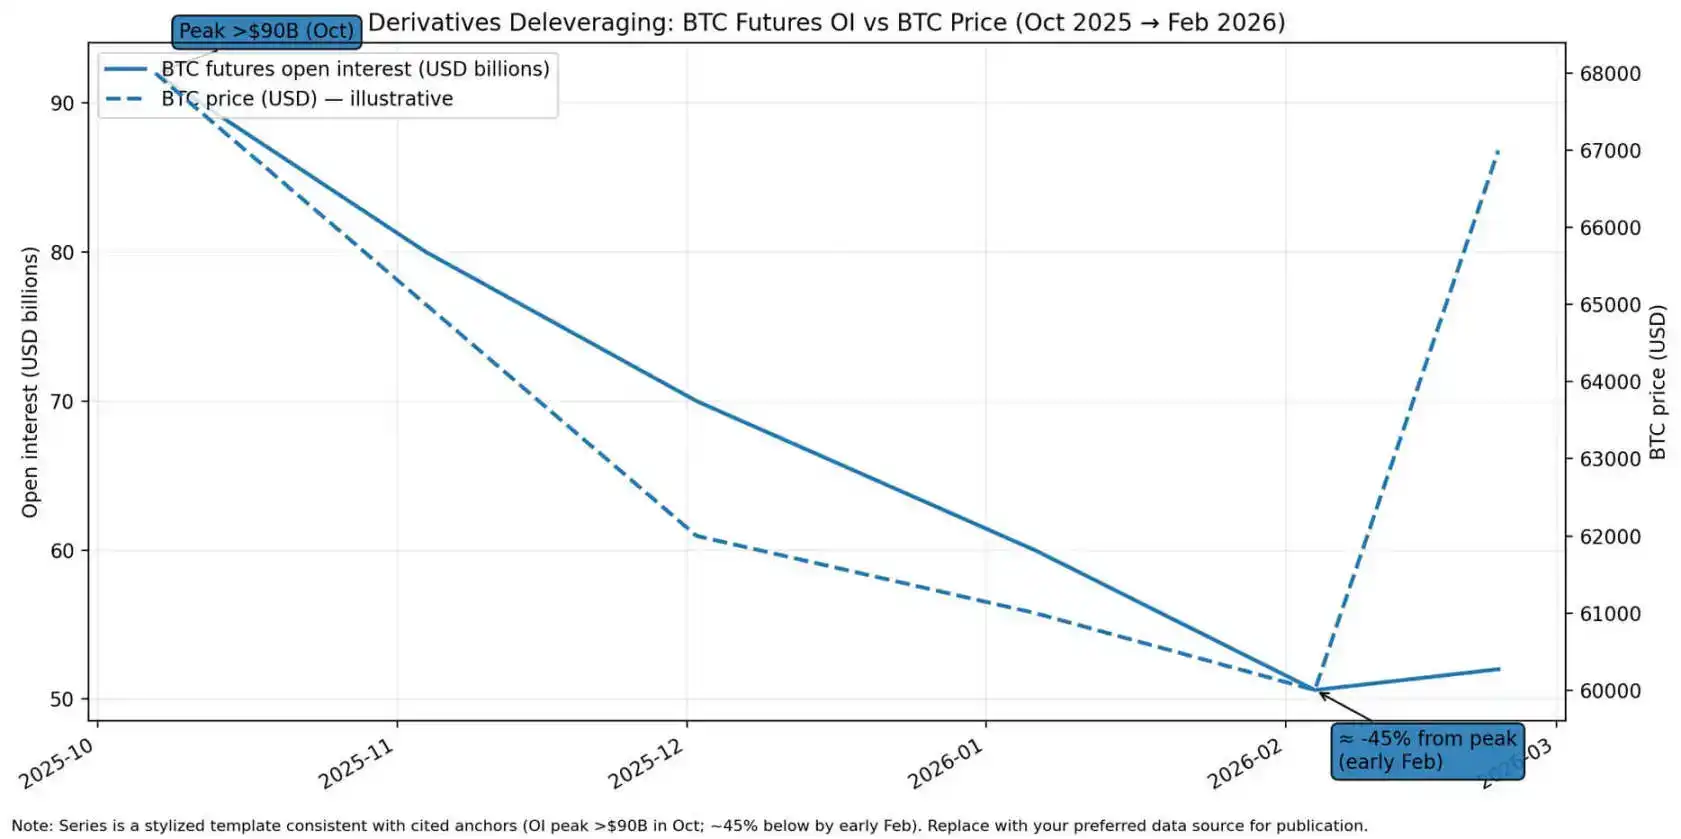
Bitcoin futures open interest fell approximately 45% from its peak of over $90 billion in October 2025 to levels in early February 2026, while the Bitcoin price dropped from around $68,000 to near $60,000 before rebounding to around $67,000
Bitcoin Will Front-Run Policy Rescue Rallies
The opposite script begins with clear policy support.
Fed balance sheet expansion, emergency tools deployed, real yields falling. Bitcoin's reaction in this environment is equally predictable: funding rates and basis normalize, returning liquidity drives stablecoin supply higher, ETF flows stabilize or turn positive, open interest reaccumulates.
In clear rescue environments, Bitcoin often acts as a high-beta liquidity asset, recovering faster than traditional risk assets because it has no credit risk and no earnings disappointments. It is a liquidity claim on a fixed-supply monetary asset that benefits when real yields fall.
The banking turmoil of March 2023 is the template. As markets priced a policy pivot toward easing, Bitcoin rose 26% in a week and about 40% in ten days, front-running the Fed's eventual liquidity support.
In February 2026, Bitcoin surged from around $60k to over $70k in a single day, its largest one-day gain since March 2023, highlighting that macro risk sentiment remains the dominant driver in stress windows.
In March 2020, Bitcoin crashed with everything else, but the Fed also cut rates to zero within weeks, launched unlimited QE, and established emergency lending facilities.
Bitcoin rallied from its March 12 low and rose five-fold over the next year as real yields remained deeply negative and fiscal spending expanded massively.
The lesson: Bitcoin's reaction beta to the liquidity cycle is almost higher than any asset; timing matters more than narrative.
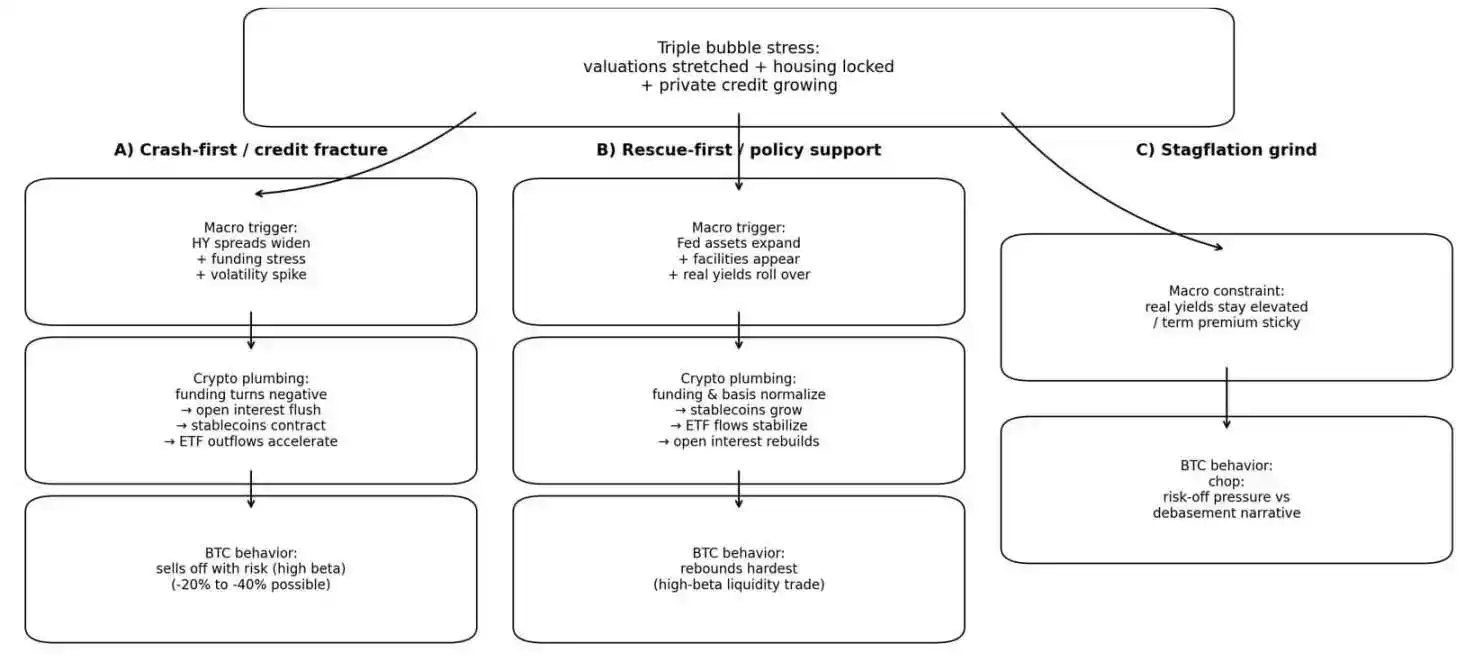
A flowchart shows three potential paths for Bitcoin under triple bubble stress: a 20% to 40% sell-off from credit breaking, a high-beta rally from policy rescue, or choppy price action from stagflation pulling between safe-haven pressure and monetary debasement narratives
When Neither Path is Clear
The messiest scenario: stubborn inflation, bond markets demanding higher term premiums, real yields staying high, which restricts policymakers' ability to rescue quickly without rekindling inflation fears.
In this environment, Bitcoin gets choppy. Safe-haven pressure and debasement hedging narratives pull against each other. Rallies fade when real yields are high or policy support is lacking.
The 10-year TIPS yield at 1.80% is far above the zero or negative real yields seen during Bitcoin's strongest rallies.
The Freddie Mac 30-year fixed mortgage rate averaged 6.01% on February 19.
The Buffett Indicator (Total Market Cap / GDP) is ~206%, which, according to Advisor Perspectives data, is the highest level in the indicator's history. This suggests little room for further equity multiple expansion unless earnings grow or discount rates fall.
If credit stress arrives but policy doesn't pivot quickly, Bitcoin gets stuck in a choppy格局 of neither liquidation nor rescue.
A Framework for Tracking the Shift
A simple tracking framework, updated weekly with four metrics:
- Change in Fed Total Assets over 4-8 weeks;
- 30-day change in Stablecoin Market Cap;
- Change in High-Yield Spread over 2-4 weeks;
- Change in 10-Year Real Yield over 2-4 weeks.
When metrics deteriorate sharply, Bitcoin tends to act like a high-beta asset in liquidity events;
When metrics improve, reflation expectations rise, Bitcoin tends to outperform.
Current readings show a neutral-to-negative liquidity environment.
- Fed balance sheet expanding slightly but not flooding;
- Stablecoin supply flat to slightly down;
- Credit spreads still tight;
- Real yields high and sticky;
- Bitcoin spot ETFs seeing persistent outflows;
- Derivatives open interest nearly halved from peak.
The market setup is like waiting for a catalyst: either credit stress triggering liquidation or policy support restarting the liquidity trade.

The Signal is in the Credit Chain
An actionable monitoring framework, focusing on credit and crypto plumbing:
- High-Yield Spreads rising from lows → Credit market confidence fading;
- Treasury Volatility & Term Premium rising → Bond market pricing policy constraint;
- Fed Balance Sheet flat/falling + Spreads widening → Confirming no backstop.
Crypto-side signals:
- Open Interest falling sharply → Forced selling;
- Stablecoin Market Cap contracting → Liquidity exiting;
- ETFs seeing persistent outflows → Institutional de-risking.
Rescue confirmation signals:
- Fed Total Assets rising noticeably → Active liquidity provision;
- 10-Year TIPS Yield falling → Real yields declining;
- Stablecoin Supply growing + Derivative Funding Rates normalizing → Crypto liquidity returning.
The shift from liquidation to rescue is often fast. March 2020 is the example: Bitcoin crashed then rallied within weeks as policy support landed.
The greatest value of the triple bubble framework isn't predicting a crisis, but providing a sequence.
Credit breaking triggers liquidation, Bitcoin gets sold cheap;
Policy rescue brings liquidity explosion, Bitcoin front-runs traditional assets.
The current macro setup—overvalued, high real yields, tight credit spreads, flat stablecoin supply, persistent ETF outflows—suggests the market is pricing stress but hasn't seen the credit chain break that forces selling.
Bitcoin's next major move depends not on whether the bubble exists, but on whether credit breaks first, or the Fed rescues first.