Brief Ethereum Recovery Coincides With Record-Breaking Levels Of Address Expansion

bitcoinistОпубліковано о 2026-03-04Востаннє оновлено о 2026-03-04

Анотація

Ethereum briefly recovered above $2,000, though the momentum faded. Despite market volatility, on-chain data reveals record-breaking network growth. Over 837,200 active addresses are now interacting daily—an 80% increase from five years ago. Additionally, more than 284,800 new wallets are created per day, signaling renewed investor interest. Analysts also note a recurring “Rainbow pattern” on ETH’s weekly chart, which historically preceded major rallies. If the pattern holds, Ethereum could be poised for a significant upward move.

Ethereum saw a brief bounce, which pushed its price above the $2,000 mark, but this upward move seems lost its momentum and has fallen below the level. Amid this, ETH’s price bounce on Tuesday comes a notable spike in the network’s on-chain activity and the creation of new wallet addresses.

Ethereum Activity Spikes to Historic Levels

Even though the broader cryptocurrency market appears highly volatile, Ethereum investors are moving against the current trend and exhibiting renewed bullish sentiment. This renewed euphoria toward the leading altcoin is shown by a sudden wave of fresh investors entering the market each day.

Santiment, a popular market intelligence and on-chain data analytics platform, took to the X platform to share this rise in network activity amid a brief bounce. Ethereum’s price has briefly increased, and a more interesting narrative is now developing beneath the surface.

As ETH attempts to stabilize above the $2,000 level after recent volatility, bulls and bears are currently battling over whether the resistance will be breached in the long run. In the meantime, on-chain data indicates a significant increase in user involvement, which shows a historic spike in the creation of new wallets and total network activity.

Source: Chart from Santiment on X

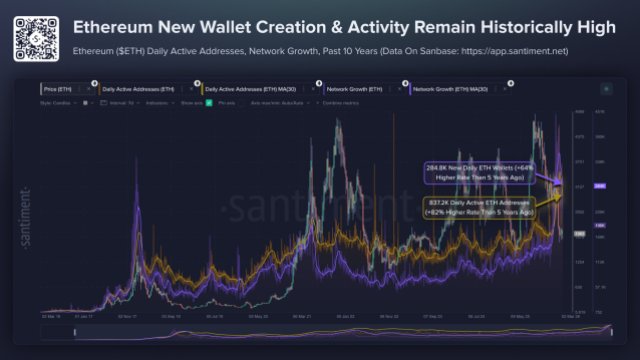
Using the 30-day averages, there has been an increase in fresh addresses and network activity on a daily basis. The chart shared by Santiment shows that there are over 837,200 active ETH wallet addresses per day, representing more than 80% rise in comparison to 5 years ago.

When compared to 10 years ago, this figure marks an over 1,135% spike. The increase in new addresses may indicate new funding, a resurgence of interest, or the reactivation of previously excluded players joining the ecosystem.

In terms of new Ethereum wallet addresses, there have been over 284,800 created per day. This number represents a +64% uptick compared to 5 years ago and a more than 1,967% increase compared to 10 years ago. A steady increase in wallet creation often signals deeper network usage and growing popularity, which may trigger a larger price surge.

A Historic Pattern Unfolding On The ETH Chart

Despite the bearish market conditions, Ethereum is forming a key pattern that would flip the altcoin towards the upside. According to Coinvo Trading, a full-time crypto trader on X, the impending ETH move “is going to shock the entire world.”

After examining the altcoin’s performance on the weekly time frame, Coinvo Trading highlighted that the same Rainbow pattern that occurred in previous cycles before every major ETH rally has returned. When ETH retests the middle of the Rainbow chart, the altcoin usually blows up.

The altcoin is currently retesting the same level after hitting it once more. Should history repeat itself, ETH could be set for one of its most significant rallies. While investors are sitting on the sidelines waiting for a sign of an upswing, the expert stated that this repeating rainbow pattern is the signal they have been anticipating.

ETH trading at $2,004 on the 1D chart | Source: ETHUSDT on Tradingview.com

Трендові криптовалюти

Пов'язані питання

QWhat key price level did Ethereum briefly surpass before falling back below it?

AEthereum briefly surpassed the $2,000 mark before falling back below it.

QAccording to Santiment, what two on-chain activities reached historic levels?

AThe creation of new wallet addresses and total network activity (active addresses) reached historic levels.

QBy what percentage did the number of new Ethereum wallet addresses increase compared to 10 years ago?

AThere was a more than 1,967% increase in new wallet addresses compared to 10 years ago.

QWhat pattern, according to the trader Coinvo Trading, is repeating on Ethereum's chart and what has it preceded in the past?

AThe Rainbow pattern is repeating. In the past, this pattern has preceded every major ETH rally.

QWhat is the potential significance of a steady increase in the creation of new Ethereum wallets?

AA steady increase in wallet creation often signals deeper network usage and growing popularity, which may trigger a larger price surge.

Пов'язані матеріали

The Entire Internet Hails Noam's Joining, But OpenAI's Loss Bill Just Got Thicker

While the AI community celebrates Noam Shazeer, co-author of the "Attention Is All You Need" paper, joining OpenAI as Head of Architectural Research, the company's audited financials reveal a starkly different reality. In 2025, OpenAI reported $13.07 billion in revenue but a massive $20.92 billion operating loss. Even excluding a one-time accounting charge, the cash burn is severe, with $3.7 billion consumed in Q1 2026 alone. This high-profile hiring occurs against a backdrop of significant internal research talent drain, with key founders and researchers departing as the company's focus shifts from exploratory research to product iteration. Meanwhile, OpenAI's fundamental business model faces a deep crisis. It paid Microsoft $10.59 billion for compute in 2025, while its vast user base of 9 billion weekly actives includes only 50 million paying customers, making growth a direct driver of escalating costs. The article argues Shazeer's recruitment is less about technical necessity and more about crafting a compelling narrative for OpenAI's upcoming IPO, aiming to justify a rumored $1 trillion valuation to future public market investors. It contrasts OpenAI's strategy with Anthropic's reported path to profitability, which relies on a strong enterprise customer base and cost control, rather than star-powered narratives. Ultimately, the piece concludes that while Shazeer's architectural work may take 1-2 years to materialize, OpenAI's financial clock is ticking much faster, with its massive losses undercutting the celebratory headlines.

marsbit1 год тому

The Entire Internet Hails Noam's Joining, But OpenAI's Loss Bill Just Got Thicker

marsbit1 год тому

Market Trend (June 19): US-Iran Deal Drives Out Geopolitical Premium; Chip Stocks Soar to New Highs; Energy Sector Leads Declines

U.S. Market Trends (June 19): U.S.-Iran Deal Eases Tensions, Chip Stocks Soar, Energy Sector Leads Declines. U.S. stocks rallied on Thursday as the signing of a temporary U.S.-Iran deal in Geneva de-escalated Middle East tensions, with Saudi oil tankers transiting the Strait of Hormuz. This geopolitical relief helped markets recover from recent Fed-driven volatility. The S&P 500 rose over 1%, the Nasdaq gained nearly 2%, and the Dow Jones Industrial Average closed at another record high. The Philadelphia Semiconductor Index surged over 6% to a historic peak. Chip stocks were the standout performers. Reports of an Apple-Intel design and foundry deal for certain products, alongside mentions of potential Nvidia and SpaceX collaborations with Intel, propelled the sector. Intel surged ~10.5%, while memory chip makers like Micron also saw significant gains, highlighting sustained confidence in long-term AI capital expenditure. In contrast, the energy sector was the day's sole loser, with the S&P 500 energy sub-index declining as WTI crude fell ~2% to around $74.29/barrel. The reopening of key shipping routes erased prior geopolitical risk premiums. SpaceX extended losses for a second day on news of a potential large bond offering. Market volatility (VIX) dropped sharply, indicating a swift reversal of post-Fed jitters. Treasury yields dipped slightly but remained elevated. The focus now shifts to upcoming economic data, including next week's PCE inflation report and Micron's earnings, which will serve as a key test for the AI trade's durability.

marsbit2 год тому

Market Trend (June 19): US-Iran Deal Drives Out Geopolitical Premium; Chip Stocks Soar to New Highs; Energy Sector Leads Declines

marsbit2 год тому

Торгівля

Спот
Ф'ючерси

Популярні статті

Як купити T

Ласкаво просимо до HTX.com! Ми зробили покупку Threshold Network Token (T) простою та зручною. Дотримуйтесь нашої покрокової інструкції, щоб розпочати свою криптовалютну подорож.Крок 1: Створіть обліковий запис на HTXВикористовуйте свою електронну пошту або номер телефону, щоб зареєструвати обліковий запис на HTX безплатно. Пройдіть безпроблемну реєстрацію й отримайте доступ до всіх функцій.ЗареєструватисьКрок 2: Перейдіть до розділу Купити крипту і виберіть спосіб оплатиКредитна/дебетова картка: використовуйте вашу картку Visa або Mastercard, щоб миттєво купити Threshold Network Token (T).Баланс: використовуйте кошти з балансу вашого рахунку HTX для безперешкодної торгівлі.Треті особи: ми додали популярні способи оплати, такі як Google Pay та Apple Pay, щоб підвищити зручність.P2P: Торгуйте безпосередньо з іншими користувачами на HTX.Позабіржова торгівля (OTC): ми пропонуємо індивідуальні послуги та конкурентні обмінні курси для трейдерів.Крок 3: Зберігайте свої Threshold Network Token (T)Після придбання Threshold Network Token (T) збережіть його у своєму обліковому записі на HTX. Крім того, ви можете відправити його в інше місце за допомогою блокчейн-переказу або використовувати його для торгівлі іншими криптовалютами.Крок 4: Торгівля Threshold Network Token (T)Легко торгуйте Threshold Network Token (T) на спотовому ринку HTX. Просто увійдіть до свого облікового запису, виберіть торгову пару, укладайте угоди та спостерігайте за ними в режимі реального часу. Ми пропонуємо зручний досвід як для початківців, так і для досвідчених трейдерів.

458 переглядів усьогоОпубліковано 2024.12.10Оновлено 2026.06.02

Як купити T

Обговорення

Ласкаво просимо до спільноти HTX. Тут ви можете бути в курсі останніх подій розвитку платформи та отримати доступ до професійної ринкової інформації. Нижче представлені думки користувачів щодо ціни T (T).

活动图片