Bitcoin's Short-Term Bear-to-Bull Transition: Will History Repeat Itself? | Invited Analysis

Odaily星球日报Опубліковано о 2026-01-19Востаннє оновлено о 2026-01-19

Анотація

Summary of Bitcoin Market Analysis by Conaldo (Odaily Guest Analyst): This weekly trading report provides a technical analysis of Bitcoin's recent price action and outlines short-term trading strategies. The analyst, leveraging proprietary quantitative models (Momentum Quant, Sentiment Quant, and Spread Trading models), reviews the past week and forecasts the upcoming period. **Key Points & Performance:** * **Strategy Execution:** A single short-term, leveraged (1x) trade was executed last week, resulting in a -1.07% return. The trade was closed according to strict risk management rules after the market moved against the initial short signal. * **Price Validation:** The previous week's core prediction was validated as BTC's price successfully broke through the key resistance zone of $94,500-$95,000, reaching a high near $97,963. * **Current Market Structure:** The weekly chart analysis indicates the overall trend remains bearish, requiring caution. The daily chart shows a recent rebound with initial signs of bullish momentum, though its sustainability is not yet confirmed. **Technical Outlook & Key Levels (Jan 19-25):** * **Critical Zone:** The $94,500-$95,000 area is identified as the crucial level to watch for determining short-term direction. * **Resistance Levels:** Key resistance areas are $94,500-$95,000, $97,500-$99,500, and a major level near $102,000 (the 21-week moving average). * **Support Levels:** Key support areas are $89,500-$91,000, $86,000-$86,...

Odaily invited market analyst Conaldo, a Master of Financial Statistics from Columbia University, who has focused on quantitative trading in U.S. stocks since college and gradually expanded into digital assets such as Bitcoin. He has developed a systematic quantitative trading model and risk control system through practical experience; possesses keen data insight into market fluctuations, and is committed to continuous growth in the professional trading field, pursuing steady returns. He will delve into BTC technical, macroeconomic, and capital flow changes weekly, review and showcase practical strategies, and preview noteworthy upcoming events for reference.
Trading Weekly Report Core Summary:

• Strategy Execution (Short-term): Last week's trading strictly followed the established strategy, completing one short-term operation (1x leverage) with a return of -1.07%. (See Figure 1)

• Core View (Short-term) Validation: The core view proposed last week has been precisely validated by the market. Over the past week, the price broke through the key resistance range of $94,500~$95,000 and is currently confirming its validity. The price reached a high of $97,963, differing by less than 0.5% from the given resistance lower bound of $97,500, once again confirming our ability to judge key points.

• Market Outlook for the Coming Weeks: Is Bitcoin about to transition from a bear market to a bull market? Is the current market a rebound or a reversal? The 21-week moving average may become the market's bull-bear dividing line in the future. (Detailed explanation in Figure 4)

The following will review market predictions, strategy execution, and specific trading processes in detail.

I. Bitcoin Market Review Last Week: (01.12~01.18)

1. Last Week's Short-term Operation Review: As shown in (Figure 1)

We strictly followed the trading signals from our self-built spread trading model and momentum quantitative model, combined with market trend predictions, to complete one short-term operation. This trade resulted in a loss of 1.07%.

Specific trade details and review are as follows:

Bitcoin 30-minute K-line chart: (Momentum Quantitative model + Spread Trading model)
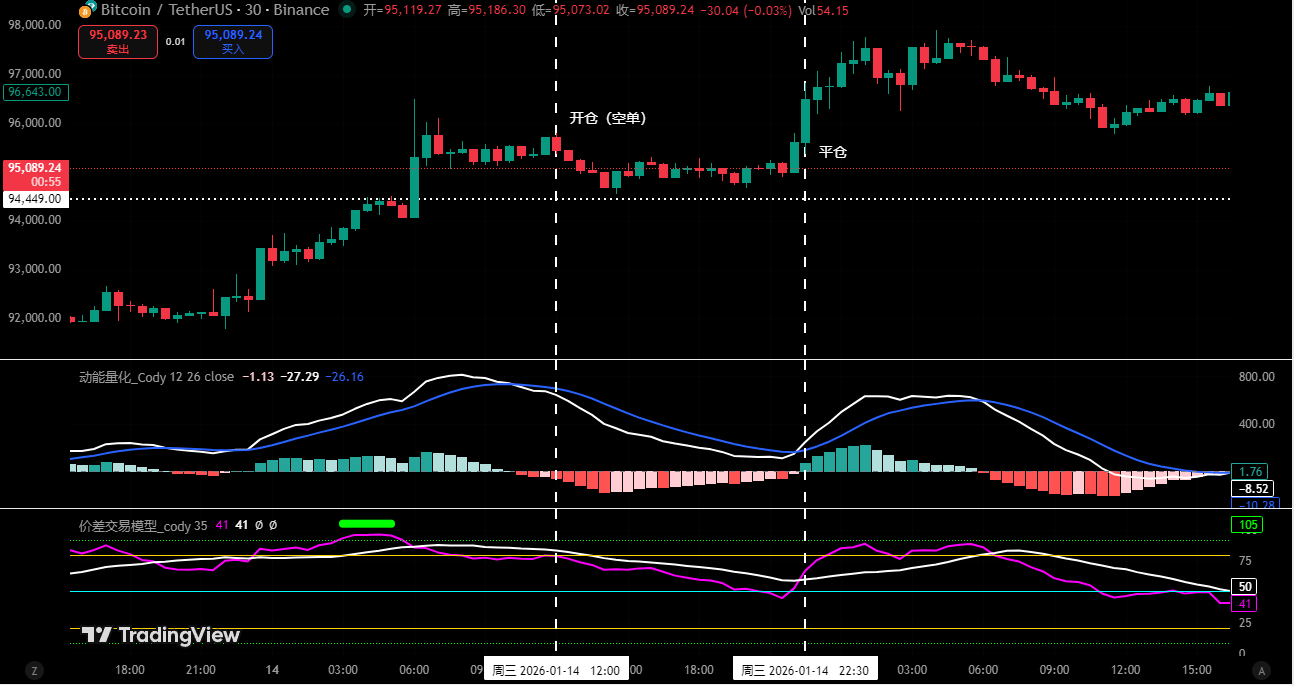
Figure 1

1. Trade Details Summary: (No leverage)

2. Short-term Trade Review:

• First Trade (Loss 1.07%): This operation executed Plan A (Selling short at resistance) strategy: When the price rose to the key resistance area of $94,500~$95,000 and showed signs of resistance, the spread trading model simultaneously triggered a top signal (green dot), forming double confirmation. Accordingly, we established a 30% short position at $95,460 as planned; however, the market deviated from expectations, finding support near $94,500 and turning upward. When the momentum quantitative model and spread trading model triggered a bottom signal again, we immediately stopped loss and exited at $96,493. Although this trade resulted in a loss, we strictly adhered to the operational discipline of "trading upon signal trigger, risk control first", achieving unity of knowledge and action.

2. Last Week's Trend Prediction and Operation Strategy Review:

1. Last week clearly stated: Maintain oscillation within the $84,000~$94,500 range, focusing on directional choices and validity at both ends of the range.

2. Key point review: Resistance at $94,500~$95,000 area, important resistance near $97,500~$99,500; support at $89,500~$91,000 area.

2. Operation Strategy Review:

• Midline Strategy: If the price successfully breaks through and stabilizes above $94,500, close all midline positions (short positions) and hold coins观望.

• Short-term Strategy: If maintaining oscillation within the $84,000~$94,500 range, execute operations according to Plan A:

• Open Position: When rebounding to the $94,500~$95,000 area combined with model top signals, establish a 30% short position.

• Risk Control: Initial stop loss for short positions set about 1.5% above the entry price (i.e., 1.015 * entry price).

• Close Position: When falling near core support levels combined with model signals, gradually close positions to take profits.

II. Analyzing Bitcoin's Price Structure from a Technical Perspective: Comprehensive Judgment Based on Multiple Models and Dimensions

Combining market movements, the author conducts an in-depth analysis of Bitcoin's price structure from multiple models and dimensions based on a self-built trading system.

Bitcoin Weekly K-line chart: (Momentum Quantitative Model + Sentiment Quantitative Model)
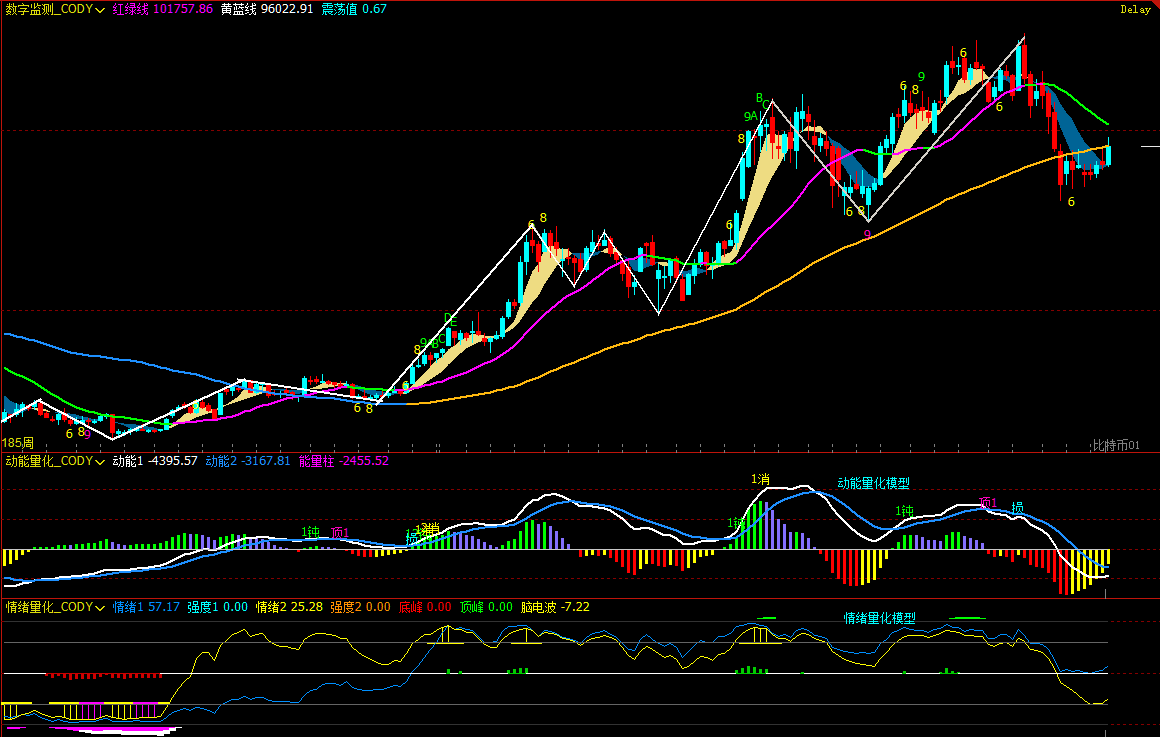
Figure 2

1. As shown in (Figure 2), analysis from the weekly chart:

Momentum Quantitative Model: Technical indicators show, continuing the pattern of previous weeks, the momentum lines are gradually converging, while the negative energy bars continue to shrink. However, the current signals do not confirm a reversal of the bearish trend.

Momentum Quantitative Model indicates: Price decline index: High

Sentiment Quantitative Model: Blue sentiment line value 57.17, strength zero; yellow sentiment line value 25.28, strength zero, peak value is 0.

Sentiment Quantitative Model indicates: Price pressure and support index: Neutral

Digital Monitoring Model: The price has been below the bull-bear (yellow-blue line) dividing line for 9 weeks. Last week, the bulls once again冲击 this line, closing near below.

Digital Monitoring Model indicates: Monitoring (top/bottom) digital signals have not appeared; weekly K-line closed as a medium阳线, gain about 2.92%.

The above data suggests: Bitcoin weekly chart is in a bearish trend, be wary of oscillation adjustment risks.

Bitcoin Daily K-line chart: (Momentum Quantitative Model + Sentiment Quantitative Model)
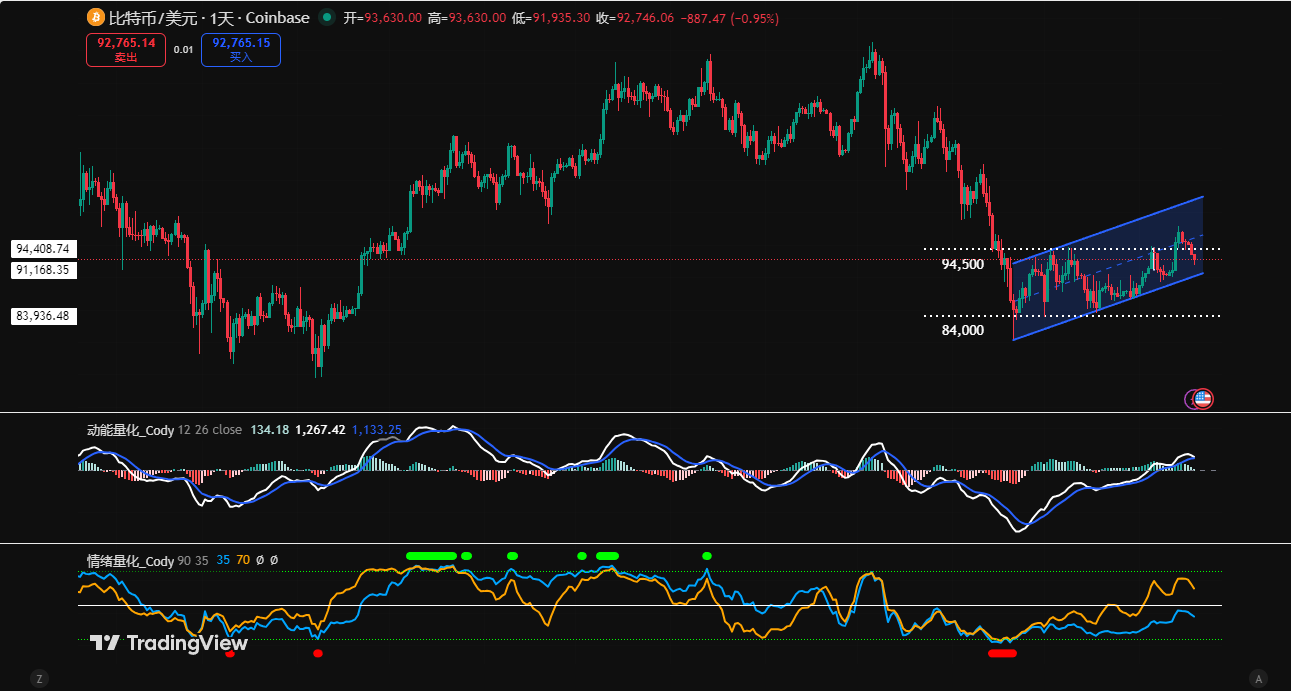
Figure 3

2. As shown in (Figure 3), analysis from the daily chart:

Momentum Quantitative Model: Last week overall showed a "first rise then fall" pattern. In the first half of the week, the price accelerated its rebound, the momentum line stood above the zero axis, and the positive energy bars rapidly expanded; but in the latter half, the energy bars明显萎缩, the momentum lines converged again, slowly approaching the zero axis.

Momentum Quantitative Model indicates: Daily chart bullish momentum shows exhaustion, focus on the gain/loss of the zero axis.

Sentiment Quantitative Model: After last week's daily close, blue sentiment line value 38, strength zero; yellow sentiment line value 76, strength zero.

Sentiment Quantitative Model indicates: Pressure and support index: Neutral

The above data suggests: The daily level rebound continues, the market initially shows a bullish pattern, but validity needs confirmation. Next, focus on the battle between bulls and bears over the zero axis.

III. This Week's Market Prediction: (01.19~01.25)

1. This Week's Core View: Focus on the gain/loss of the $94,500~$95,000 area.

Resistance Effective: If the price rebounds to this area and confirms resistance, it is expected to maintain oscillation within the $84,000~$94,500 range, with the subsequent first test target at the $89,500~$91,000 area.

Effectively Stabilized: If it can strongly stabilize above this area, the price is expected to oscillate and rebound, but the height is limited.

2. Core Resistance Levels:

• First Resistance Area: $94,500~$95,000 area (previous box edge)

• Second Resistance Area: $97,500~$99,500 area (previous oscillation center)

• Important Resistance Level: Near $10,200 (near the 21-week moving average)

3. Core Support Levels:

• First Support Level: $89,500~$91,000 area (previous筹码密集成交区)

• Second Support Level: $86,000~$86,500 area (previous important support level)

• Important Support Level: Near $84,000 (previous box lower edge)

IV. This Week's Operation Strategy (Excluding Sudden News Impact): (01.19~01.25)

1. Midline Strategy: No position, market trends may oscillate and fluctuate,暂时持币观望.

2. Short-term Strategy: Use 30% of position, set stop loss points, based on support and resistance levels, look for "spread" opportunities. (Using 30 minutes as the operation cycle).

3. In operation, focus on the gain/loss of the $94,500~$95,000 area. To dynamically respond to market changes combined with real-time model signals, we have prepared two short-term operation plans, A/B:

Plan A: If the price stabilizes above the $94,500~$95,000 area:

• Open Position: After the price breaks through the $94,500~$95,000 area and shows stabilization signals, combined with model bottom signals, establish a 30% long position.

• Risk Control: Initial stop loss for long positions set about 1.5% below the entry price (i.e., 0.985 * entry price).

• Close Position: When rebounding near core resistance levels combined with model signals, gradually close positions to take profits.

Plan B: If the price effectively breaks below the $94,500~$95,000 area:

• Open Position: If the rebound confirms a effective break below this area, establish a 30% short position.

• Risk Control: Initial stop loss for short positions set about 1.5% above the entry price (i.e., 1.015 * entry price).

• Close Position: When falling near $86,500 combined with model signals, gradually close positions to take profits.

Bitcoin Weekly K-line Chart: Comparative Analysis of Historical Price Structure (2021.11 VS 2025.10)
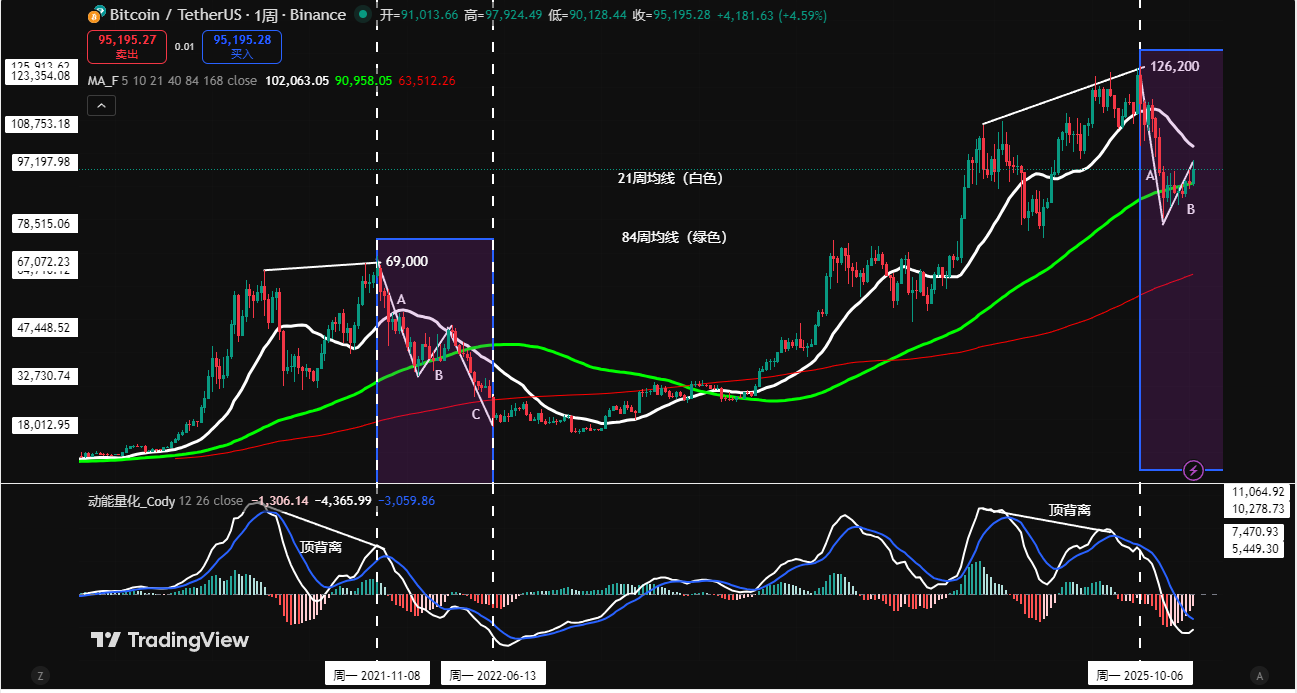
Figure 4

Note: In the above figure, 21-week moving average (white), 84-week moving average (green)

V. How Will History Repeat? Similarities, Differences, and Lessons from Two Rounds of Weekly Level Adjustments:
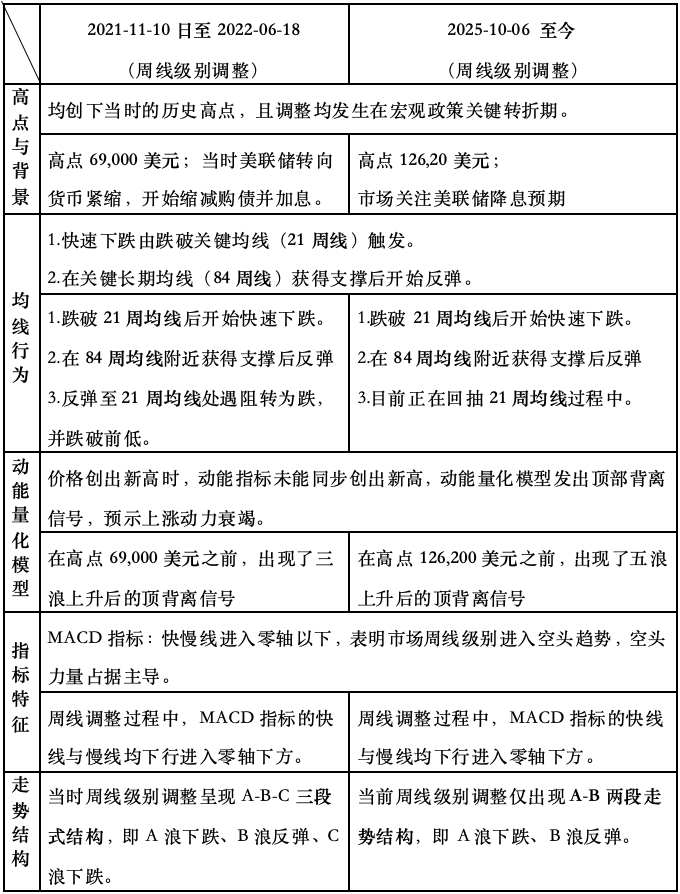
In summary, we can extract the following core insights:

1. The current weekly level is in a bearish trend, which limits the space for daily rebounds.

2. In the coming weeks, whether the price can effectively break through and stabilize above the 21-week moving average will become the market's focus. If the price fails to form an effective breakthrough when rebounding to this moving average, the market may repeat the historical adjustment pattern, even breaking below the $80,000 mark.

3. Whether the weekly level MACD indicator can show signs of stopping decline and stabilizing, and the momentum line effectively crosses above the zero axis, becomes a key basis for judging whether the market trend has reversed.

VI. Special Notes:​​

1. When opening a position: Immediately set the initial stop loss level.

2. When profit reaches 1%: Move the stop loss to the entry price (break-even point) to ensure capital safety.

3. When profit reaches 2%​​: Move the stop loss to the 1% profit level.

4. Continuous tracking: Thereafter, for every additional 1% profit, move the stop loss同步 by 1%, dynamically protecting and locking in profits.

Financial markets change rapidly, all market analysis and trading strategies require dynamic adjustment. All views, analytical models, and operation strategies involved in this article are derived from personal technical analysis, for personal trading log purposes only, and do not constitute any investment advice or operational basis. The market has risks, investment needs caution, DYOR.


Трендові криптовалюти

Пов'язані питання

QWhat was the outcome of the short-term trading operation executed last week according to the article?

AThe short-term trading operation resulted in a loss of 1.07%.

QWhat is the key price zone that the article identifies as crucial for Bitcoin's price action this week?

AThe crucial price zone for Bitcoin's price action this week is $94,500 to $95,000.

QAccording to the analyst's models, what is the current trend on the weekly chart for Bitcoin?

AThe weekly chart is currently in a bearish trend, indicating a high probability of a price decline.

QWhat historical indicator does the article suggest is a critical focal point for determining a potential market reversal?

AThe 21-week moving average is suggested as a critical focal point for determining a potential market reversal.

QWhat are the two trading models mentioned as the basis for the analyst's trading signals?

AThe two trading models mentioned are the Spread Trading Model and the Momentum Quant Model.

Пов'язані матеріали

After Three Consecutive Quarters of Decline, Can the Crypto Market Find a Window for Stabilization in Q3?

The cryptocurrency market has just concluded its worst-performing quarter since 2022, with total capitalization dropping 12.6% to $2.1 trillion. All core metrics indicate capital is leaving the sector, not just rotating within it. Bitcoin fell 14.2% and Ethereum dropped 25.4% in Q2, breaking their previous correlation with US tech stocks. A key driver is the reversal in US spot Bitcoin ETF flows, which saw a net outflow of approximately $4.67 billion in Q2, including a record monthly outflow near $4.5 billion in June. While recent data suggests long-term holders are accumulating again, sustained ETF outflows mean continued selling pressure. Market focus is now singularly on the Federal Reserve. The upcoming July FOMC meeting is seen as the most critical event for Q3. A dovish signal could support Bitcoin reclaiming a $68,000-$84,000 range, while a hawkish stance might establish a new trading band around $50,000-$56,000. Additionally, regulatory uncertainty persists, with the progress of the crucial *CLARITY Act* stalling in the Senate, reducing its perceived 2026 passage probability to 40-45%. Despite the broad downturn, a few sectors showed growth. Prediction markets saw nominal volume surge 48.7% year-over-year to $113.8 billion, and tokenized collectibles transaction volume rose 143% quarterly to $1.4 billion. The Real-World Asset (RWA) tokenization sector also continued steady growth, now representing ~$28.1 billion in on-chain value. The market's foundation for an extreme crash appears limited, with Bitcoin price hovering near its 200-week moving average. However, the trading paradigm has shifted from narrative-driven speculation to decisions based on price action, policy developments, and interest rate expectations, making a broad sentiment-driven rally unlikely in the near term.

marsbit47 хв тому

After Three Consecutive Quarters of Decline, Can the Crypto Market Find a Window for Stabilization in Q3?

marsbit47 хв тому

BIT Trading Moment: BTC Still Suppressed by Weekly 200 EMA, Rejection May Restart Decline; Storage and Semiconductors that Surged Last Night Begin Falling in Evening Trading

**Crypto & Stock Market Wrap: Bitcoin Tests Resistance, Stocks Retreat After AI Surge** Bitcoin consolidates around $66,000, facing key resistance near $68,000—an area seen as a major psychological and technical hurdle where previous rallies have failed. Analysts note the cryptocurrency is caught between its 200-week moving average (~$63,333) and 200-week EMA (~$68,328). A clear break above $68k is needed to signal a stronger bullish trend, while a rejection could lead to a retest of $63k support. Market sentiment remains cautious, with low futures open interest pointing to a low-liquidity rebound rather than a full bull market. Bitcoin spot ETFs saw another $203 million inflow. US stock futures pointed lower after a strong Tuesday session led by a massive rebound in semiconductors and memory stocks. The rally was fueled by renewed optimism about AI-driven hardware demand, with Micron, SanDisk, and SK Hynix surging. However, those gains reversed in pre-market trading. Super Micro Computer (SMCI) soared over 20% after hours on strong guidance and a record backlog. Other standouts included Rocket Lab and nuclear energy plays Oklo and X-Energy. Rising oil prices (Brent above $91) and climbing Treasury yields (10-year near 4.64%), however, are reigniting inflation concerns and acting as a headwind for equities. In Asia, markets were mixed. South Korea's KOSPI pared early gains to close slightly higher as semiconductor stocks like SK Hynix gave back initial surges. Japan's Nikkei edged lower as the yen hit a fresh 38-year low against the dollar, raising fears of potential market intervention. Key events to watch include the Samsung Galaxy launch, AMD's AI event, and a slew of major tech earnings from Alphabet, Tesla, and IBM after the close on Wednesday, followed by the ECB meeting and Intel's earnings on Thursday.

marsbit55 хв тому

BIT Trading Moment: BTC Still Suppressed by Weekly 200 EMA, Rejection May Restart Decline; Storage and Semiconductors that Surged Last Night Begin Falling in Evening Trading

marsbit55 хв тому

Former CFTC Chairman, Circle President Tarbert: Preaching Long-Termism While Cashing Out $30 Million Himself

Former CFTC Chairman and Circle President Heath Tarbert has consistently advocated for a long-term vision in public, urging patience from investors as Circle’s stock price has fallen significantly from its peak. However, it has been revealed that since Circle’s IPO, Tarbert has continuously sold his CRCL shares through pre-arranged trading plans, cashing out approximately $30 million, without making any public market purchases. This contrast between his public messaging and personal actions has drawn criticism. Tarbert joined Circle in July 2023 as Chief Legal Officer, leveraging his regulatory experience to help guide the company through its IPO and expansion. Despite promoting stablecoins as long-term infrastructure, he established a 10b5-1 trading plan just before Circle went public, leading to substantial stock sales over the following year. In March 2026, he initiated another plan to sell more shares. His career trajectory highlights a pattern of moving between high-level regulatory roles and influential positions in the financial sector. After resigning as CFTC Chairman in early 2021, he joined Citadel Securities as Chief Legal Officer just 27 days later, during a period of intense regulatory scrutiny for the firm. He later joined Circle, aiding its efforts to navigate regulatory challenges for its public listing. While Tarbert's expertise in policy and compliance is valuable to companies like Circle, his actions—advocating long-term confidence while personally divesting—raise questions about the alignment between his public statements and his private financial decisions, leaving investors who followed his advice to bear the market risks.

marsbit1 год тому

Former CFTC Chairman, Circle President Tarbert: Preaching Long-Termism While Cashing Out $30 Million Himself

marsbit1 год тому

Gate Research Institute: The 'Wall Street-ization' Wave of Crypto Financial Products – Competition or Integration?

The article titled "Gate Research Institute: Are Crypto Financial Products Sparking a 'Wall Street' Wave—Competition or Convergence?" explores the evolving relationship between the crypto ecosystem and traditional finance (TradFi). The piece begins by reflecting on Bitcoin's original 2009 vision of decentralization, disintermediation, and moving away from banks. It then contrasts this with the 2024 landscape, where key crypto assets like Bitcoin are increasingly held through Wall Street products like ETFs issued by giants like BlackRock. The article questions whether this signifies that TradFi is systematically taking over the rights to issue, price, custody, and distribute crypto financial assets. The core argument is that this is not a zero-sum takeover but rather a bidirectional convergence where each side addresses the other's weaknesses. Crypto offers 24/7 global markets, programmable settlement, and open access but lacks compliant channels, institutional-grade custody, deep fiat liquidity, and mainstream distribution. TradFi possesses these but is constrained by legacy systems, limited operating hours, and slow settlement. Two primary convergence paths are highlighted: * **Path A (CEX to TradFi):** Exemplified by Gate, which has progressed from offering tokenized stocks and CFDs to providing direct, real stock trading (US, Hong Kong, South Korea) within its platform, using USDT. * **Path B (TradFi to Crypto):** Exemplified by Robinhood, which has integrated crypto trading, acquired exchanges like Bitstamp, and is moving traditional assets like stocks onto the blockchain via tokenization and its own Layer 2. Both paths are ultimately competing to become the next-generation, unified financial account—a "super account" where users can seamlessly trade cryptocurrencies, stocks, ETFs, RWA (Real World Assets), and tokenized treasury products in one interface. The growth of RWA and tokenized treasuries (e.g., BlackRock's BUIDL) is presented as the asset-layer fusion, providing stable, yield-bearing assets on-chain and acting as a bridge between the two worlds. In conclusion, the "Wall Street-ization" of crypto is framed as a mutual transformation. Decentralized ideals persist in the protocol layer, while at the application layer, a more efficient, global, and accessible unified capital market is emerging from this convergence. The future competition lies not between crypto exchanges and stockbrokers, but between platforms vying to offer the most comprehensive asset coverage, liquidity, and user experience within a single account.

marsbit1 год тому

Gate Research Institute: The 'Wall Street-ization' Wave of Crypto Financial Products – Competition or Integration?

marsbit1 год тому

Торгівля

Спот

Популярні статті

Що таке BITCOIN

Розуміння HarryPotterObamaSonic10Inu (ERC-20) та його позиції у крипто-просторі Останніми роками ринок криптовалют спостерігав за зростанням популярності мем-коінів, які привертають інтерес не тільки трейдерів, але й тих, хто шукає спілкування та розважальну цінність. Серед цих унікальних токенів є HarryPotterObamaSonic10Inu (ERC-20), інтригуючий проект, що поєднує культурні посилання з тканинами криптовалюти. Ця стаття досліджує ключові аспекти HarryPotterObamaSonic10Inu, вивчаючи його механізми, спільноту та його взаємодію з ширшим крипто-ландшафтом. Що таке HarryPotterObamaSonic10Inu (ERC-20)? Як випливає з його назви, HarryPotterObamaSonic10Inu є мем-коіном, побудованим на блокчейні Ethereum, класифікованим за стандартом ERC-20. На відміну від традиційних криптовалют, які можуть підкреслювати практичну корисність або інвестиційний потенціал, цей токен процвітає завдяки розважальній цінності та силі своєї спільноти. Проект спрямований на створення середовища, де зацікавлені користувачі можуть об'єднуватися, ділитися ідеями та брати участь у заходах, натхненних різноманітними культурними явищами. Однією з примітних особливостей HarryPotterObamaSonic10Inu є нульовий податок на транзакції. Цей привабливий елемент має на меті заохочувати торгівлю та участь у спільноті, позбавлену додаткових витрат, які можуть відлякувати дрібних трейдерів. Загальна пропозиція монет становить один мільярд токенів, що позначає намір підтримувати суттєву циркуляцію в межах спільноти. Творець HarryPotterObamaSonic10Inu (ERC-20) Походження HarryPotterObamaSonic10Inu дещо окутане таємницею; деталі про творця залишаються невідомими. Розвиток цього токена позбавлений впізнаваної команди або чіткої стратегії, що не є рідкістю в секторі мем-коінів. Натомість проект виник органічно, а його розвиток значною мірою залежить від ентузіазму та участі його спільноти. Інвестори HarryPotterObamaSonic10Inu (ERC-20) Щодо зовнішніх інвестицій та підтримки, HarryPotterObamaSonic10Inu також залишається невизначеним. Токен не зазначає жодних відомих інвестиційних фондів або значної організаційної підтримки. Натомість життєва сила проекту полягає в його базовій спільноті, яка інформує про його зростання та стійкість через колективні дії та залученість у крипто-просторі. Як працює HarryPotterObamaSonic10Inu (ERC-20)? Як мем-коін, HarryPotterObamaSonic10Inu функціонує передусім поза традиційними рамками, що часто регулюють вартість активів. Є кілька відмінних аспектів, що визначають, як працює проект: Транзакції без податку: Завдяки відсутності податкових зборів на транзакції, користувачі можуть вільно купувати та продавати токен, не турбуючись про приховані витрати. Залучення спільноти: Проект процвітає завдяки взаємодії спільноти, використовуючи соціальні медіа для створення шуму та сприяння залученню. Обговорення, обмін контентом та залученість є ключовими елементами, що допомагають розширити його охоплення та зміцнити лояльність серед прихильників. Відсутність практичної корисності: Слід зазначити, що HarryPotterObamaSonic10Inu не пропонує конкретної корисності в рамках фінансової екосистеми. Натомість він класифікується як токен, що призначений в основному для розваги та спільнотних активностей. Культурне посилання: Токен кмітливо вплітає елементи популярної культури, щоб привернути інтерес, зв'язуючи з ентузіастами мемів та крипто-стежками. HarryPotterObamaSonic10Inu ілюструє, як мем-коіни функціонують інакше, ніж традиційні криптовалютні проекти, увійшовши на ринок як інноваційні соціальні конструкти, а не утилітарні активи. Хронологія HarryPotterObamaSonic10Inu (ERC-20) Історія HarryPotterObamaSonic10Inu відзначена кількома значними етапами: Створення: Токен виник з вірусного мему, захопивши уяву багатьох крипто-ентузіастів. Конкретні дати створення недоступні, що підкреслює його органічний розвиток. Лістинг на біржах: HarryPotterObamaSonic10Inu з'явився на різних біржах, дозволяючи зручніший доступ і торгівлю спільноти. Ініціативи залучення спільноти: Ведення діяльності, спрямованої на покращення взаємодії спільноти, включаючи конкурси, кампанії в соціальних мережах та створення контенту від фанатів та прихильників. Плани на майбутнє: Дорожня карта проекту включає запуск колекції NFT, мерчандайзинг та електронну комерцію, пов'язану з його культурними темами, що далі залучає спільноту та намагається додати більше вимірів до його екосистеми. Ключові моменти про HarryPotterObamaSonic10Inu (ERC-20) Спільнотний підхід: Проект надає пріоритет колективному внеску та креативності, забезпечуючи, щоб участь користувачів була в центрі його розвитку. Класифікація як мем-коін: Це є його епігенез розважальної криптовалюти, що відрізняється від традиційних інвестиційних інструментів. Жодного прямого відношення до Bitcoin: Незважаючи на схожість у назві, HarryPotterObamaSonic10Inu є відмінним і не має жодного зв’язку з Bitcoin або іншими усталеними криптовалютами. Зосередженість на співпраці: HarryPotterObamaSonic10Inu створено для того, щоб надати простір для співпраці та обміну історіями серед його власників, забезпечуючи шлях для творчості та спільного зв'язку. Перспективи на майбутнє: Амбіція розширитися за межі початкової концепції в NFT та мерчандайз відкриває шлях для проекту потенційно потрапити в більш мейнстрімні сфери цифрової культури. Оскільки мем-коіни продовжують захоплювати уяву спільноти криптовалют, HarryPotterObamaSonic10Inu (ERC-20) вирізняється своїми культурними зв'язками та орієнтованим на спільноту підходом. Хоча він може не відповідати типовій моделі утилітарного токена, його суть полягає в радощах і товариськості, що підтримуються серед його прихильників, підкреслюючи еволюційну природу криптовалют в усе більш цифрову епоху. Оскільки проект продовжує розвиватися, важливо спостерігати за тим, як динаміка спільноти вплине на його траєкторію в постійно змінюваному ландшафті технології блокчейн.

2.2k переглядів усьогоОпубліковано 2024.04.01Оновлено 2024.12.03

Що таке BITCOIN

Як купити BTC

Ласкаво просимо до HTX.com! Ми зробили покупку Bitcoin (BTC) простою та зручною. Дотримуйтесь нашої покрокової інструкції, щоб розпочати свою криптовалютну подорож.Крок 1: Створіть обліковий запис на HTXВикористовуйте свою електронну пошту або номер телефону, щоб зареєструвати обліковий запис на HTX безплатно. Пройдіть безпроблемну реєстрацію й отримайте доступ до всіх функцій.ЗареєструватисьКрок 2: Перейдіть до розділу Купити крипту і виберіть спосіб оплатиКредитна/дебетова картка: використовуйте вашу картку Visa або Mastercard, щоб миттєво купити Bitcoin (BTC).Баланс: використовуйте кошти з балансу вашого рахунку HTX для безперешкодної торгівлі.Треті особи: ми додали популярні способи оплати, такі як Google Pay та Apple Pay, щоб підвищити зручність.P2P: Торгуйте безпосередньо з іншими користувачами на HTX.Позабіржова торгівля (OTC): ми пропонуємо індивідуальні послуги та конкурентні обмінні курси для трейдерів.Крок 3: Зберігайте свої Bitcoin (BTC)Після придбання Bitcoin (BTC) збережіть його у своєму обліковому записі на HTX. Крім того, ви можете відправити його в інше місце за допомогою блокчейн-переказу або використовувати його для торгівлі іншими криптовалютами.Крок 4: Торгівля Bitcoin (BTC)Легко торгуйте Bitcoin (BTC) на спотовому ринку HTX. Просто увійдіть до свого облікового запису, виберіть торгову пару, укладайте угоди та спостерігайте за ними в режимі реального часу. Ми пропонуємо зручний досвід як для початківців, так і для досвідчених трейдерів.

5.0k переглядів усьогоОпубліковано 2024.12.12Оновлено 2026.06.02

Як купити BTC

Що таке $BITCOIN

ЦИФРОВЕ ЗОЛОТО ($BITCOIN): Комплексний аналіз Вступ до ЦИФРОВОГО ЗОЛОТА ($BITCOIN) ЦИФРОВЕ ЗОЛОТО ($BITCOIN) — це проект на основі блокчейну, що працює в мережі Solana, який має на меті поєднати характеристики традиційних дорогоцінних металів з інноваціями децентралізованих технологій. Хоча він має таку ж назву, як і Bitcoin, який часто називають “цифровим золотом” через його сприйняття як засобу збереження вартості, ЦИФРОВЕ ЗОЛОТО є окремим токеном, розробленим для створення унікальної екосистеми в ландшафті Web3. Його мета — позиціонувати себе як життєздатний альтернативний цифровий актив, хоча деталі щодо його застосувань і функціональностей все ще розробляються. Що таке ЦИФРОВЕ ЗОЛОТО ($BITCOIN)? ЦИФРОВЕ ЗОЛОТО ($BITCOIN) — це токен криптовалюти, спеціально розроблений для використання в блокчейні Solana. На відміну від Bitcoin, який виконує широко визнану роль зберігання вартості, цей токен, здається, зосереджується на більш широких застосуваннях і характеристиках. Помітні аспекти включають: Інфраструктура блокчейну: Токен побудований на блокчейні Solana, відомому своєю здатністю обробляти швидкі та низьковартісні транзакції. Динаміка постачання: ЦИФРОВЕ ЗОЛОТО має максимальне постачання, обмежене 100 квадрильйонами токенів (100P $BITCOIN), хоча деталі щодо його обігового постачання наразі не розголошуються. Утиліта: Хоча точні функціональності не викладені, є вказівки на те, що токен може бути використаний для різних застосувань, потенційно пов'язаних з децентралізованими додатками (dApps) або стратегіями токенізації активів. Хто є творцем ЦИФРОВОГО ЗОЛОТА ($BITCOIN)? На даний момент особа творців і команди розробників, що стоять за ЦИФРОВИМ ЗОЛОТОМ ($BITCOIN), залишається невідомою. Ця ситуація є типовою для багатьох інноваційних проектів у сфері блокчейну, особливо тих, що пов'язані з децентралізованими фінансами та феноменом мем-коінів. Хоча така анонімність може сприяти культурі, орієнтованій на спільноту, вона посилює занепокоєння щодо управління та підзвітності. Хто є інвесторами ЦИФРОВОГО ЗОЛОТА ($BITCOIN)? Доступна інформація вказує на те, що ЦИФРОВЕ ЗОЛОТО ($BITCOIN) не має жодних відомих інституційних спонсорів або помітних венчурних капіталовкладень. Проект, здається, працює за моделлю “рівний до рівного”, зосереджуючись на підтримці та прийнятті спільноти, а не на традиційних шляхах фінансування. Його активність і ліквідність переважно розташовані на децентралізованих біржах (DEX), таких як PumpSwap, а не на встановлених централізованих торгових платформах, що ще більше підкреслює його підхід знизу вгору. Як працює ЦИФРОВЕ ЗОЛОТО ($BITCOIN) Операційні механізми ЦИФРОВОГО ЗОЛОТА ($BITCOIN) можна детальніше розглянути на основі його дизайну блокчейну та характеристик мережі: Механізм консенсусу: Використовуючи унікальний proof-of-history (PoH) Solana в поєднанні з моделлю proof-of-stake (PoS), проект забезпечує ефективну валідацію транзакцій, що сприяє високій продуктивності мережі. Токеноміка: Хоча конкретні дефляційні механізми не були детально описані, велике максимальне постачання токенів вказує на те, що воно може задовольняти мікротранзакції або нішеві випадки використання, які ще потрібно визначити. Інтероперабельність: Існує потенціал для інтеграції з більш широкою екосистемою Solana, включаючи різні платформи децентралізованих фінансів (DeFi). Однак деталі щодо конкретних інтеграцій залишаються невизначеними. Хронологія ключових подій Ось хронологія, яка підкреслює значні віхи, пов'язані з ЦИФРОВИМ ЗОЛОТОМ ($BITCOIN): 2023: Початкове розгортання токена відбувається на блокчейні Solana, позначене його адресою контракту. 2024: ЦИФРОВЕ ЗОЛОТО набуває видимості, оскільки стає доступним для торгівлі на децентралізованих біржах, таких як PumpSwap, що дозволяє користувачам торгувати ним проти SOL. 2025: Проект спостерігає спорадичну торгову активність і потенційний інтерес до ініціатив, очолюваних спільнотою, хоча на даний момент не зафіксовано жодних значних партнерств або технічних досягнень. Критичний аналіз Сильні сторони Масштабованість: Основна інфраструктура Solana підтримує високі обсяги транзакцій, що може підвищити утиліту $BITCOIN у різних сценаріях транзакцій. Доступність: Потенційно низька торгова ціна за токен може привабити роздрібних інвесторів, сприяючи більш широкій участі завдяки можливостям дробового володіння. Ризики Відсутність прозорості: Відсутність публічно відомих спонсорів, розробників або процесу аудиту може викликати скептицизм щодо стійкості та надійності проекту. Волатильність ринку: Торгова активність сильно залежить від спекулятивної поведінки, що може призвести до значної волатильності цін і невизначеності для інвесторів. Висновок ЦИФРОВЕ ЗОЛОТО ($BITCOIN) постає як цікавій, але неоднозначний проект у швидко розвиваючійся екосистемі Solana. Хоча він намагається використати наратив “цифрового золота”, його відхід від встановленої ролі Bitcoin як засобу збереження вартості підкреслює необхідність чіткішого розмежування його передбачуваної утиліти та структури управління. Майбутнє прийняття та адаптація, ймовірно, залежатиме від вирішення поточної непрозорості та більш чіткого визначення його операційних та економічних стратегій. Примітка: Цей звіт охоплює синтезовану інформацію, доступну станом на жовтень 2023 року, і можуть відбутися події, що виходять за межі дослідницького періоду.

160 переглядів усьогоОпубліковано 2025.05.13Оновлено 2025.05.13

Що таке $BITCOIN

Обговорення

Ласкаво просимо до спільноти HTX. Тут ви можете бути в курсі останніх подій розвитку платформи та отримати доступ до професійної ринкової інформації. Нижче представлені думки користувачів щодо ціни BTC (BTC).

活动图片













