Bitcoin’s 4% drop in 12 hours looks painful – Here’s why it could be opposite

ambcryptoОпубліковано о 2026-03-22Востаннє оновлено о 2026-03-22

Анотація

Bitcoin's recent 4% price drop to $68.2k triggered $111.4 million in long liquidations, potentially influenced by US-Iran tensions. Despite the decline, analysis suggests the dip may present a buying opportunity. Key factors include the underestimated potential impact of Morgan Stanley's Spot Bitcoin ETF and a 10.2% drop in hash rate indicating miner stress but not significant selling. Technical charts show a bearish swing structure but bullish internal momentum, with projections indicating a possible rally toward $78.4k-$89.8k. A bullish RSI divergence and Fibonacci golden pocket support this outlook. However, a drop below $65.6k would invalidate the bullish scenario.

It was reported that the potential impact of the upcoming Morgan Stanley Spot Bitcoin ETF could be underestimated.

In fact, it was projected that a 2% allocation by the $8 trillion AUM Morgan Stanley Wealth Management, which recommends a BTC allocation of up to 4%, could flip BlackRock’s IBIT in size.

Alongside these projections, the hash rate witnessed a 10.2% drop. It showcased miner stress and signaled tactical shutdowns and weaker operators leaving the network.

AMBCrypto reported that the miner reserves reflect reward absorption and not significant selling.

Volatility during weekends continued to threaten short-term holders and traders. The most recent price drop to $68.2k on Sunday, the 22nd of March, triggered $111.4 million in long liquidations in 24 hours.

It was likely a result of the flaring US-Iran tensions.

These were relatively tame numbers compared to liquidation flushes earlier this year. Could this mean that the price has further to fall?

Exploring the Bitcoin retracement phase
Source: BTC/USDT on TradingView

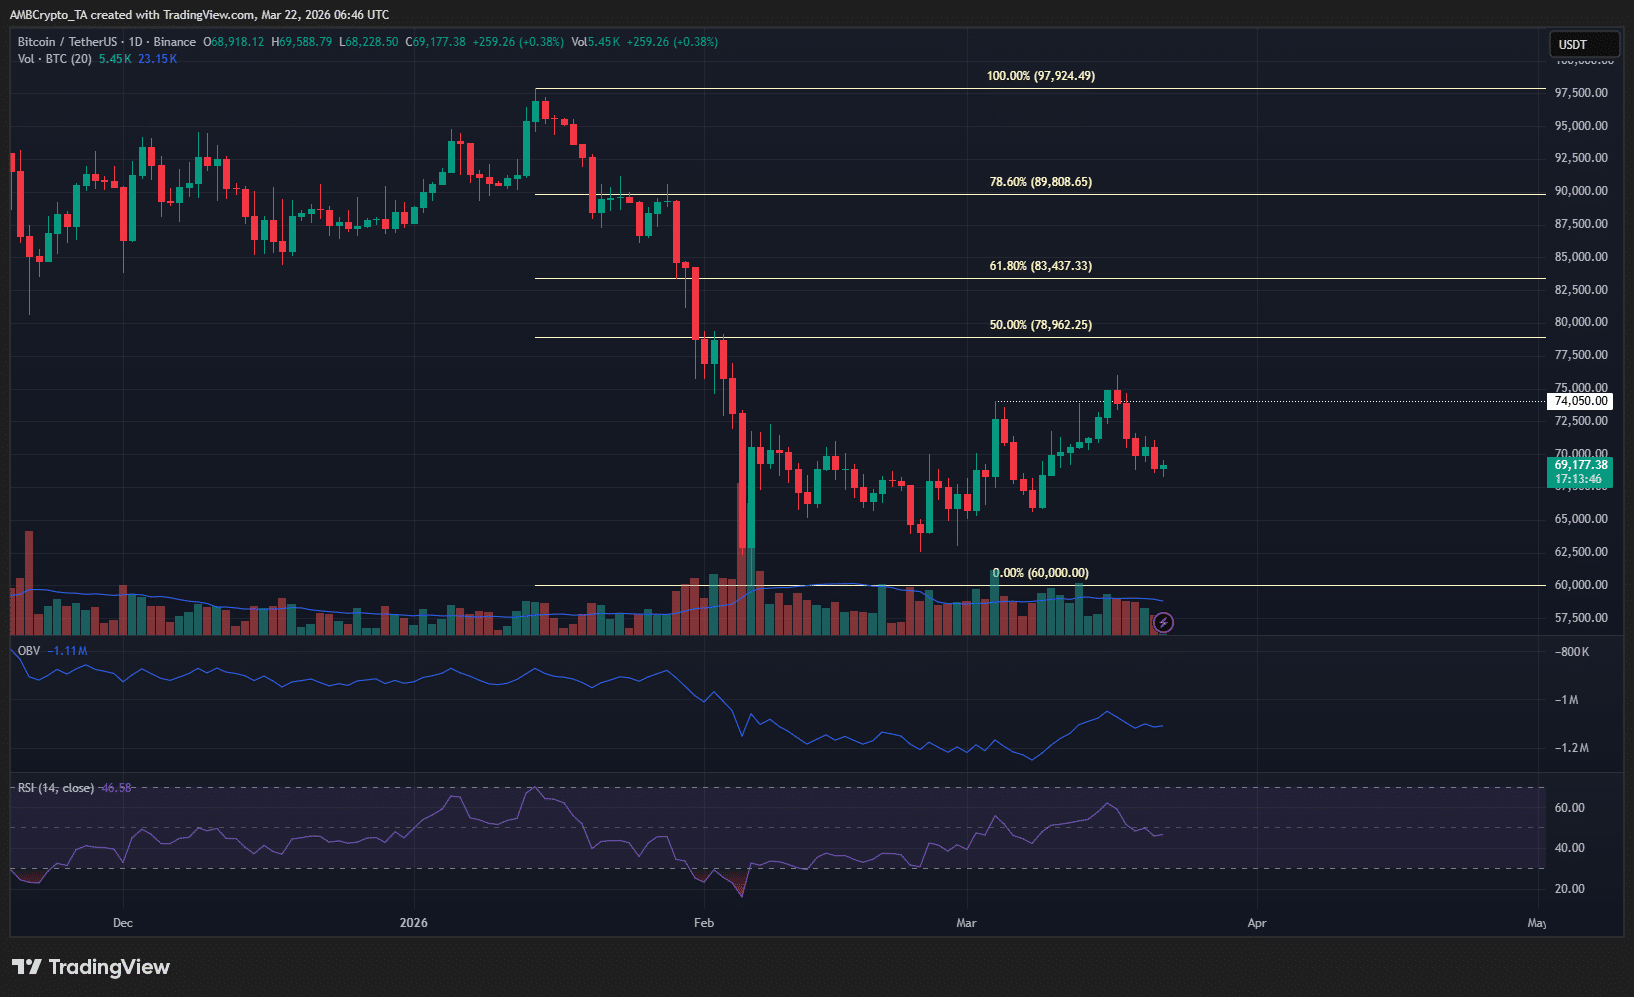
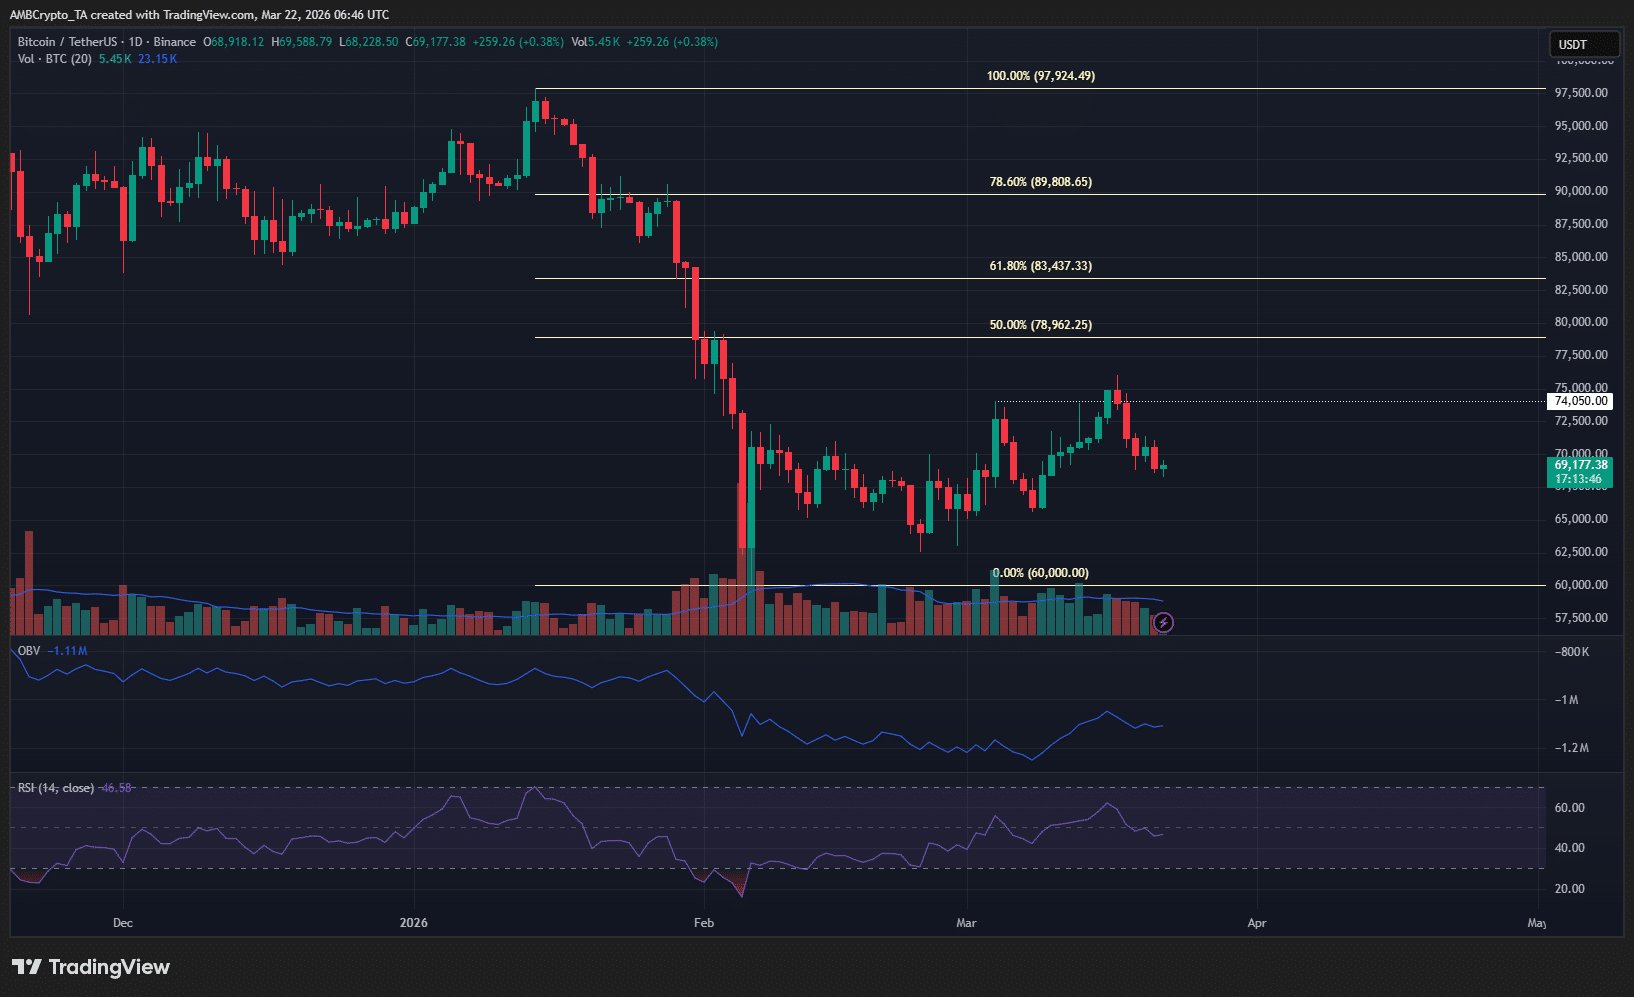
The 1-day chart was straightforward. The swing structure was bearish, but the internal structure has flipped bullishly.

This meant that Bitcoin [BTC] was likely to push higher in the coming weeks, despite the dip in hash rate.

The current rally is part of a wider retracement that can go up to $83.4k-$89.8k.

Traders’ call to action- Buy

In a post on X, crypto trader CrypNuevo observed that the drop to the $69k level could see a price rebound. It could also be accompanied by a deeper price drop, which has occurred in recent hours.
Source: BTC/USDT on TradingView

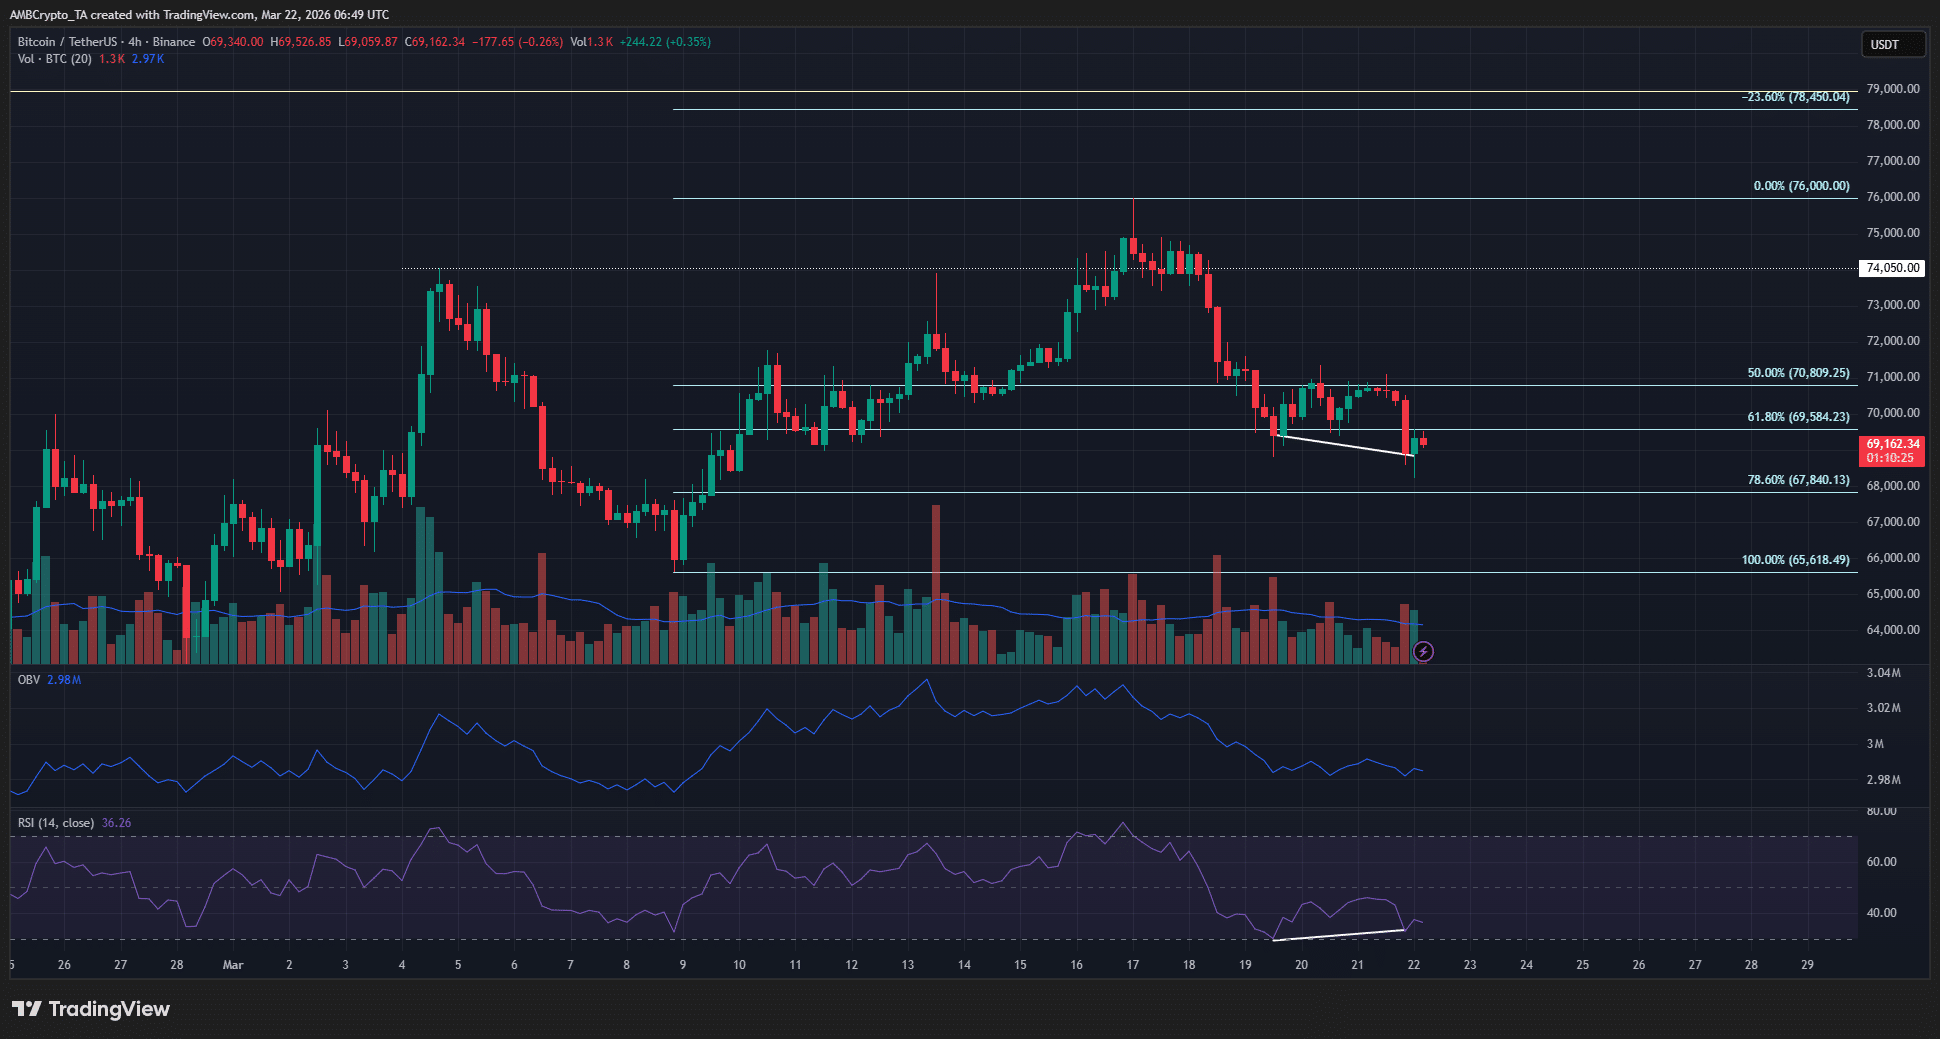
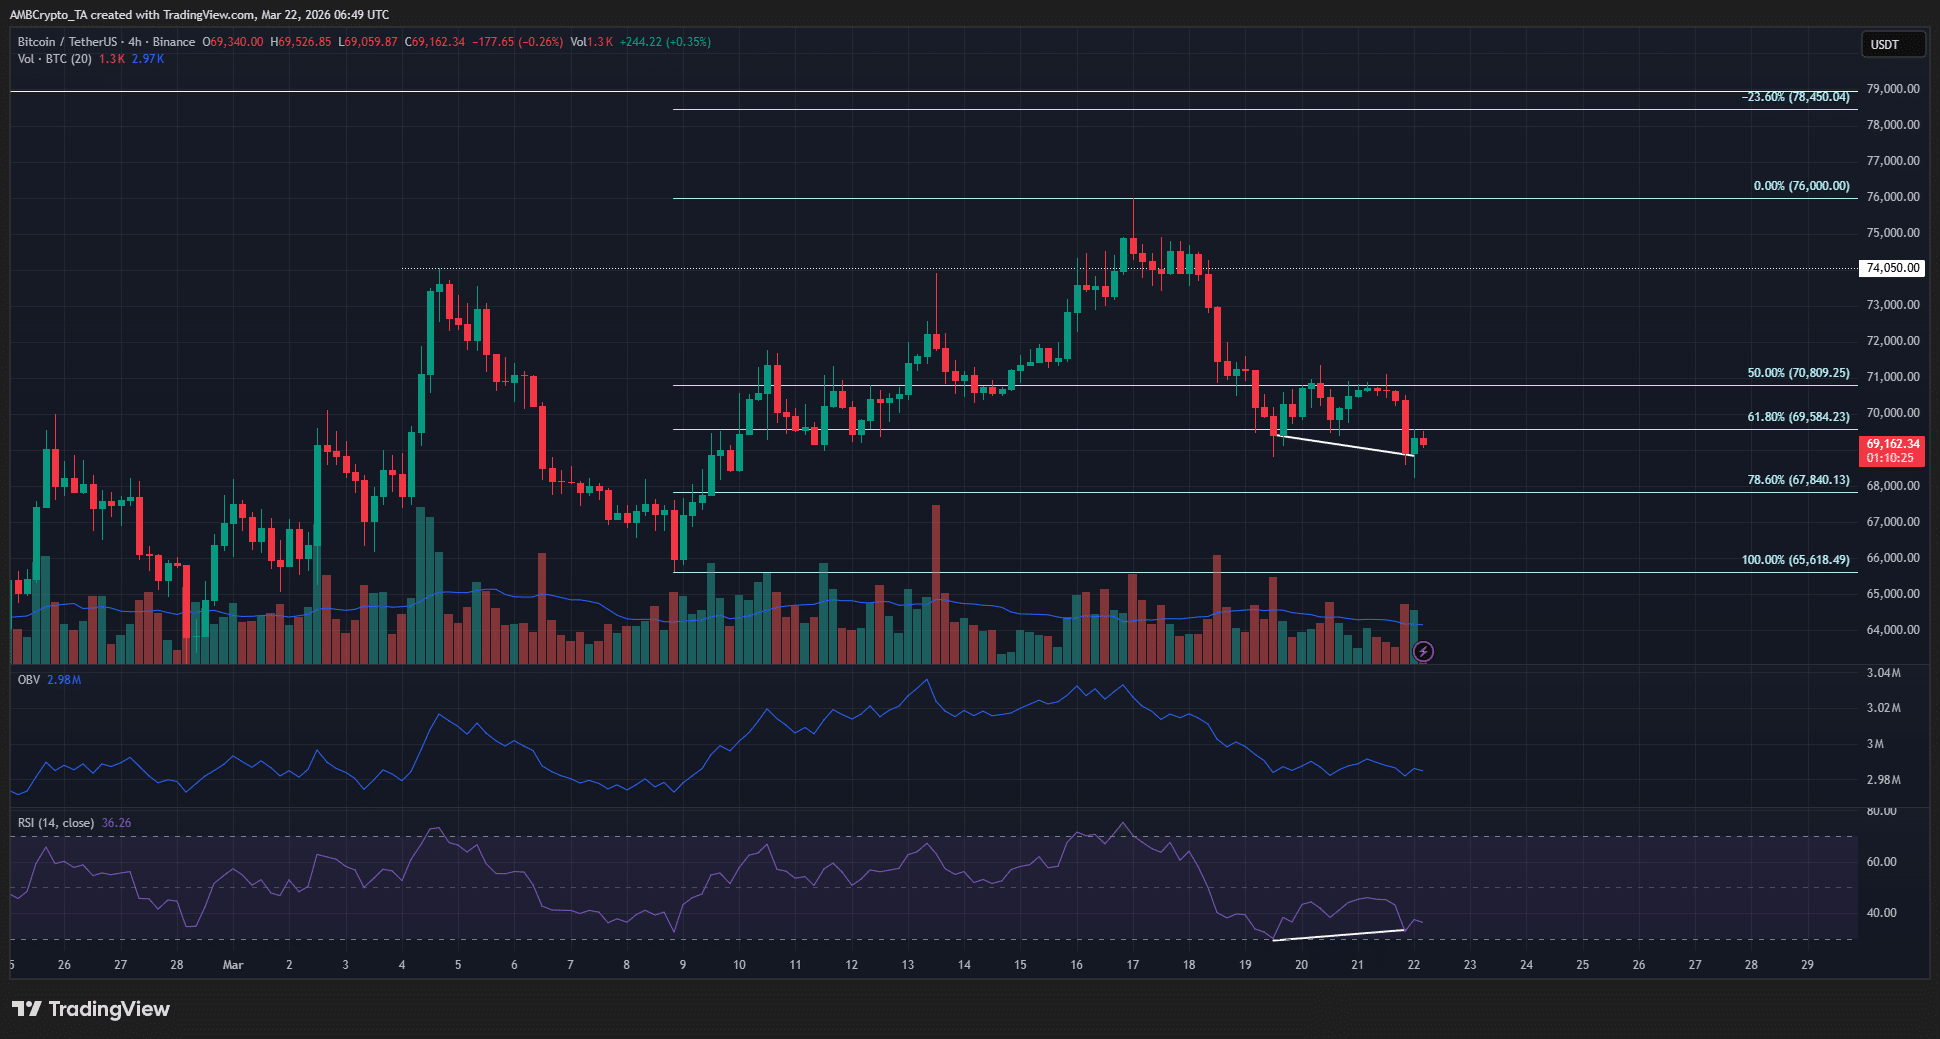
The buying opportunity has arrived. The BTC price has made a bullish divergence with the RSI indicator. It also has a bullish swing structure on the 4-hour chart.

Though the internal structure was bearish, the price was within the Fibonacci golden pocket.

The divergence and golden pocket combined to suggest that Bitcoin is likely to rally to the 23.6% extension level at $78.4k over the next week or two.

However, the downtrend in the OBV over the past week was telling of steady bearish pressure. If it continues and forces a price drop below $65.6k, the bullish idea outlined here would be invalidated.


Final Summary

  • The Bitcoin price action was in a bearish long-term trend and a bullish short-term trend.
  • BTC’s recent retracement below $69k likely offered a buying opportunity. It has already made a bullish divergence with momentum.


Трендові криптовалюти

Пов'язані питання

QWhat was the potential impact of the upcoming Morgan Stanley Spot Bitcoin ETF, according to the article?

AThe article stated that the potential impact of the upcoming Morgan Stanley Spot Bitcoin ETF could be underestimated, and a 2% allocation by the firm could flip BlackRock's IBIT in size.

QWhat two key factors did the article cite as reasons for the recent drop in Bitcoin's hash rate?

AThe drop in hash rate was attributed to miner stress, which signaled tactical shutdowns and weaker operators leaving the network.

QAccording to the trader CrypNuevo, what did the drop to the $69k level represent?

ACrypNuevo observed that the drop to the $69k level could see a price rebound, indicating a potential buying opportunity.

QWhat two technical analysis signals suggested that Bitcoin price rally was likely?

AThe two technical signals were a bullish divergence with the RSI indicator and the price being within the Fibonacci golden pocket.

QWhat key price level would invalidate the bullish idea presented in the article?

AThe bullish idea would be invalidated if the price dropped below $65.6k.

Пов'язані матеріали

Within Strategy's Framework, STRC's Dividend Yield Remains at 12% as Share Price Stays Below Par Value

Michael Saylor, Executive Chairman of Strategy (MSTR), confirmed that the dividend rate for its STRC perpetual preferred shares will remain at 12.00% through August 2026. The rate has increased from 9% at its July 2025 launch to the current high via a "ratchet" mechanism, which permanently raises the rate by 0.5% whenever the share price falls below $95. This mechanism is intended to push the price back toward its $100 par value and support Strategy's "at-the-market" (ATM) program for issuing new shares to fund Bitcoin purchases. However, the mechanism has not worked as intended. STRC shares closed at $89.46 on July 31, remaining about 10-11% below par value despite the record-high dividend. Competition from rival Strive's higher-yielding SATA securities has pressured demand. The persistent discount has forced Strategy to suspend new STRC issuances via its ATM program, limiting this funding channel for Bitcoin acquisitions. STRC's struggles reflect Bitcoin's own volatility, as the preferred shares historically move in tandem. Analysts have warned the ratchet structure carries long-term, one-way risk. A law firm is investigating Strategy's ability to maintain dividend payments if Bitcoin's price stays low. Retail investors own roughly 83% of outstanding STRC shares, a group seen as prone to panic selling during downturns. In response, Strategy has established financial reserves, including a liquidity cushion covering about 26 months of dividend/interest obligations, and a $2 billion share buyback program alongside a Bitcoin monetization framework, though the company emphasized it is not obligated to sell any Bitcoin.

cryptonews.ru40 хв тому

Within Strategy's Framework, STRC's Dividend Yield Remains at 12% as Share Price Stays Below Par Value

cryptonews.ru40 хв тому

Analyst: Bitcoin's Price Will Drop to $60k in August, Then Rebound to $70k

Financial analyst Andrey Poroshin has provided a new forecast for Bitcoin's price dynamics in August. Poroshin, an analyst at the Bitbanker exchange, expects the cryptocurrency market to experience a downturn this month, with prices retesting the $60,000 level due to a lack of supportive macroeconomic catalysts. He noted that the recent US Federal Reserve decision to hold interest rates did not significantly impact the market, while inflation remains above the 2% target. Poroshin stated that Bitcoin is ending July under pressure from moderate volatility and a lack of new macroeconomic stimuli, leading to continued market caution. According to his base scenario, Bitcoin will drop to a range of $60,000 to $62,000 before recovering to $70,000. He pointed out that even $70,000 remains below the cost of mining in the US, which has prompted some miners to shift towards AI data center operations. Poroshin cited the winding down of BitMEX's operations as a potential catalyst for a price rebound, suggesting the exit of weaker players often coincides with market reversals and reduced short-term selling pressure. He believes Bitcoin is currently less susceptible to geopolitical shocks, such as the Iran-US conflict, and does not expect significant market changes in August related to the pending CLARITY Act. Looking ahead, Poroshin forecasts that September will bring more active price fluctuations driven by potential Fed rate decisions and possible discussions or approval of the CLARITY Act.

cryptonews.ru40 хв тому

Analyst: Bitcoin's Price Will Drop to $60k in August, Then Rebound to $70k

cryptonews.ru40 хв тому

Торгівля

Спот

Популярні статті

Як купити 4

Ласкаво просимо до HTX.com! Ми зробили покупку 4 (4) простою та зручною. Дотримуйтесь нашої покрокової інструкції, щоб розпочати свою криптовалютну подорож.Крок 1: Створіть обліковий запис на HTXВикористовуйте свою електронну пошту або номер телефону, щоб зареєструвати обліковий запис на HTX безплатно. Пройдіть безпроблемну реєстрацію й отримайте доступ до всіх функцій.ЗареєструватисьКрок 2: Перейдіть до розділу Купити крипту і виберіть спосіб оплатиКредитна/дебетова картка: використовуйте вашу картку Visa або Mastercard, щоб миттєво купити 4 (4).Баланс: використовуйте кошти з балансу вашого рахунку HTX для безперешкодної торгівлі.Треті особи: ми додали популярні способи оплати, такі як Google Pay та Apple Pay, щоб підвищити зручність.P2P: Торгуйте безпосередньо з іншими користувачами на HTX.Позабіржова торгівля (OTC): ми пропонуємо індивідуальні послуги та конкурентні обмінні курси для трейдерів.Крок 3: Зберігайте свої 4 (4)Після придбання 4 (4) збережіть його у своєму обліковому записі на HTX. Крім того, ви можете відправити його в інше місце за допомогою блокчейн-переказу або використовувати його для торгівлі іншими криптовалютами.Крок 4: Торгівля 4 (4)Легко торгуйте 4 (4) на спотовому ринку HTX. Просто увійдіть до свого облікового запису, виберіть торгову пару, укладайте угоди та спостерігайте за ними в режимі реального часу. Ми пропонуємо зручний досвід як для початківців, так і для досвідчених трейдерів.

519 переглядів усьогоОпубліковано 2025.10.20Оновлено 2026.06.02

Як купити 4

Обговорення

Ласкаво просимо до спільноти HTX. Тут ви можете бути в курсі останніх подій розвитку платформи та отримати доступ до професійної ринкової інформації. Нижче представлені думки користувачів щодо ціни 4 (4).

活动图片