Bitcoin Is Entering A Window For A Santa Rally, Analyst Says

bitcoinistОпубліковано о 2025-12-22Востаннє оновлено о 2025-12-22

Анотація

Bitcoin is showing signs of a potential Santa rally, according to CryptoQuant analyst Axel Adler Jr. The market’s current “Regime Score” sits at +16.3, placing it in the upper neutral zone (+15 to +30), which historically has delivered average returns of +3.8% over 30 days. This suggests a tactical bullish setup without excessive optimism. Additionally, the derivatives market shows a skew toward short liquidations, creating mechanical upward pressure as forced buyers enter the market. However, Adler cautions that entering the formal Bull regime (above +30) has historically coincided with local tops. The current “bullish neutrality” offers a favorable window for upside, though a drop in the Regime Score below zero or a shift toward long liquidations would signal exhaustion. Bitcoin traded at $89,864 at the time of writing.

Bitcoin might be stumbling into a very seasonal setup, not because Santa is real, but because positioning and one of those composite “regime” dashboards are flashing the kind of “bullish, but not sweaty” signal traders love to cling to in late December.

CryptoQuant analyst Axel Adler Jr. put it bluntly on X on Monday: “BTC is entering a window for a Santa rally: the Regime Score is bullish but not overheated. Short liquidations are reinforcing the asymmetry in favor of buyers.”
That’s the headline claim. The longer version is basically: the market is in a zone that has historically had decent forward returns, and the derivatives plumbing is currently doing that annoying-but-useful thing where it mechanically pushes price higher when shorts get forced out.

Will Bitcoin See A ‘Santa Rally’ This Year?

In his Monday Substack post, Adler framed it as a tactical setup rather than some grand, end-of-year prophecy. “The BTC market is in the upper part of the Regime Score neutral zone, which has historically shown positive expected returns,” he wrote. Then he tightened the screw: “The current liquidation structure in the futures market indicates a predominance of short position closures, creating additional mechanical pressure in favor of buyers.”

So what’s this Regime Score thing, exactly? Adler describes it as a composite indicator that “combines taker imbalance, OI pressure, funding, ETF flows, exchange flows, and price trend into a single scale from −100 to +100.” The number matters less than the band it sits in. Right now, he says the score “stands at +16.3, corresponding to the upper part of the neutral zone (+15 to +30).”
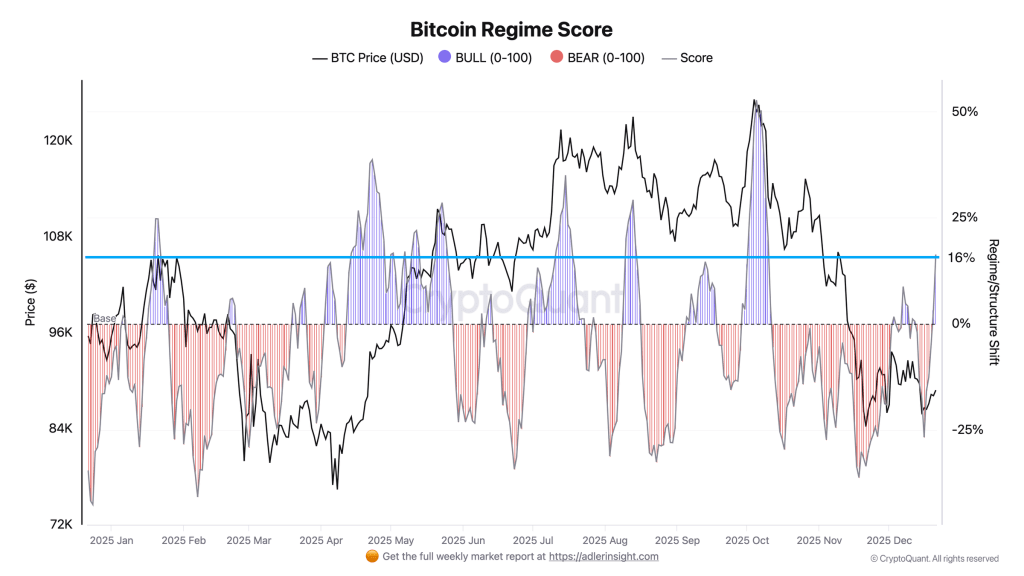
Bitcoin Regime Score | Source: Axel Adler Jr

And that particular subzone is doing the heavy lifting in his argument. “Backtesting for 2025 shows this subzone historically delivered average returns of +3.8% over 30 days,” Adler wrote, contrasting it with the weaker ranges below. He also pointed out that, “unlike the −15 to 0 subzone where expected returns were negative (−1.5% over 7d),” the +15 to +30 band tended to be a more forgiving place to put on risk.

It’s also worth noting how quickly the tape can flip, because his own charting suggests it already did. Adler says the indicator “has emerged from a recent bearish phase (score dropped to −27 a week ago) and is showing recovery.” That’s the kind of detail traders latch onto: not just where you are, but how fast you got there.

But here’s the funny part — the “most bullish” zone, in his backtest, wasn’t actually bullish for forward returns. He flags that “transition into the formal Bull regime (+30 and above) historically coincided with local tops” and that it “delivered negative average returns of −3.3% over 7 days.” In other words, if you wait for the indicator to scream “bull market,” you might be buying the exact moment everyone else is already leaning the same way.

Which is why Adler ends up with a pretty trader-ish conclusion: the current band might be the sweet spot because it’s optimistic without being euphoric.

“This means the current +15–30 zone may be optimal for tactical positions, while aggressive accumulation upon breaking +30 carries elevated risk,” he wrote.

Then there’s the derivatives side — the part that can turn a calm-looking market into a sudden wick up (or down) just because leverage is sitting in the wrong place. Adler’s liquidation dominance oscillator is currently negative, which he reads as a short liquidation skew. “The oscillator’s current value has dropped into negative territory (−11%), while the 30-day moving average remains positive (+10%). This divergence points to a recent surge in forced short position closures,” he wrote.

He doubles down with a second stat: “Long Liquidation Dominance stands at 44%, below the 50% baseline, confirming the predominance of short liquidations.” Put simply: more shorts are getting forced out than longs are getting wiped, and those forced closes are buys.
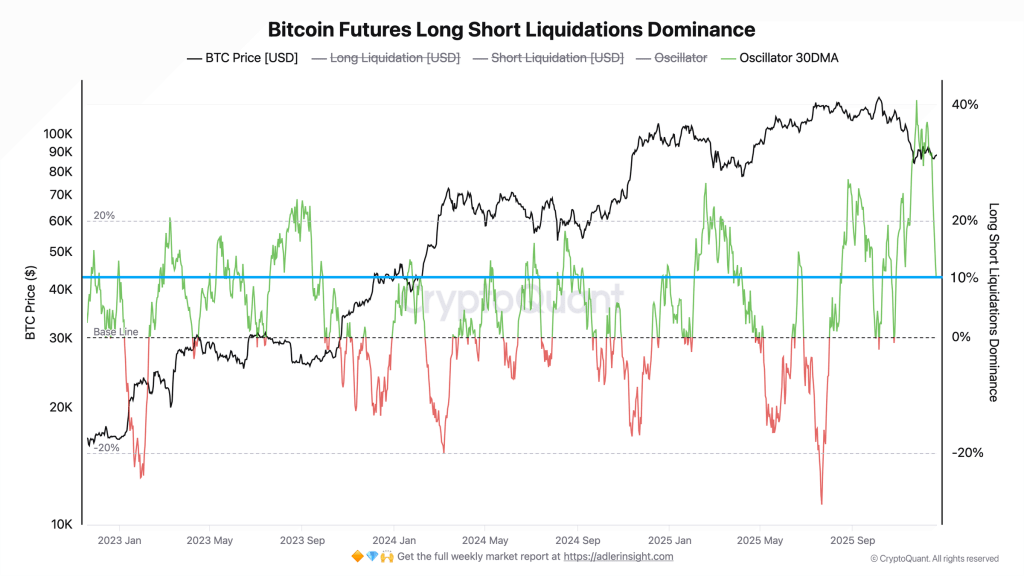
Bitcoin Futures Long Short- Liquidations Dominance | Source: Axel Adler Jr

And his takeaway is basically: this is tactical fuel. “The predominance of short liquidations creates tactical fuel for upside,” Adler wrote, adding that the setup “reinforces the positive signal from Regime Score: the market has not only entered a zone with historically positive expected returns but is also receiving additional support from derivatives structure.”

Still, this is Bitcoin, and these setups don’t last forever. Adler even lays out what would invalidate it, in pretty plain language. “A return of Regime Score below zero accompanied by a reversal of the liquidation oscillator into positive territory (rising long liquidations) would signal exhaustion of the current impulse,” he wrote. Translation: if longs start being the ones getting punished, that “asymmetry” flips.

For now, he’s calling it a “bullish neutrality” moment. Not full-blown melt-up territory, not the kind of reading that screams “local top” either. Just a window where, if the market wants to drift higher into year-end, the positioning doesn’t look like it’s going to fight it.

At press time, Bitcoin traded at $89,864.
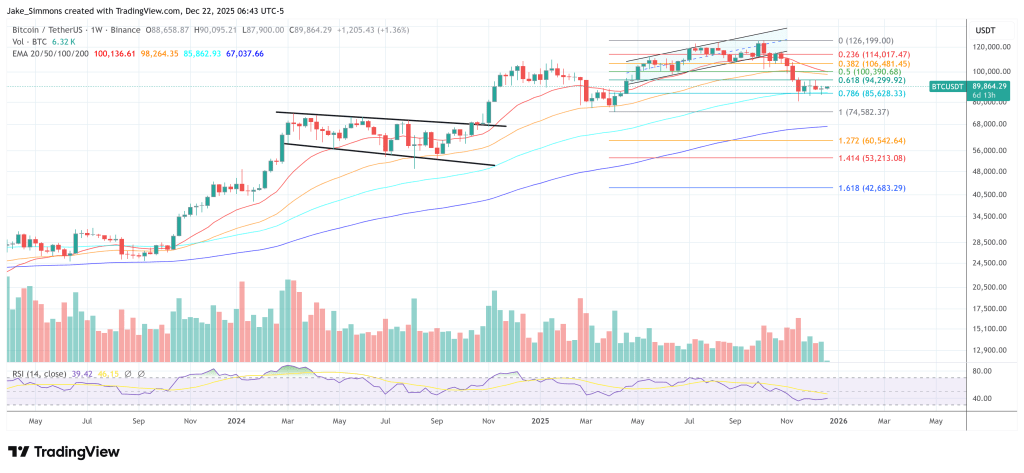
Bitcoin remains stuck between the 0.618 and 0.786 Fib, 1-week chart | Source: BTCUSDT on TradingView.com

Трендові криптовалюти

Пов'язані питання

QWhat is the current Bitcoin Regime Score and what does it indicate according to Axel Adler Jr.?

AThe current Bitcoin Regime Score is +16.3, which is in the upper part of the neutral zone (+15 to +30). This zone has historically shown positive expected returns of +3.8% over 30 days, indicating a 'bullish, but not overheated' market condition that is optimal for tactical positions.

QHow does the liquidation structure in the futures market currently support a potential price increase?

AThe liquidation dominance oscillator is in negative territory (-11%), indicating a predominance of short position closures. With Long Liquidation Dominance at 44% (below the 50% baseline), this confirms that more shorts are being forced out than longs. These forced short liquidations create mechanical buying pressure, reinforcing the upside for buyers.

QAccording to the analyst, what would invalidate the current bullish tactical setup?

AThe setup would be invalidated by a return of the Regime Score below zero, accompanied by a reversal of the liquidation oscillator into positive territory. This would signal a shift where long liquidations are rising, indicating exhaustion of the current bullish impulse and a flip in market asymmetry.

QWhy does the analyst consider the current 'Bull' regime (score above +30) to be less ideal for entering positions?

AHistorical backtesting shows that a transition into the formal Bull regime (score of +30 and above) has often coincided with local tops and delivered negative average returns of -3.3% over 7 days. This suggests that entering at that point might mean buying when the market is already euphoric and due for a pullback.

QWhat is the overall market condition described by the analyst, and at what price was Bitcoin trading at press time?

AThe overall market condition is described as 'bullish neutrality' or a 'bullish, but not sweaty' signal. It is a tactical setup where the market is optimistic without being euphoric, providing a window for a year-end rally. At press time, Bitcoin was trading at $89,864.

Пов'язані матеріали

Will the Fed Definitely Raise Interest Rates in September? How Will Crypto and U.S. Stocks Withstand the Pressure?

The market's expectation for a September Fed rate hike surged dramatically in early August, jumping from under 50% to over 80% within a week. This shift followed a contentious July FOMC meeting, where a 9-3 vote to hold rates revealed growing dissent from hawkish members advocating for an immediate hike to combat persistent inflation. The primary catalyst for this repricing is rising oil prices, driven by renewed geopolitical tensions around the Strait of Hormuz, which threaten global supply. Energy costs directly influence inflation metrics, making the upcoming July CPI report (due August 12th) a critical data point. If it shows inflation reaccelerating, the probability of a September hike will solidify. For Bitcoin and crypto assets, this is typically bearish news. Bitcoin continues to behave as a high-beta, liquidity-sensitive risk asset. A rate hike raises the opportunity cost of holding non-yielding assets and could drive capital toward money markets, pressuring crypto prices in the short term. However, historical patterns suggest that if a hike is perceived as the end of a tightening cycle rather than the start, any negative price impact may be brief. U.S. stocks, particularly crypto-linked equities like Coinbase and growth-oriented tech stocks, are also vulnerable. Higher rates increase discount rates in valuation models, putting pressure on high-multiple companies. This coincides with a pivotal tech earnings season where investor focus has shifted from massive AI capital expenditure to tangible revenue and cash flow generation. Companies with negative cash flow and weak growth narratives could face heightened volatility if borrowing costs rise in September. In summary, a September Fed hike has evolved into a mainstream market scenario. Key factors to watch are oil prices, the July CPI report, and Fed communications, which will determine the final decision and its impact on volatile crypto and equity markets.

marsbit2 хв тому

Will the Fed Definitely Raise Interest Rates in September? How Will Crypto and U.S. Stocks Withstand the Pressure?

marsbit2 хв тому

A 'Overlooked' Market Event: Joint US-Japan-South Korea Intervention, Rare US Treasury Involvement, and Bessent's Quiet 'Market Rescue'?

Summary: The United States, Japan, and South Korea executed their largest coordinated foreign exchange intervention in nearly 30 years. The action targeted depreciation pressure on the Japanese yen and South Korean won. This move is seen as a significant effort by the US to stabilize the financial markets of its key allies and prevent the spillover of risks. Key details: * Japan reportedly intervened on July 30 using approximately 8.45 trillion yen (about $52.8 billion). South Korean authorities also intervened that day, selling dollars to support the won. * Notably, the US Treasury Department intervened directly in yen markets for the first time in roughly 30 years. The New York Fed, reportedly acting on behalf of the Treasury, sold euros to buy yen via Goldman Sachs and Morgan Stanley on July 31. Analysts view the use of the euro-yen pair as a way to alleviate yen pressure without adding selling pressure to the US dollar. * Prior to the action, the New York Fed conducted "rate checks" on both USD/JPY and EUR/JPY, a newer signaling tool that falls between verbal and physical intervention. The intervention is interpreted as going beyond traditional currency stabilization. Analysts, such as Michael Hartnett of Bank of America, suggest it resembles a "Price Keeping Operation" for the AI era. The core US objectives are perceived to be: 1. Preventing rapid yen depreciation from triggering a sharp rise in Japanese government bond yields. 2. Containing financial stress from spreading across Asian markets like South Korea and Japan. 3. Reducing the risk of disorderly capital flows impacting the US bond market. This coordinated action underscores the importance of Japan and South Korea as critical partners in the US semiconductor and AI supply chain. Stabilizing their financial markets is seen as vital to mitigating risks to the broader tech industry and the US market itself. The intervention coincides with market pressures, including the KOSDAQ index hitting a low since October 2022. While seen as a move to control volatility, some analysts caution it may not fundamentally reverse existing market trends.

marsbit6 хв тому

A 'Overlooked' Market Event: Joint US-Japan-South Korea Intervention, Rare US Treasury Involvement, and Bessent's Quiet 'Market Rescue'?

marsbit6 хв тому

Will the Federal Reserve Definitely Raise Interest Rates in September? How Will Cryptocurrencies and US Stocks Bear the Pressure?

In early August 2024, market expectations for a September Federal Reserve rate hike surged dramatically, from below 50% to over 80%, driven by renewed inflation concerns. This shift followed a contentious July FOMC meeting where a 9-3 vote to hold rates revealed a growing hawkish faction advocating for an immediate hike, citing prolonged above-target inflation. The key catalyst is escalating conflict near the Strait of Hormuz, which has pushed oil prices up approximately 20% in July, threatening to reignite inflation. The next critical data point is the July CPI report on August 12th; a hot reading could solidify hike expectations. For crypto assets, particularly Bitcoin, this represents near-term pressure. Bitcoin continues to exhibit high-beta, risk-on characteristics, making it sensitive to tightening liquidity and higher opportunity costs. However, historical precedent suggests that if a hike is perceived as the cycle's end rather than its start, the negative impact may be brief, with markets quickly pivoting to anticipate future rate cuts. U.S. stocks, especially crypto-linked equities like Coinbase and high-valuation tech stocks, face amplified volatility. Higher rates increase discount rates in valuation models, pressuring growth stocks. This coincides with a pivotal tech earnings season where investor focus has shifted from massive AI capital expenditures to demonstrable revenue and cash flow generation. Companies with negative cash flows and weak growth narratives could see severe pressure if a September hike materializes, as financing costs would rise. Key indicators to watch include oil prices, upcoming inflation data, and Fed commentary at events like the Jackson Hole symposium.

Odaily星球日报6 хв тому

Will the Federal Reserve Definitely Raise Interest Rates in September? How Will Cryptocurrencies and US Stocks Bear the Pressure?

Odaily星球日报6 хв тому

Торгівля

Спот

Популярні статті

Як купити O

Ласкаво просимо до HTX.com! Ми зробили покупку O1 exchange (O) простою та зручною. Дотримуйтесь нашої покрокової інструкції, щоб розпочати свою криптовалютну подорож.Крок 1: Створіть обліковий запис на HTXВикористовуйте свою електронну пошту або номер телефону, щоб зареєструвати обліковий запис на HTX безплатно. Пройдіть безпроблемну реєстрацію й отримайте доступ до всіх функцій.ЗареєструватисьКрок 2: Перейдіть до розділу Купити крипту і виберіть спосіб оплатиКредитна/дебетова картка: використовуйте вашу картку Visa або Mastercard, щоб миттєво купити O1 exchange (O).Баланс: використовуйте кошти з балансу вашого рахунку HTX для безперешкодної торгівлі.Треті особи: ми додали популярні способи оплати, такі як Google Pay та Apple Pay, щоб підвищити зручність.P2P: Торгуйте безпосередньо з іншими користувачами на HTX.Позабіржова торгівля (OTC): ми пропонуємо індивідуальні послуги та конкурентні обмінні курси для трейдерів.Крок 3: Зберігайте свої O1 exchange (O)Після придбання O1 exchange (O) збережіть його у своєму обліковому записі на HTX. Крім того, ви можете відправити його в інше місце за допомогою блокчейн-переказу або використовувати його для торгівлі іншими криптовалютами.Крок 4: Торгівля O1 exchange (O)Легко торгуйте O1 exchange (O) на спотовому ринку HTX. Просто увійдіть до свого облікового запису, виберіть торгову пару, укладайте угоди та спостерігайте за ними в режимі реального часу. Ми пропонуємо зручний досвід як для початківців, так і для досвідчених трейдерів.

487 переглядів усьогоОпубліковано 2026.06.19Оновлено 2026.06.19

Як купити O

Як купити PROS

Ласкаво просимо до HTX.com! Ми зробили покупку Pharos (PROS) простою та зручною. Дотримуйтесь нашої покрокової інструкції, щоб розпочати свою криптовалютну подорож.Крок 1: Створіть обліковий запис на HTXВикористовуйте свою електронну пошту або номер телефону, щоб зареєструвати обліковий запис на HTX безплатно. Пройдіть безпроблемну реєстрацію й отримайте доступ до всіх функцій.ЗареєструватисьКрок 2: Перейдіть до розділу Купити крипту і виберіть спосіб оплатиКредитна/дебетова картка: використовуйте вашу картку Visa або Mastercard, щоб миттєво купити Pharos (PROS).Баланс: використовуйте кошти з балансу вашого рахунку HTX для безперешкодної торгівлі.Треті особи: ми додали популярні способи оплати, такі як Google Pay та Apple Pay, щоб підвищити зручність.P2P: Торгуйте безпосередньо з іншими користувачами на HTX.Позабіржова торгівля (OTC): ми пропонуємо індивідуальні послуги та конкурентні обмінні курси для трейдерів.Крок 3: Зберігайте свої Pharos (PROS)Після придбання Pharos (PROS) збережіть його у своєму обліковому записі на HTX. Крім того, ви можете відправити його в інше місце за допомогою блокчейн-переказу або використовувати його для торгівлі іншими криптовалютами.Крок 4: Торгівля Pharos (PROS)Легко торгуйте Pharos (PROS) на спотовому ринку HTX. Просто увійдіть до свого облікового запису, виберіть торгову пару, укладайте угоди та спостерігайте за ними в режимі реального часу. Ми пропонуємо зручний досвід як для початківців, так і для досвідчених трейдерів.

556 переглядів усьогоОпубліковано 2026.06.22Оновлено 2026.06.22

Як купити PROS

Що таке VERONA

I. Вступ до проекту VERONA - це блокчейн, створений для всіх, скрізь, через абстракцію ланцюга. Використовуючи свій загальний шар абстракції, VERONA вирізняється інтеграцією складних функцій блокчейну, таких як рахунки, підписи та взаємодія, безпосередньо на рівні протоколу. Цей підхід дозволяє взаємодіяти з блокчейн-додатками без необхідності розуміти основні технології.1) Основна інформація Назва: VERONA (VERONA)III. Пов'язані посилання Офіційне посилання на сайт: https://xion.burnt.com/ Біла книга: https://xion.burnt.com/whitepaper.pdf Експлорери: https://explorer.burnt.com/ Соціальні мережі: https://x.com/burnt_xion Примітка: Вступ до проекту взято з матеріалів, опублікованих або наданих офіційною командою проекту, які є лише для довідки і не є інвестиційною порадою. HTX не несе відповідальності за будь-які прямі або непрямі збитки, що виникають внаслідок цього.

403 переглядів усьогоОпубліковано 2026.06.22Оновлено 2026.06.22

Що таке VERONA

Обговорення

Ласкаво просимо до спільноти HTX. Тут ви можете бути в курсі останніх подій розвитку платформи та отримати доступ до професійної ринкової інформації. Нижче представлені думки користувачів щодо ціни A (A).

活动图片