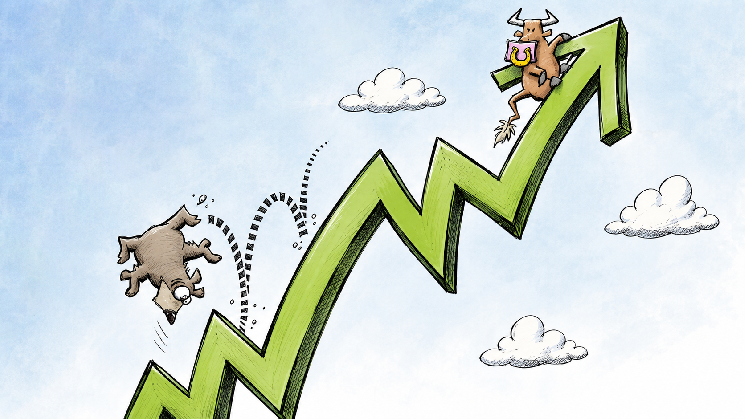
Bitcoin (BTC) Price Under Pressure: Is a Bearish Flag Flashing a Warning of a Slide to $70K?

TheNewsCryptoОпубліковано о 2025-12-09Востаннє оновлено о 2025-12-09

Within the bear hold, the largest asset in the crypto market, Bitcoin (BTC), is stuck in the downside waves, lighting up the red candlesticks. Multiple rejections have been faced back-to-back, and are currently trading below the $95K. As of today, with the fear sentiment, BTC has posted a modest loss of over 1.12%.

The price movement in the early hours caused the asset to hit a high of $92,220.86. Later, the bearish fluctuations triggered BTC to fall to its bottom range of $89,586.98. As per the CMC data, at the time of writing, Bitcoin traded at around the $90,511.42 zone.

Besides, the market cap of the asset is resting at $1.8 trillion, and its daily trading volume has dropped and reached the $55.88 billion. As reported by the Coinglass data, the market has witnessed a liquidation of $54.95 million worth of Bitcoin in the last 24 hours.

The Ali chart has exhibited that the current structure on Bitcoin’s chart is forming a bearish flag. The price consolidates upward within a tight channel after a sharp drop, but fails to break higher. If BTC breaks below the lower trendline, the pattern projects a downside target. In this case, around $70K, based on the height of the preceding drop.

Is Bitcoin Preparing for an Extended Bear Grip?

Both the Moving Average Convergence Divergence (MACD) line and the signal line are positioned below the zero line, which indicates Bitcoin’s broader bearish phase. The downside pressure will continue to dominate unless the lines rise back above the zero line.

In addition, the Chaikin Money Flow (CMF) indicator value found at 0.15 suggests moderate buying pressure in the BTC market. The money is flowing into the asset, not strongly, but it hints at a positive shift in demand and may support further upside.

The 4-hour trading session of Bitcoin shows bearish sentiment, with the price might slip to the key support at $90,472. Further correction on the downside could easily push for the death cross emergence, and the bears would send the price below the $90.3K mark.

Conversely, if the bulls appeared, the price could move up toward the $90,612 resistance range. A golden cross might take place with the strengthened upside pressure. Gradually, the bulls likely drive the BTC price to its recent high, above the $90.7K zone.

Bitcoin’s daily Relative Strength Index (RSI) is at 50.54, in the neutral zone — neither overbought nor oversold. With the balanced momentum, the price could swing in either direction. Moreover, BTC’s Bull Bear Power (BBP) of -31.33 signals that bears currently have control. The selling pressure is strong, pushing the price below, and the trend will lean more bearish unless momentum shifts.

Top Updated Crypto News

Zcash (ZEC) Rockets Up 14%: Is Crucial Resistance Lurking Ahead?

TagsBitcoinBTCBTC priceCryptocurrency

Трендові криптовалюти

Пов'язані матеріали

RWA Tokenization Enters the Next Phase: What is the Truly Time-Consuming Advantage to Build?

The article argues that as tokenization frameworks for Real-World Assets (RWA) mature, the ability to issue assets is becoming less of a competitive advantage. The focus is shifting to what happens *after* issuance: which RWA operations can build enduring trust, maintain stable operations, and remain integrated into the financial ecosystem over the long term. The piece introduces the concept of a **Reserve Layer**—infrastructure that connects tokenized assets to the necessary verification, liquidity, and operational systems for on-chain finance. For an asset to serve as a reliable reserve (e.g., short-term U.S. Treasuries, gold), it needs predictable value, standardized features, deep markets, and observable pricing. However, the true, hard-to-replicate advantage lies not just in the underlying asset but in the **operational track record** built over time. This includes consistent reserve management, independent audits, successful redemptions, maintained liquidity, and protocol integrations. Each successful operation adds evidence, creating a reinforcing cycle: more evidence builds stronger institutional confidence, leading to wider distribution, deeper liquidity, and more use cases as collateral. The article presents a framework combining two dimensions: an asset's suitability as a reserve and the issuer's operational capability. The most sustainable model combines **high-quality reserve assets with strong, long-term operational discipline**. A critical blind spot is an asset with high reserve suitability (like gold) issued by an entity with a limited operational track record; the quality of the infrastructure is separate from the quality of the asset itself. In conclusion, the next phase of RWA will be defined by participants who can pair appropriate reserve assets with the operational rigor to support them through market cycles, thereby transforming tokenized RWAs into durable financial infrastructure.

marsbit34 хв тому

RWA Tokenization Enters the Next Phase: What is the Truly Time-Consuming Advantage to Build?

marsbit34 хв тому

Торгівля

Спот

Популярні статті

Що таке KR200

KOSPI 200 є бенчмарковим індексом блакитних фішок Південної Кореї, який відстежує 200 найбільших акцій з високою ліквідністю, що котируються на Корейській біржі (KRX). Він охоплює лідерів сектору, таких як Samsung та SK Hynix, і слугує основою для корейських похідних акцій та глобального інституційного бенчмаркінгу.

44 переглядів усьогоОпубліковано 2026.08.19Оновлено 2026.08.19

Що таке KR200

Як купити KR200

Ласкаво просимо до HTX.com! Ми зробили покупку KOSPI 200 (KR200) простою та зручною. Дотримуйтесь нашої покрокової інструкції, щоб розпочати свою криптовалютну подорож.Крок 1: Створіть обліковий запис на HTXВикористовуйте свою електронну пошту або номер телефону, щоб зареєструвати обліковий запис на HTX безплатно. Пройдіть безпроблемну реєстрацію й отримайте доступ до всіх функцій.ЗареєструватисьКрок 2: Перейдіть до розділу Купити крипту і виберіть спосіб оплатиКредитна/дебетова картка: використовуйте вашу картку Visa або Mastercard, щоб миттєво купити KOSPI 200 (KR200).Баланс: використовуйте кошти з балансу вашого рахунку HTX для безперешкодної торгівлі.Треті особи: ми додали популярні способи оплати, такі як Google Pay та Apple Pay, щоб підвищити зручність.P2P: Торгуйте безпосередньо з іншими користувачами на HTX.Позабіржова торгівля (OTC): ми пропонуємо індивідуальні послуги та конкурентні обмінні курси для трейдерів.Крок 3: Зберігайте свої KOSPI 200 (KR200)Після придбання KOSPI 200 (KR200) збережіть його у своєму обліковому записі на HTX. Крім того, ви можете відправити його в інше місце за допомогою блокчейн-переказу або використовувати його для торгівлі іншими криптовалютами.Крок 4: Торгівля KOSPI 200 (KR200)Легко торгуйте KOSPI 200 (KR200) на спотовому ринку HTX. Просто увійдіть до свого облікового запису, виберіть торгову пару, укладайте угоди та спостерігайте за ними в режимі реального часу. Ми пропонуємо зручний досвід як для початківців, так і для досвідчених трейдерів.

38 переглядів усьогоОпубліковано 2026.08.19Оновлено 2026.08.19

Як купити KR200

Що таке SKDD

Розроблений для надання -2x інверсійних важелів доходів від щоденних коливань ціни акцій SK Hynix, це одноденний короткий важелевий ETF під брендом GraniteShares. Він підходить для інвесторів з короткостроковим песимістичним прогнозом щодо SK Hynix для тактичного розподілу.

82 переглядів усьогоОпубліковано 2026.08.19Оновлено 2026.08.19

Що таке SKDD

Обговорення

Ласкаво просимо до спільноти HTX. Тут ви можете бути в курсі останніх подій розвитку платформи та отримати доступ до професійної ринкової інформації. Нижче представлені думки користувачів щодо ціни A (A).

活动图片