Analyzing 10 Major BTC Top Indicators: Why Is the Current Bull Market Different from Previous Ones?

marsbitОпубліковано о 2025-12-22Востаннє оновлено о 2025-12-22

Анотація

This analysis examines 10 classic Bitcoin top indicators to assess why the current bull market (as of Q4 2025) differs from previous cycles. Key metrics like the Pi Cycle Top Indicator, Puell Multiple, Bitcoin Rainbow Chart, 2-Year MA Multiplier, 4-Year Moving Average, MVRV Z-Score, Altcoin Season Index, Long-Term Holder (LTH) Supply, Short-Term Holder (STH) Supply, and Net Unrealized Profit/Loss (NUPL) all show subdued or neutral readings compared to historical extremes observed at past market tops (e.g., 2017 and 2021). Unlike previous cycles, these indicators suggest a lack of typical overheating signals, such as extreme miner profitability, excessive valuation deviations, or rampant altcoin speculation. The price peak on October 6, 2025, did not align with classic top patterns, indicating structural shift in Bitcoin’s market behavior. This moderation may stem from increased institutional participation via Bitcoin ETFs, which has stabilized supply dynamics, as well as broader macroeconomic factors like global liquidity changes and geopolitical events. The declining peak values of indicators like MVRV (from 10 in 2017 to ~3 in 2025) suggest Bitcoin is maturing from a cyclical asset to a mainstream reserve, reducing volatility and extending cycles. Investors may need to adapt traditional indicators with adjusted thresholds or combined metrics for future decision-making.

In previous Bitcoin bull market cycles, the price peak has often been accompanied by signs of overheating. However, this bull market appears to have undergone some significant changes—many historically reliable indicators have been slow to signal a top, and the Bitcoin price has been in a sustained downtrend since hitting a new high on October 6, further driving bearish signals across multiple metrics.

Below, we will examine 10 classic indicators, evaluate their characteristics and limitations, and outline the underlying shifts within Bitcoin and the broader crypto market.

1. Pi Cycle Top Indicator: Has the Cycle Peak Been Reached?

The Pi Cycle indicator is a classic tool for identifying Bitcoin price tops using the 111-day moving average (111DMA) and twice the 350-day moving average (350DMA x 2).

Typically, when the short-term line crosses above the long-term line, it often signals a market top, as it indicates that prices are rising too rapidly, detached from fundamental support.

Historically, the Pi Cycle Top Indicator has shown crossover behavior before each bull market peak:

2017 peak: 111DMA crossed above 350DMA x 2, marking the subsequent bubble burst;

2021 double top: A similar crossover occurred before the first top, followed by a rapid market correction;

Currently (Q4 2025), as shown in the chart below, the two lines have not yet crossed.
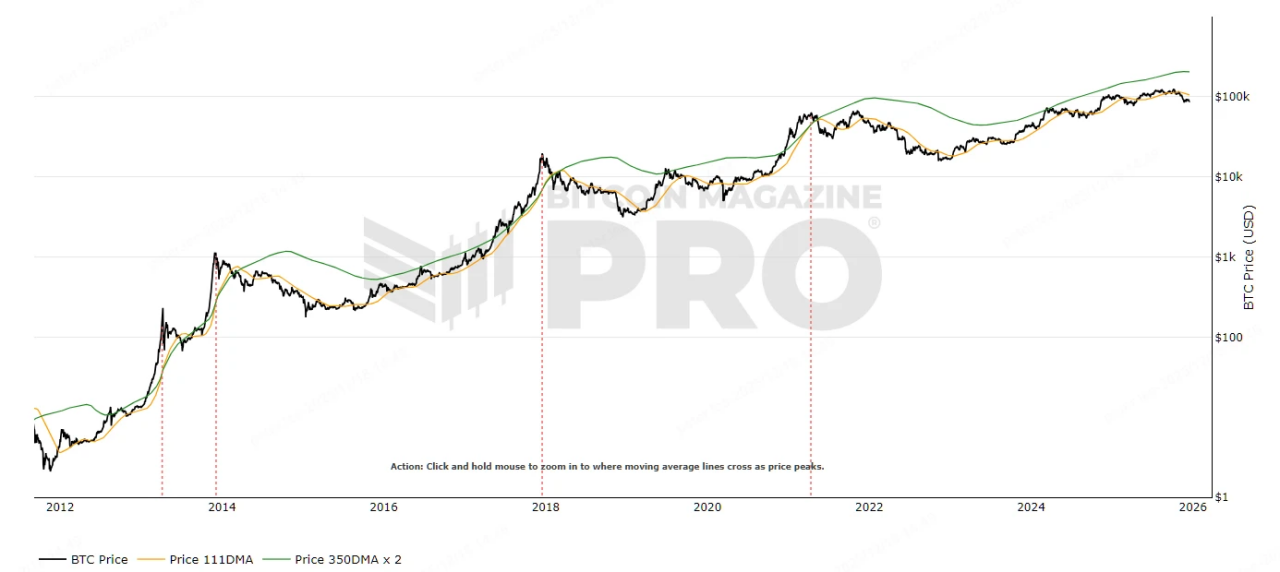
Source: https://www.bitcoinmagazinepro.com/charts/pi-cycle-top-indicator

2. Puell Multiple: Are Miner Profits Excessive?

The Puell Multiple measures the ratio of miners' daily revenue to its 365-day moving average, used to assess miner profitability and market cycles.

Its principle is based on miner behavior: when the ratio is too high, miners are highly profitable and may increase selling pressure, forming a top; when too low, it indicates miner capitulation, signaling a bottom. In other words, a high Puell Multiple reflects that "miners are making too much money," accumulating supply pressure.

Historically, the Puell Multiple has shown extreme spikes before each bull market peak:

2017 peak: Exceeded 7, a historical high;

2021 double top: Exceeded 3, followed by a crash;

Currently (Q4 2025), the Puell Multiple is in the 1~2 range, indicating moderate miner pressure.
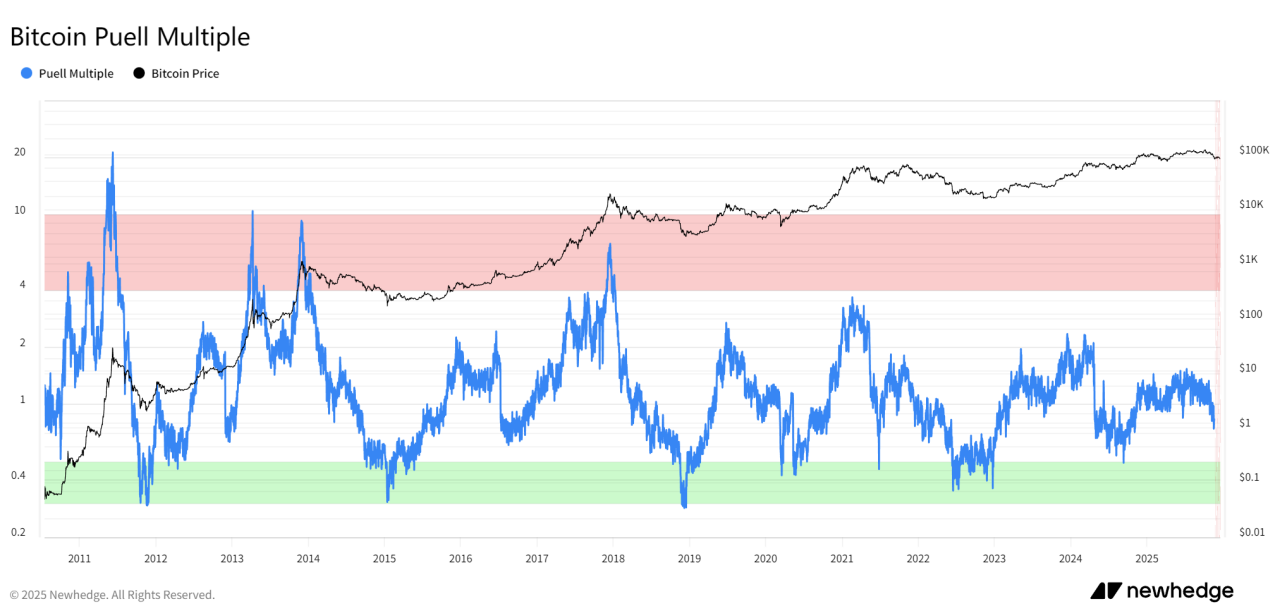
Source: https://newhedge.io/bitcoin/puell-multiple

3. Bitcoin Rainbow Chart: Has the Price Entered the "Sell" Zone?

The Bitcoin Rainbow Chart uses logarithmic growth curves overlaid with rainbow-colored bands to assess Bitcoin's long-term valuation levels.

Its principle maps prices to color bands: blue zones indicate undervaluation (buy), red zones indicate overvaluation (sell). The bands are based on historical growth curves, helping to identify extreme market sentiment.

Historically, the Bitcoin Rainbow Chart has entered the red zone before each bull market peak:

2017 peak: Deep red zone, bubble peak;

2021 double top: Orange-red zone, followed by a correction;

Currently (Q4 2025), the price is in the yellow to orange range, not yet reaching the red bubble zone. We have also seen many analysts adjust this indicator, but regardless of adjustments, the price has indeed not reached the red bubble zone based on past historical experience.
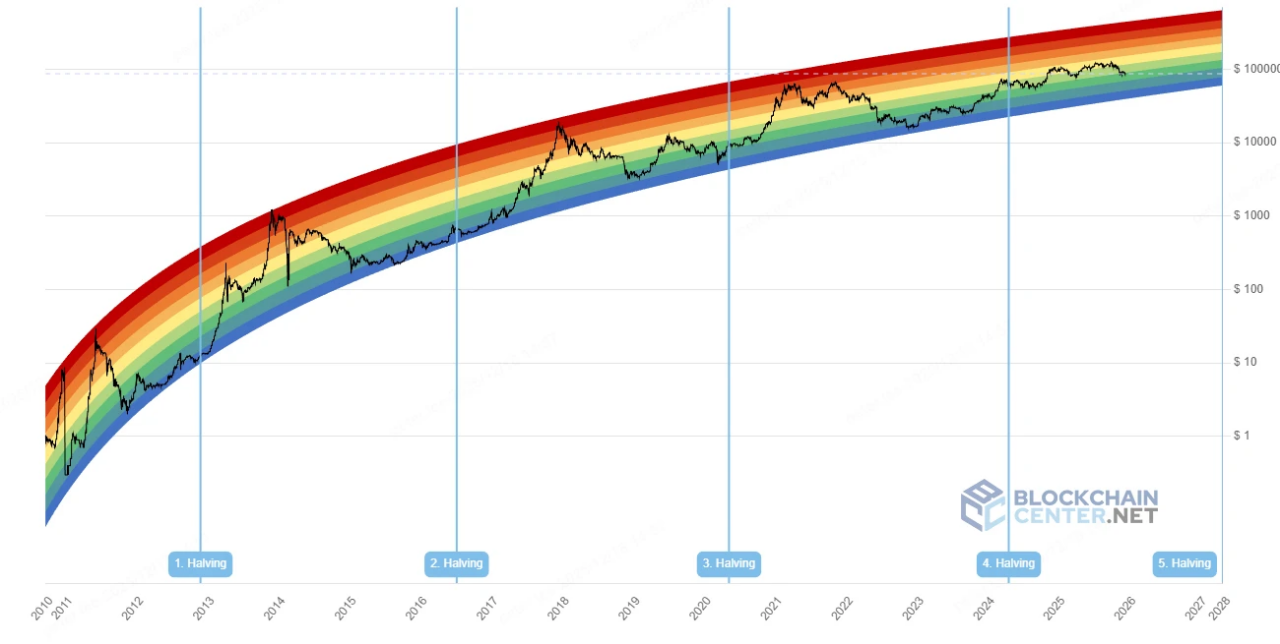
Source: https://www.blockchaincenter.net/en/bitcoin-rainbow-chart/

4. 2-Year MA Multiplier: Has the Multiple Peaked?

The 2-Year MA Multiplier (also known as the Golden Ratio Multiplier) uses the 2-year moving average multiplied by Fibonacci ratios to identify price zones of resistance.

Its principle combines the golden ratio (1.6) and Fibonacci sequences to assess the multiple of price relative to the long-term average: high multiples indicate overheating, signaling a correction. In other words, high multiples mean the price has "deviated too far from the long-term trend," accumulating risk.

Historically, the 2-Year MA Multiplier has shown extreme multiples before each bull market peak:

2017 peak: The indicator differed from the price by up to 10 times, with the top occurring one month after the price crossed above 2 Yr MA *5;

2021 double top: Exceeded 5 times, with the price just touching 2 Yr MA *5 before the first top;

Currently (Q4 2025), the multiple is in the 2~3 range, not yet entering the high multiple zone.
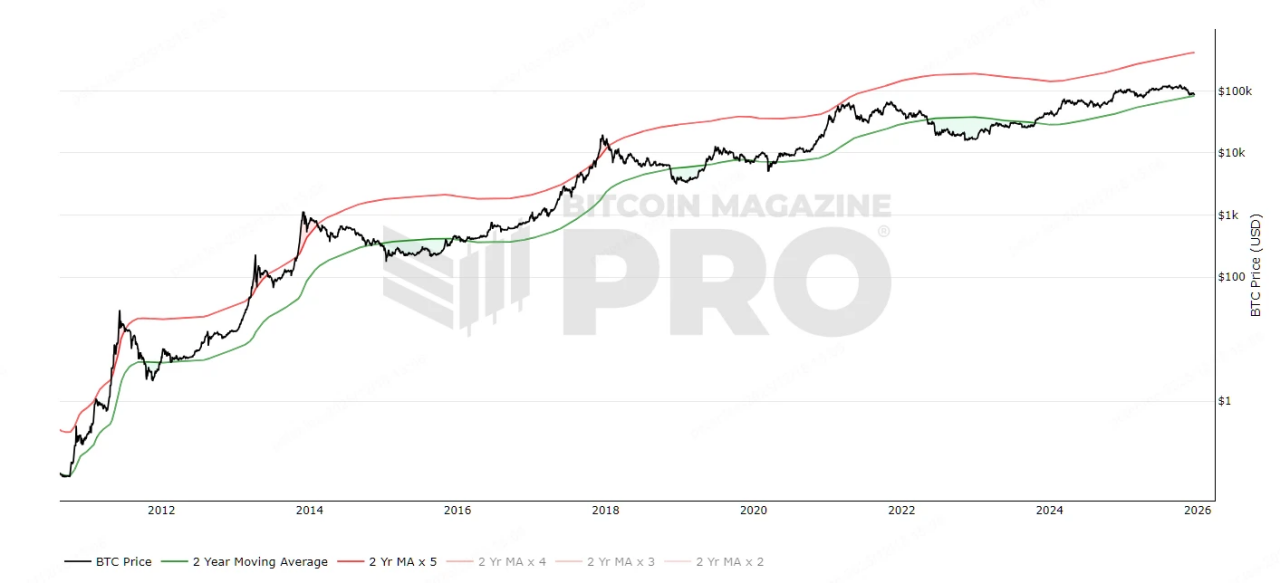
Source: https://www.bitcoinmagazinepro.com/charts/bitcoin-investor-tool/

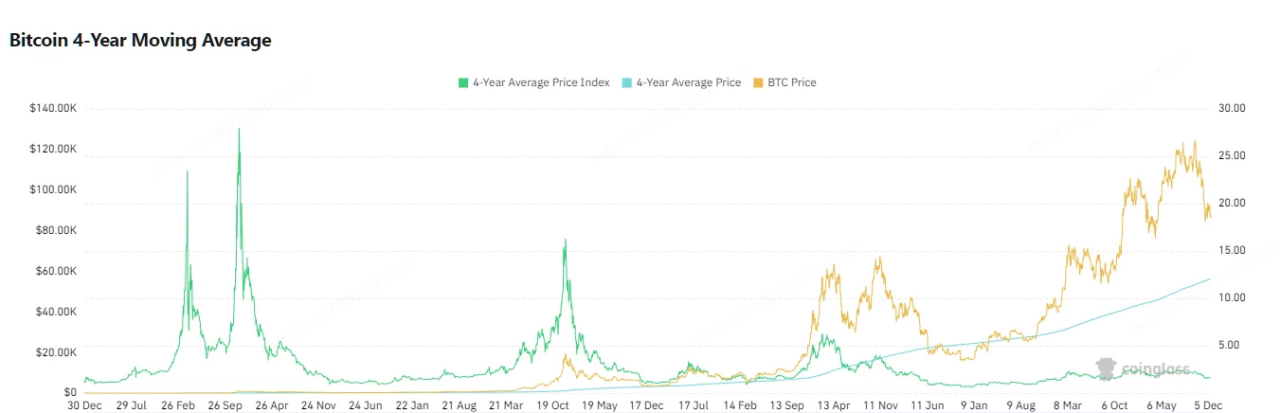
5. Bitcoin 4-Year Moving Average: Is the Price Far Above the Long-Term Average?

The Bitcoin 4-Year Moving Average calculates the 4-year price average to assess Bitcoin's macro trend.

Its principle smooths out cyclical fluctuations: prices far above the average indicate overheating; prices near the average indicate equilibrium. In other words, excessive deviation implies a "cyclical bubble," accumulating risk.

Historically, the Bitcoin 4-Year Moving Average has shown extreme price deviations before each bull market peak:

2017 peak: The indicator reached 16;

2021 double top: Reached 6 at the first top, followed by a crash;

Currently (Q4 2025), the price peaked at 2.3, showing a decreasing peak trend.
Source: https://www.coinglass.com/pro/i/four-year-moving-average

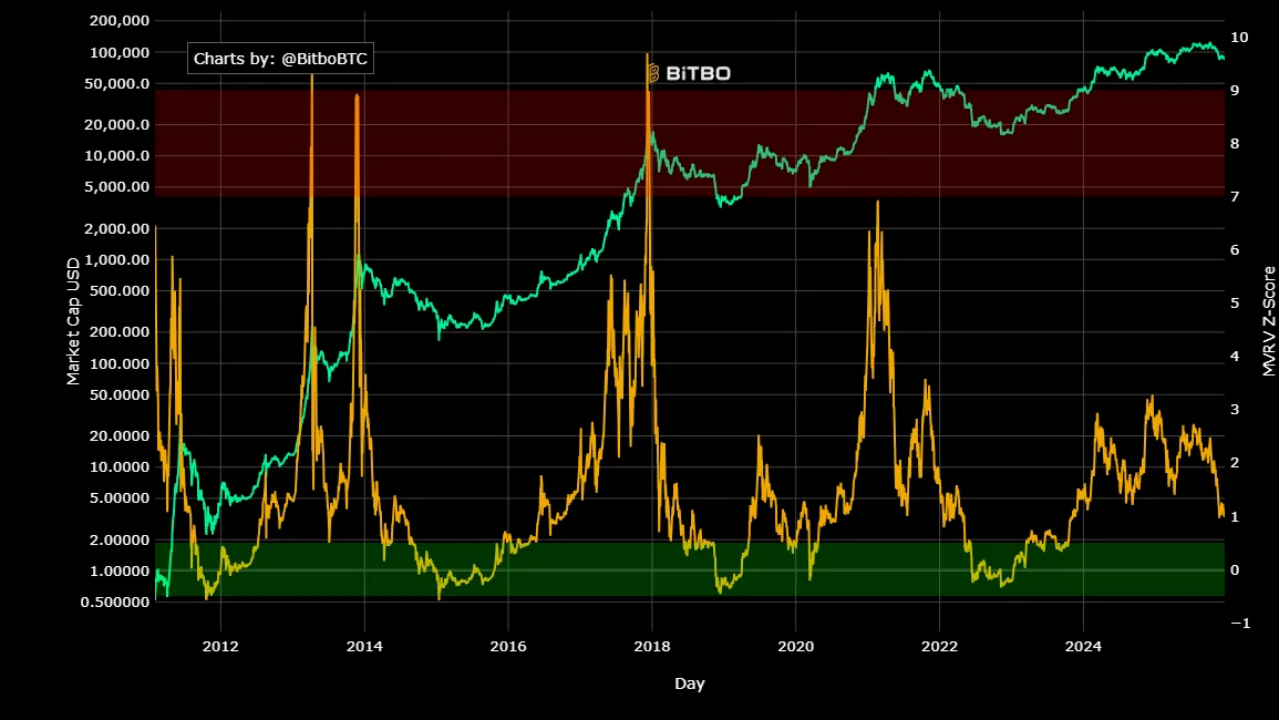
6. Bitcoin MVRV Z-Score: Has Valuation Entered the Risk Zone?

The MVRV Z-Score is a classic on-chain indicator for assessing whether Bitcoin's valuation has "deviated from its true value."

Its principle compares Bitcoin's current market cap to its "realized cap" (the total cost basis of all coins) and calculates the standard deviation of this difference. In other words: a higher Z-Score means most holders are in profit, the market is "making too much money," and risk is accumulating.

Historically, the MVRV Z-Score has shown extreme spikes before each bull market peak:

2017 peak: Approached 10, a historical extreme;

2021 double top: Exceeded 7 at the first top, followed by a market crash;

Currently (Q4 2025), the Z-Score is in the 2~4 range, indicating neutral valuation.
Source: https://charts.bitbo.io/mvrv-z-score

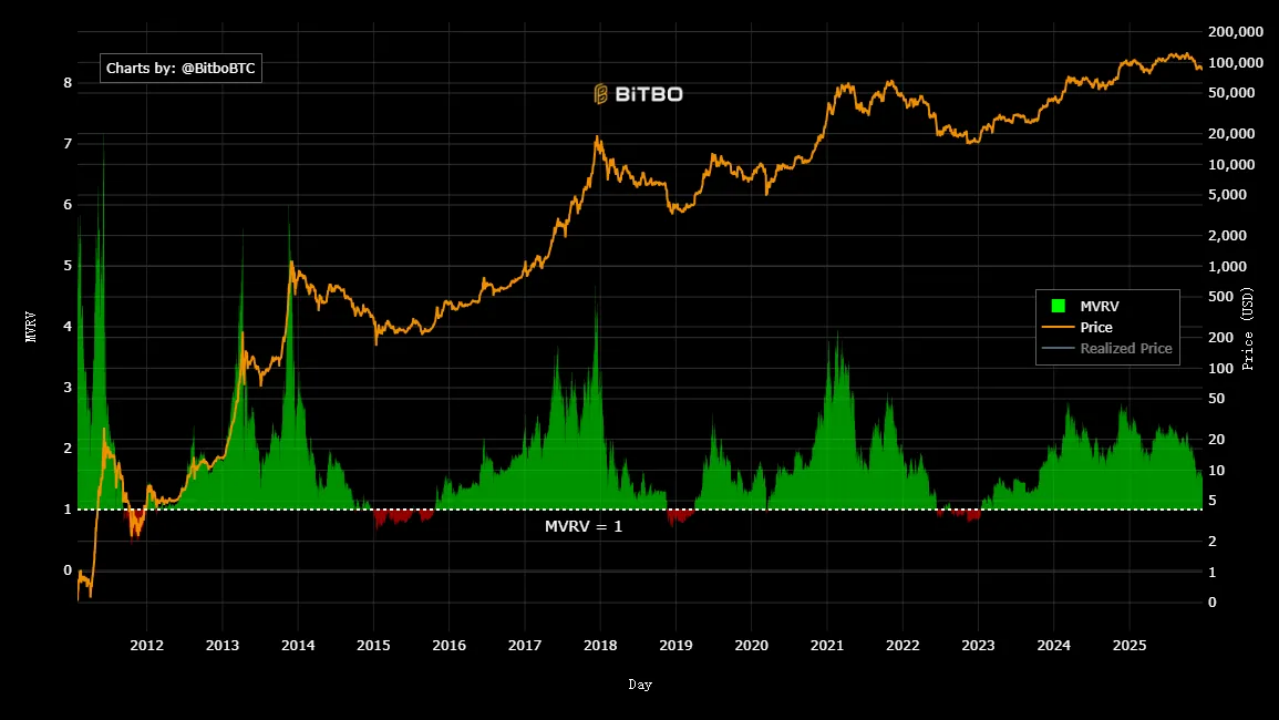
It is worth mentioning that the MVRV Rate adds statistical analysis to MVRV, measuring the standard deviation between the current MVRV and its historical average. This standardization helps identify when Bitcoin is trading above or below "fair value." However, as shown below, the peak values of this metric at each bull market top have shown a decreasing trend, and even diverged from the price peaks, greatly increasing the difficulty of using this indicator to predict tops.
Source: https://charts.bitbo.io/mvrv

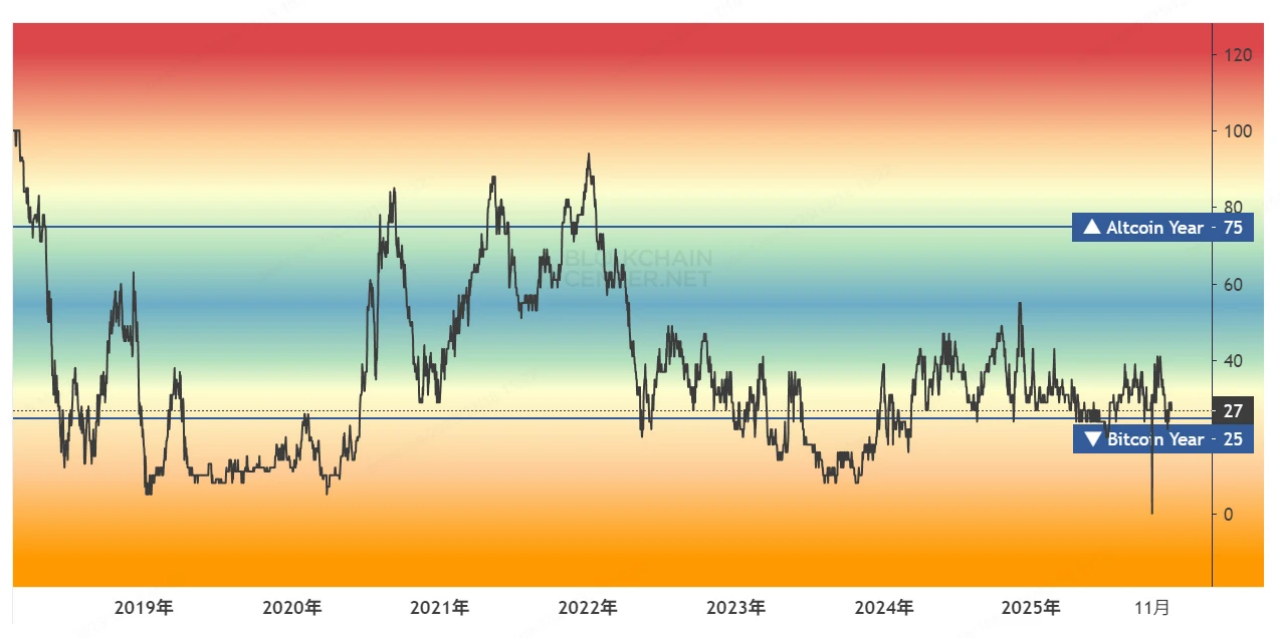
7. Altcoin Season Index: Has Altcoin Season Started?

The Altcoin Season Index tracks the performance of the top 100 altcoins relative to Bitcoin to assess whether an "alt season" has begun.

Its principle is based on relative performance: an index above 75 indicates the start of alt season, often occurring after a BTC top, as funds flow from BTC to alts. In other words, a high index means BTC dominance is weakening, and market risk is diversifying.

Historically, each bull market peak has ended with an alt season狂欢 as a closing signal:

2017 peak: Exceeded 90, alt season爆发;

2021 double top: Exceeded 80, followed by BTC correction;

Currently (Q4 2025), the index is in the 30~40 range, with the altcoin sector performing poorly. In fact, since the start of this BTC bull run, the index has not even reached 60, possibly due to insufficient liquidity and an oversupply of new coins.
Source: https://www.blockchaincenter.net/en/altcoin-season-index

8. Bitcoin Long Term Holder Supply (LTH): Is Long-Term Holder Supply Decreasing?

Bitcoin Long Term Holder Supply (LTH) tracks the supply of Bitcoin held for more than 155 days, reflecting HODLer behavior.

Its principle observes supply changes: at tops, LTHs often sell to realize profits; at bottoms, they accumulate. In other words, a decrease in LTH supply means "smart money" is exiting, indicating high risk.

Historically, LTH has shown significant decreases before each bull market peak:

2017 peak: The selling period lasted a year, peaking at the top;

2021 double top: The first top followed a sustained selling trend for half a year, but the accumulation at the second top reached a historical high;

Currently (Q4 2025), slow selling has been ongoing for half a year, but the October top does not align with historical patterns.
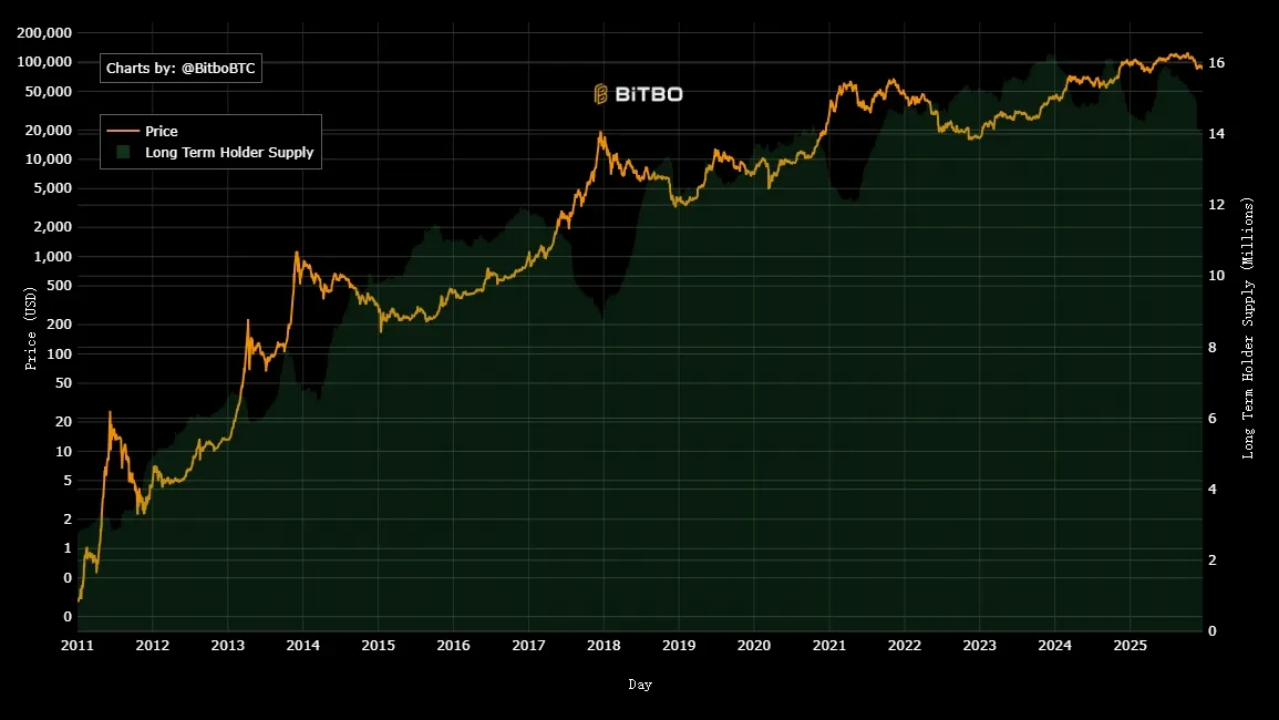
Source: https://charts.bitbo.io/long-term-holder-supply

9. Bitcoin Short Term Holder Supply (STH): Is Short-Term Holder Supply Surging?

Bitcoin Short Term Holder Supply (STH) tracks the proportion of Bitcoin held for less than 155 days, assessing novice speculation.

Its principle captures new capital inflows: a high proportion indicates rampant speculation, often预示 a top; a low proportion indicates market maturity. In other words, high STH means "too many newcomers," making bubbles prone to burst.

Historically, STH has shown surges before each bull market peak:

2017 peak: Nearly 8M BTC, speculation peak;

2021 double top: Nearly 6.5M BTC at the first top, with the absolute peak selling at the second top not reaching the highest level;

Currently, STH is steadily climbing接近 5.5M BTC, but the price peak was on October 6,不像 past bull markets where STH peaks and price tops were closely aligned.

Source: https://newhedge.io/bitcoin/short-term-holder-supply

10. Bitcoin Net Unrealized Profit/Loss (NUPL): Has Unrealized Profit/Loss Entered the Greed Zone?

Bitcoin NUPL measures the network's overall unrealized profit/loss ratio, assessing market sentiment.

Its principle is: calculate market cap minus realized cap, then divide by market cap: above 0.75 indicates greed (top signal); below 0 indicates fear (bottom signal). In other words, high NUPL means "everyone is in profit," indicating high selling risk.

Historically, Bitcoin NUPL has shown extremely high values before each bull market peak:

2017 peak: Exceeded 0.8, a historical extreme;

2021 double top: Exceeded 0.7, followed by a crash;

Currently (Q4 2025), NUPL reached a high of 0.64 in early March 2024, has been fluctuating since, and has now fallen to 0.34.
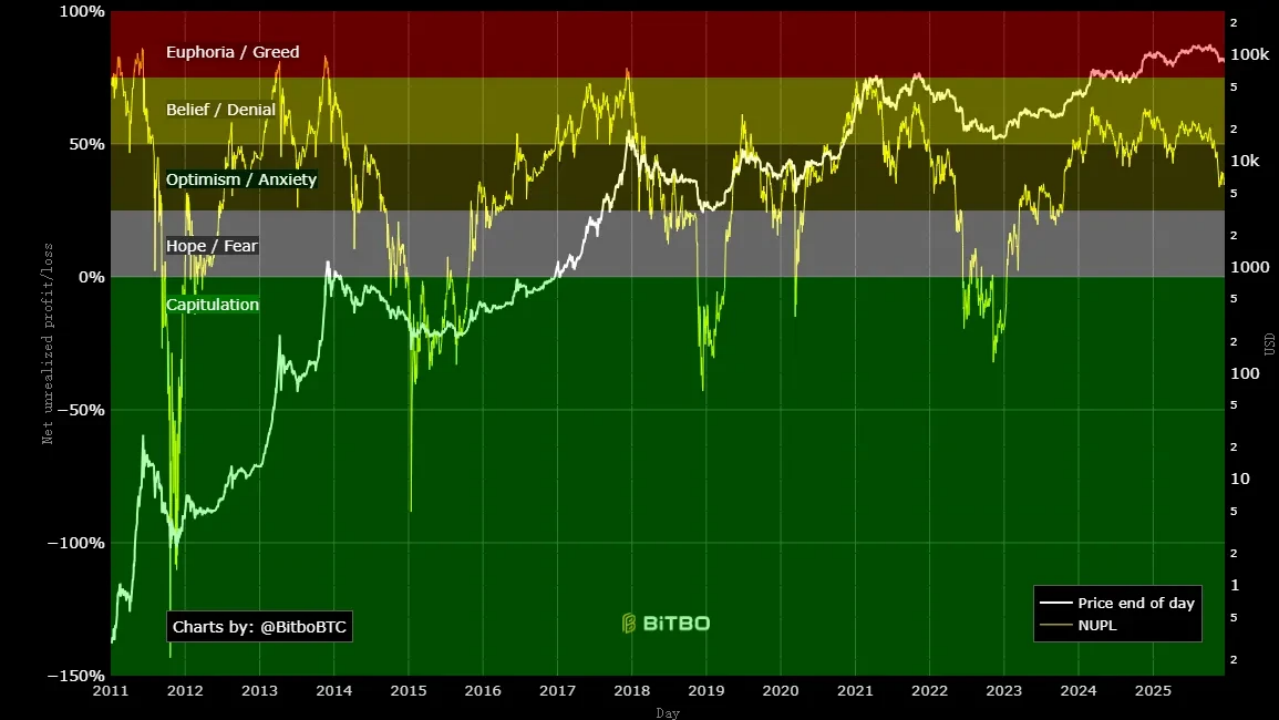
Source: https://charts.bitbo.io/net-unrealized-profit-loss

Conclusion: Structural Changes in the Current Bitcoin Bull Market

Based on the above indicators, the current Bitcoin market trend does not highly align with the extreme performances seen at past bull market tops. Historical tops were often accompanied by multiple indicators overheating simultaneously, such as high Z-Score, high Puell Multiple, NUPL entering the greed zone, accompanied by LTH selling and STH surges, but now these indicators are performing very moderately.

This does not mean that the current Bitcoin price has not yet peaked; these indicators are all based on spatial judgment, and the following chart, which predicts price tops based on a 3-year time cycle,似乎 suggests that Bitcoin has already peaked.
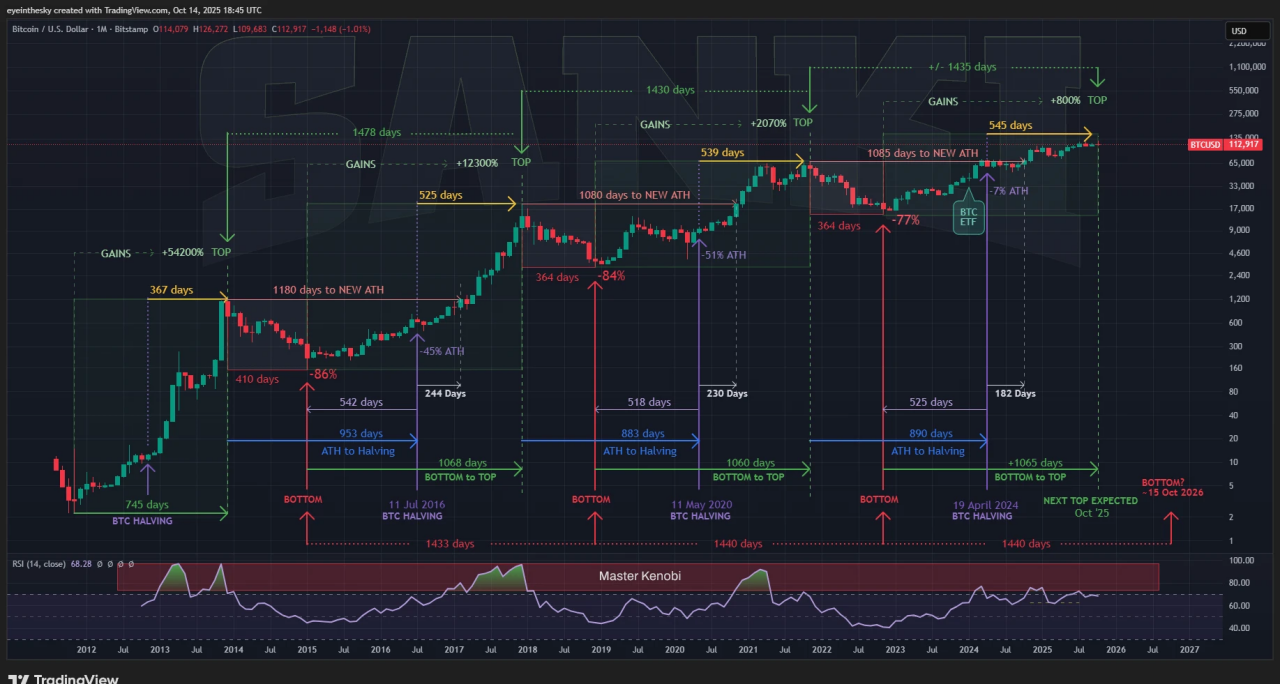
Source: https://x.com/btc_MasterPlan/status/1978180632410042828/photo/1

Of course, in analyzing the above indicators, we also found that these tools, based on linear price predictions, have already shown signs of decay in predicting top regions, exhibiting diminishing marginal effects. For example, the peak MVRV values during the 2017, 2021, and 2025 bull market tops were 10, 7, and 3 respectively. We显然 cannot expect the MVRV to reach 7 in this bull run, nor is it easy to predict a reliable value corresponding to this bull market top from MVRV.

In other words, while these indicators suggest the market is in a neutral or moderate range, they do not confirm that the bull market continues or that a bear market has arrived. Instead, they indicate that Bitcoin market growth has become more gradual rather than explosive, which may be attributed to:

First, the introduction of Bitcoin ETFs has attracted substantial long-term capital, stabilizing supply dynamics, which contrasts with past retail-driven bubbles and slows the pace of overheating.

Second, changes in global liquidity in 2025 (Fed rate cuts vs. BOJ rate hikes) and geopolitical shifts have repeatedly impacted BTC's price, and the平稳 changes in various indicators恰恰 show a more mature market.

In summary, whether the current high on October 6 is the peak of this bull market or not, we must acknowledge that Bitcoin price volatility may have broken through past historical frameworks and experiences. It seems to be undergoing a structural transformation from a "cyclical asset" to a "mainstream reserve." It is worth reminding investors that these indicators may need adjusted thresholds or combined use to be better applied to investment decisions.

About Us

WEEX Labs is the research department of WEEX Exchange, dedicated to tracking and analyzing cryptocurrencies, blockchain technology, and emerging market trends, providing professional assessments.

The team adheres to the principles of objective, independent, and comprehensive analysis, aiming to explore cutting-edge trends and investment opportunities through rigorous research methods and前沿 data analysis, outputting comprehensive, rigorous, and clear insights for the industry, and providing全方位 construction and investment guidance for Web3 startups and investors.

Disclaimer

The views expressed in this article are for reference only and do not constitute an endorsement of any products or services discussed, nor do they constitute any investment, financial, or trading advice. Readers should consult qualified professionals before making financial decisions. Please note that WEEX Labs may restrict or prohibit all or part of its services from restricted areas.


Трендові криптовалюти

Пов'язані питання

QWhat is the Pi Cycle Top Indicator and what does it currently indicate about the Bitcoin market?

AThe Pi Cycle Top Indicator uses the 111-day moving average (111DMA) and the 350-day moving average multiplied by 2 (350DMA x 2) to identify market tops. Historically, a crossover occurs before a top. As of Q4 2025, the lines have not yet crossed, suggesting the market may not have reached a classic top signal according to this indicator.

QHow does the Puell Multiple gauge market cycles and what is its current reading?

AThe Puell Multiple measures the ratio of miners' revenue to its 365-day moving average, indicating miner profitability and potential selling pressure. A high value suggests a top. Currently, in Q4 2025, it is in the 1-2 range, indicating moderate miner pressure, not the extreme levels seen at past tops.

QAccording to the article, what is a key structural reason why this bull market might be different from previous ones?

AA key structural reason is the introduction of Bitcoin ETFs, which have attracted significant long-term institutional capital. This has stabilized supply dynamics and created a more gradual, mature market, contrasting with the retail-driven, rapid bubble formations of the past.

QWhat trend does the MVRV Z-Score show across the last three bull market peaks (2017, 2021, 2025)?

AThe MVRV Z-Score has shown a clear trend of diminishing peaks across the last three bull markets. It reached nearly 10 in 2017, over 7 at the first peak in 2021, and was only around 3 in the current cycle (Q4 2025), indicating its predictive power for identifying absolute tops may be weakening.

QWhat does the Altcoin Season Index measure and what does its current low value suggest?

AThe Altcoin Season Index tracks the performance of the top 100 altcoins relative to Bitcoin. A value above 75 indicates an 'altcoin season' where capital flows from BTC to alts, often near a market top. Its current low value (30-40 range in Q4 2025) suggests altcoins are underperforming and a classic speculative top has not been reached.

Пов'язані матеріали

Must-Watch Events Next Week|CLARITY Act Could Face Senate Vote; SpaceX, Circle to Report Earnings (8.3-8.9)

**Summary: Key Events and Developments to Watch (August 3-9)** The upcoming week is marked by significant financial disclosures, key legislative deadlines, and notable product updates. **Major Financial Events:** Several companies are scheduled to release their Q2 2026 earnings. American Bitcoin (ABTC) will report on August 3, followed by SpaceX and Hut 8 Mining Corp. on August 4, and Circle on August 5. Notably, a significant portion of SpaceX shares (up to 12% of total shares) will be unlocked on August 6 following their earnings release. **Key Legislative Deadline:** The U.S. Senate faces an August 7 deadline to secure 60 votes for the CLARITY Act, a bipartisan bill aiming to establish a federal regulatory framework for cryptocurrencies. The Senate may hold a full vote on the bill during the week. **Economic Data:** The U.S. July Non-Farm Payrolls report will be released on August 7, providing crucial labor market data. **Technology & Product Updates:** * **Shutdowns:** DeFi portfolio tracker Zapper and wallet app Ctrl Wallet will cease operations on August 3. * **Upgrades:** LayerZero will deprecate its v1 relayers on August 3. XRP Ledger's new version 3.3.0, featuring five new functions, is expected next week. * **AI:** Elon Musk announced that the advanced Grok 4.6 AI model is set for release around August 7. * **Bitcoin:** The BIP-110 forced signaling for a potential Bitcoin network change is scheduled to begin around August 8. **Other Notable Events:** Chinese robotics firm Unitree Tech has set its preliminary price inquiry for its IPO for August 5. South Korean exchange Upbit will delist AQT and AERGO tokens on August 3.

marsbit1 год тому

Must-Watch Events Next Week|CLARITY Act Could Face Senate Vote; SpaceX, Circle to Report Earnings (8.3-8.9)

marsbit1 год тому

Stocks Are Plummeting More Sharply Than Cryptocurrencies. Where Has the Money Gone?

Stock Markets Plunge Deeper Than Cryptocurrencies: Where Did the Money Go? In late July, Seoul's Kospi index triggered circuit breakers for two consecutive days, plummeting over 40% from its June high. The collapse was led by heavyweight stocks like SK Hynix, whose record profits still disappointed investors, and devastating leveraged ETFs, with one major product losing over 83% of its value. This signaled a global, forced deleveraging targeting the most crowded trades. Interestingly, while stocks exhibited extreme volatility akin to crypto markets, Bitcoin rose nearly 15% in July after a prior steep drop. Analysis shows the money fleeing equities did not flow into Bitcoin. Instead, Bitcoin had already absorbed its sell-off in May-June, when U.S. spot Bitcoin ETFs saw historic outflows. The true safe-haven beneficiary was gold, whose price rose over 20% year-on-year, highlighting a decoupling between Bitcoin and gold as "digital gold." The sell-off was a targeted unwinding of leveraged positions in tech and semiconductors, accelerated by broker-dealer risk management and shifts in the AI narrative, including new competition from Chinese memory chipmakers. The retreat path was clear: from high-valuation tech stocks to cash and U.S. Treasuries, then to gold. For Bitcoin to attract sustained institutional inflows, conditions like eased global liquidity pressure, a "soft-landing" Fed rate cut, and U.S. regulatory clarity via legislation like the stalled CLARITY Act are needed. Currently, Bitcoin is not a safe haven but an already-cleared asset. Its low correlation with tech stocks, however, makes it a potential diversification play for institutional portfolios once the storm passes. The money isn't here yet, but the positioning is underway.

marsbit1 год тому

Stocks Are Plummeting More Sharply Than Cryptocurrencies. Where Has the Money Gone?

marsbit1 год тому

In Conversation with Ray Dalio: We Are Currently in an AI Bubble, with 1% of My Portfolio in Bitcoin

Ray Dalio, founder of Bridgewater Associates, warns in an interview that the current AI boom shows classic bubble characteristics, which could lead to significant economic downturns as seen in past cycles like 1929 or 2000. He explains that speculative enthusiasm, fueled by debt and overvaluation, often precedes a crash when rising rates or taxation force asset sales, causing widespread losses and recession. Dalio also outlines his "Big Cycle" theory, describing an approximate 80-year pattern where widening wealth gaps, massive government deficits, and shifting geopolitical power (like China's rise) create internal conflict and global instability. He emphasizes that we are in a late-cycle, transitional phase where traditional powers like the US and UK face decline. For personal wealth protection, Dalio advises diversification beyond cash into assets like stocks, bonds, real estate, and particularly gold, which he prefers over Bitcoin. While he holds about 1% of his portfolio in Bitcoin as a non-printable hard asset, he views gold as more secure from technological or governmental threats. Regarding AI's impact, Dalio believes it will disproportionately benefit capital owners, worsening inequality by replacing both physical and cognitive labor. He suggests that human intuition and emotional intelligence, combined with AI, will be key for future workers. On taxation, Dalio argues that wealth taxes are impractical and risk triggering asset sell-offs, reducing productive investment. He points to the UK as a cautionary example of debt, low productivity, and political strife. Geopolitically, Dalio foresees a more regionalized world, with the US showing weakness in prolonged conflicts like with Iran, akin to past imperial declines. The ideal outcome, he suggests, is coexisting powerful blocs (e.g., Americas, China-Asia Pacific) without major war.

marsbit5 год тому

In Conversation with Ray Dalio: We Are Currently in an AI Bubble, with 1% of My Portfolio in Bitcoin

marsbit5 год тому

Торгівля

Спот

Популярні статті

Що таке BITCOIN

Розуміння HarryPotterObamaSonic10Inu (ERC-20) та його позиції у крипто-просторі Останніми роками ринок криптовалют спостерігав за зростанням популярності мем-коінів, які привертають інтерес не тільки трейдерів, але й тих, хто шукає спілкування та розважальну цінність. Серед цих унікальних токенів є HarryPotterObamaSonic10Inu (ERC-20), інтригуючий проект, що поєднує культурні посилання з тканинами криптовалюти. Ця стаття досліджує ключові аспекти HarryPotterObamaSonic10Inu, вивчаючи його механізми, спільноту та його взаємодію з ширшим крипто-ландшафтом. Що таке HarryPotterObamaSonic10Inu (ERC-20)? Як випливає з його назви, HarryPotterObamaSonic10Inu є мем-коіном, побудованим на блокчейні Ethereum, класифікованим за стандартом ERC-20. На відміну від традиційних криптовалют, які можуть підкреслювати практичну корисність або інвестиційний потенціал, цей токен процвітає завдяки розважальній цінності та силі своєї спільноти. Проект спрямований на створення середовища, де зацікавлені користувачі можуть об'єднуватися, ділитися ідеями та брати участь у заходах, натхненних різноманітними культурними явищами. Однією з примітних особливостей HarryPotterObamaSonic10Inu є нульовий податок на транзакції. Цей привабливий елемент має на меті заохочувати торгівлю та участь у спільноті, позбавлену додаткових витрат, які можуть відлякувати дрібних трейдерів. Загальна пропозиція монет становить один мільярд токенів, що позначає намір підтримувати суттєву циркуляцію в межах спільноти. Творець HarryPotterObamaSonic10Inu (ERC-20) Походження HarryPotterObamaSonic10Inu дещо окутане таємницею; деталі про творця залишаються невідомими. Розвиток цього токена позбавлений впізнаваної команди або чіткої стратегії, що не є рідкістю в секторі мем-коінів. Натомість проект виник органічно, а його розвиток значною мірою залежить від ентузіазму та участі його спільноти. Інвестори HarryPotterObamaSonic10Inu (ERC-20) Щодо зовнішніх інвестицій та підтримки, HarryPotterObamaSonic10Inu також залишається невизначеним. Токен не зазначає жодних відомих інвестиційних фондів або значної організаційної підтримки. Натомість життєва сила проекту полягає в його базовій спільноті, яка інформує про його зростання та стійкість через колективні дії та залученість у крипто-просторі. Як працює HarryPotterObamaSonic10Inu (ERC-20)? Як мем-коін, HarryPotterObamaSonic10Inu функціонує передусім поза традиційними рамками, що часто регулюють вартість активів. Є кілька відмінних аспектів, що визначають, як працює проект: Транзакції без податку: Завдяки відсутності податкових зборів на транзакції, користувачі можуть вільно купувати та продавати токен, не турбуючись про приховані витрати. Залучення спільноти: Проект процвітає завдяки взаємодії спільноти, використовуючи соціальні медіа для створення шуму та сприяння залученню. Обговорення, обмін контентом та залученість є ключовими елементами, що допомагають розширити його охоплення та зміцнити лояльність серед прихильників. Відсутність практичної корисності: Слід зазначити, що HarryPotterObamaSonic10Inu не пропонує конкретної корисності в рамках фінансової екосистеми. Натомість він класифікується як токен, що призначений в основному для розваги та спільнотних активностей. Культурне посилання: Токен кмітливо вплітає елементи популярної культури, щоб привернути інтерес, зв'язуючи з ентузіастами мемів та крипто-стежками. HarryPotterObamaSonic10Inu ілюструє, як мем-коіни функціонують інакше, ніж традиційні криптовалютні проекти, увійшовши на ринок як інноваційні соціальні конструкти, а не утилітарні активи. Хронологія HarryPotterObamaSonic10Inu (ERC-20) Історія HarryPotterObamaSonic10Inu відзначена кількома значними етапами: Створення: Токен виник з вірусного мему, захопивши уяву багатьох крипто-ентузіастів. Конкретні дати створення недоступні, що підкреслює його органічний розвиток. Лістинг на біржах: HarryPotterObamaSonic10Inu з'явився на різних біржах, дозволяючи зручніший доступ і торгівлю спільноти. Ініціативи залучення спільноти: Ведення діяльності, спрямованої на покращення взаємодії спільноти, включаючи конкурси, кампанії в соціальних мережах та створення контенту від фанатів та прихильників. Плани на майбутнє: Дорожня карта проекту включає запуск колекції NFT, мерчандайзинг та електронну комерцію, пов'язану з його культурними темами, що далі залучає спільноту та намагається додати більше вимірів до його екосистеми. Ключові моменти про HarryPotterObamaSonic10Inu (ERC-20) Спільнотний підхід: Проект надає пріоритет колективному внеску та креативності, забезпечуючи, щоб участь користувачів була в центрі його розвитку. Класифікація як мем-коін: Це є його епігенез розважальної криптовалюти, що відрізняється від традиційних інвестиційних інструментів. Жодного прямого відношення до Bitcoin: Незважаючи на схожість у назві, HarryPotterObamaSonic10Inu є відмінним і не має жодного зв’язку з Bitcoin або іншими усталеними криптовалютами. Зосередженість на співпраці: HarryPotterObamaSonic10Inu створено для того, щоб надати простір для співпраці та обміну історіями серед його власників, забезпечуючи шлях для творчості та спільного зв'язку. Перспективи на майбутнє: Амбіція розширитися за межі початкової концепції в NFT та мерчандайз відкриває шлях для проекту потенційно потрапити в більш мейнстрімні сфери цифрової культури. Оскільки мем-коіни продовжують захоплювати уяву спільноти криптовалют, HarryPotterObamaSonic10Inu (ERC-20) вирізняється своїми культурними зв'язками та орієнтованим на спільноту підходом. Хоча він може не відповідати типовій моделі утилітарного токена, його суть полягає в радощах і товариськості, що підтримуються серед його прихильників, підкреслюючи еволюційну природу криптовалют в усе більш цифрову епоху. Оскільки проект продовжує розвиватися, важливо спостерігати за тим, як динаміка спільноти вплине на його траєкторію в постійно змінюваному ландшафті технології блокчейн.

2.4k переглядів усьогоОпубліковано 2024.04.01Оновлено 2024.12.03

Що таке BITCOIN

Як купити BTC

Ласкаво просимо до HTX.com! Ми зробили покупку Bitcoin (BTC) простою та зручною. Дотримуйтесь нашої покрокової інструкції, щоб розпочати свою криптовалютну подорож.Крок 1: Створіть обліковий запис на HTXВикористовуйте свою електронну пошту або номер телефону, щоб зареєструвати обліковий запис на HTX безплатно. Пройдіть безпроблемну реєстрацію й отримайте доступ до всіх функцій.ЗареєструватисьКрок 2: Перейдіть до розділу Купити крипту і виберіть спосіб оплатиКредитна/дебетова картка: використовуйте вашу картку Visa або Mastercard, щоб миттєво купити Bitcoin (BTC).Баланс: використовуйте кошти з балансу вашого рахунку HTX для безперешкодної торгівлі.Треті особи: ми додали популярні способи оплати, такі як Google Pay та Apple Pay, щоб підвищити зручність.P2P: Торгуйте безпосередньо з іншими користувачами на HTX.Позабіржова торгівля (OTC): ми пропонуємо індивідуальні послуги та конкурентні обмінні курси для трейдерів.Крок 3: Зберігайте свої Bitcoin (BTC)Після придбання Bitcoin (BTC) збережіть його у своєму обліковому записі на HTX. Крім того, ви можете відправити його в інше місце за допомогою блокчейн-переказу або використовувати його для торгівлі іншими криптовалютами.Крок 4: Торгівля Bitcoin (BTC)Легко торгуйте Bitcoin (BTC) на спотовому ринку HTX. Просто увійдіть до свого облікового запису, виберіть торгову пару, укладайте угоди та спостерігайте за ними в режимі реального часу. Ми пропонуємо зручний досвід як для початківців, так і для досвідчених трейдерів.

5.3k переглядів усьогоОпубліковано 2024.12.12Оновлено 2026.06.02

Як купити BTC

Що таке $BITCOIN

ЦИФРОВЕ ЗОЛОТО ($BITCOIN): Комплексний аналіз Вступ до ЦИФРОВОГО ЗОЛОТА ($BITCOIN) ЦИФРОВЕ ЗОЛОТО ($BITCOIN) — це проект на основі блокчейну, що працює в мережі Solana, який має на меті поєднати характеристики традиційних дорогоцінних металів з інноваціями децентралізованих технологій. Хоча він має таку ж назву, як і Bitcoin, який часто називають “цифровим золотом” через його сприйняття як засобу збереження вартості, ЦИФРОВЕ ЗОЛОТО є окремим токеном, розробленим для створення унікальної екосистеми в ландшафті Web3. Його мета — позиціонувати себе як життєздатний альтернативний цифровий актив, хоча деталі щодо його застосувань і функціональностей все ще розробляються. Що таке ЦИФРОВЕ ЗОЛОТО ($BITCOIN)? ЦИФРОВЕ ЗОЛОТО ($BITCOIN) — це токен криптовалюти, спеціально розроблений для використання в блокчейні Solana. На відміну від Bitcoin, який виконує широко визнану роль зберігання вартості, цей токен, здається, зосереджується на більш широких застосуваннях і характеристиках. Помітні аспекти включають: Інфраструктура блокчейну: Токен побудований на блокчейні Solana, відомому своєю здатністю обробляти швидкі та низьковартісні транзакції. Динаміка постачання: ЦИФРОВЕ ЗОЛОТО має максимальне постачання, обмежене 100 квадрильйонами токенів (100P $BITCOIN), хоча деталі щодо його обігового постачання наразі не розголошуються. Утиліта: Хоча точні функціональності не викладені, є вказівки на те, що токен може бути використаний для різних застосувань, потенційно пов'язаних з децентралізованими додатками (dApps) або стратегіями токенізації активів. Хто є творцем ЦИФРОВОГО ЗОЛОТА ($BITCOIN)? На даний момент особа творців і команди розробників, що стоять за ЦИФРОВИМ ЗОЛОТОМ ($BITCOIN), залишається невідомою. Ця ситуація є типовою для багатьох інноваційних проектів у сфері блокчейну, особливо тих, що пов'язані з децентралізованими фінансами та феноменом мем-коінів. Хоча така анонімність може сприяти культурі, орієнтованій на спільноту, вона посилює занепокоєння щодо управління та підзвітності. Хто є інвесторами ЦИФРОВОГО ЗОЛОТА ($BITCOIN)? Доступна інформація вказує на те, що ЦИФРОВЕ ЗОЛОТО ($BITCOIN) не має жодних відомих інституційних спонсорів або помітних венчурних капіталовкладень. Проект, здається, працює за моделлю “рівний до рівного”, зосереджуючись на підтримці та прийнятті спільноти, а не на традиційних шляхах фінансування. Його активність і ліквідність переважно розташовані на децентралізованих біржах (DEX), таких як PumpSwap, а не на встановлених централізованих торгових платформах, що ще більше підкреслює його підхід знизу вгору. Як працює ЦИФРОВЕ ЗОЛОТО ($BITCOIN) Операційні механізми ЦИФРОВОГО ЗОЛОТА ($BITCOIN) можна детальніше розглянути на основі його дизайну блокчейну та характеристик мережі: Механізм консенсусу: Використовуючи унікальний proof-of-history (PoH) Solana в поєднанні з моделлю proof-of-stake (PoS), проект забезпечує ефективну валідацію транзакцій, що сприяє високій продуктивності мережі. Токеноміка: Хоча конкретні дефляційні механізми не були детально описані, велике максимальне постачання токенів вказує на те, що воно може задовольняти мікротранзакції або нішеві випадки використання, які ще потрібно визначити. Інтероперабельність: Існує потенціал для інтеграції з більш широкою екосистемою Solana, включаючи різні платформи децентралізованих фінансів (DeFi). Однак деталі щодо конкретних інтеграцій залишаються невизначеними. Хронологія ключових подій Ось хронологія, яка підкреслює значні віхи, пов'язані з ЦИФРОВИМ ЗОЛОТОМ ($BITCOIN): 2023: Початкове розгортання токена відбувається на блокчейні Solana, позначене його адресою контракту. 2024: ЦИФРОВЕ ЗОЛОТО набуває видимості, оскільки стає доступним для торгівлі на децентралізованих біржах, таких як PumpSwap, що дозволяє користувачам торгувати ним проти SOL. 2025: Проект спостерігає спорадичну торгову активність і потенційний інтерес до ініціатив, очолюваних спільнотою, хоча на даний момент не зафіксовано жодних значних партнерств або технічних досягнень. Критичний аналіз Сильні сторони Масштабованість: Основна інфраструктура Solana підтримує високі обсяги транзакцій, що може підвищити утиліту $BITCOIN у різних сценаріях транзакцій. Доступність: Потенційно низька торгова ціна за токен може привабити роздрібних інвесторів, сприяючи більш широкій участі завдяки можливостям дробового володіння. Ризики Відсутність прозорості: Відсутність публічно відомих спонсорів, розробників або процесу аудиту може викликати скептицизм щодо стійкості та надійності проекту. Волатильність ринку: Торгова активність сильно залежить від спекулятивної поведінки, що може призвести до значної волатильності цін і невизначеності для інвесторів. Висновок ЦИФРОВЕ ЗОЛОТО ($BITCOIN) постає як цікавій, але неоднозначний проект у швидко розвиваючійся екосистемі Solana. Хоча він намагається використати наратив “цифрового золота”, його відхід від встановленої ролі Bitcoin як засобу збереження вартості підкреслює необхідність чіткішого розмежування його передбачуваної утиліти та структури управління. Майбутнє прийняття та адаптація, ймовірно, залежатиме від вирішення поточної непрозорості та більш чіткого визначення його операційних та економічних стратегій. Примітка: Цей звіт охоплює синтезовану інформацію, доступну станом на жовтень 2023 року, і можуть відбутися події, що виходять за межі дослідницького періоду.

270 переглядів усьогоОпубліковано 2025.05.13Оновлено 2025.05.13

Що таке $BITCOIN

Обговорення

Ласкаво просимо до спільноти HTX. Тут ви можете бути в курсі останніх подій розвитку платформи та отримати доступ до професійної ринкової інформації. Нижче представлені думки користувачів щодо ціни BTC (BTC).

活动图片













