Author: Kunal Doshi, Blockworks Research
Compiled by: Felix, PANews
This report analyzes Kalshi's rapid growth and the evolving structure of sports prediction markets, benchmarking its pricing, liquidity, and valuation against traditional sportsbooks. Additionally, it assesses whether these markets offer viable trading opportunities and what is driving their popularity.
Prediction markets have quickly evolved from niche products into significant financial instruments. While their initial mass adoption was driven by the 2024 U.S. elections, these markets have since expanded into new categories, with sports events becoming the largest and fastest-growing segment. This shift occurs against the backdrop of the $167 billion U.S. sports betting market, which continues to grow but remains structurally unfavorable to participants due to built-in vigorish (vig) and bookmaker-controlled pricing.
In contrast, prediction markets operate on a peer-to-peer (P2P) trading model, where prices reflect probabilities set by participants rather than odds set by a bookmaker. This creates a more transparent pricing mechanism, similar to financial markets, where price discovery is driven by information flow and participant behavior.
Kalshi's Growth and Market Composition
Kalshi has experienced rapid growth over the past year, with its monthly nominal trading volume surging 80-fold from $180 million in early 2025 to $14.4 billion in March 2026. The average monthly growth rate of 40% reflects increased user engagement and heightened trading activity.
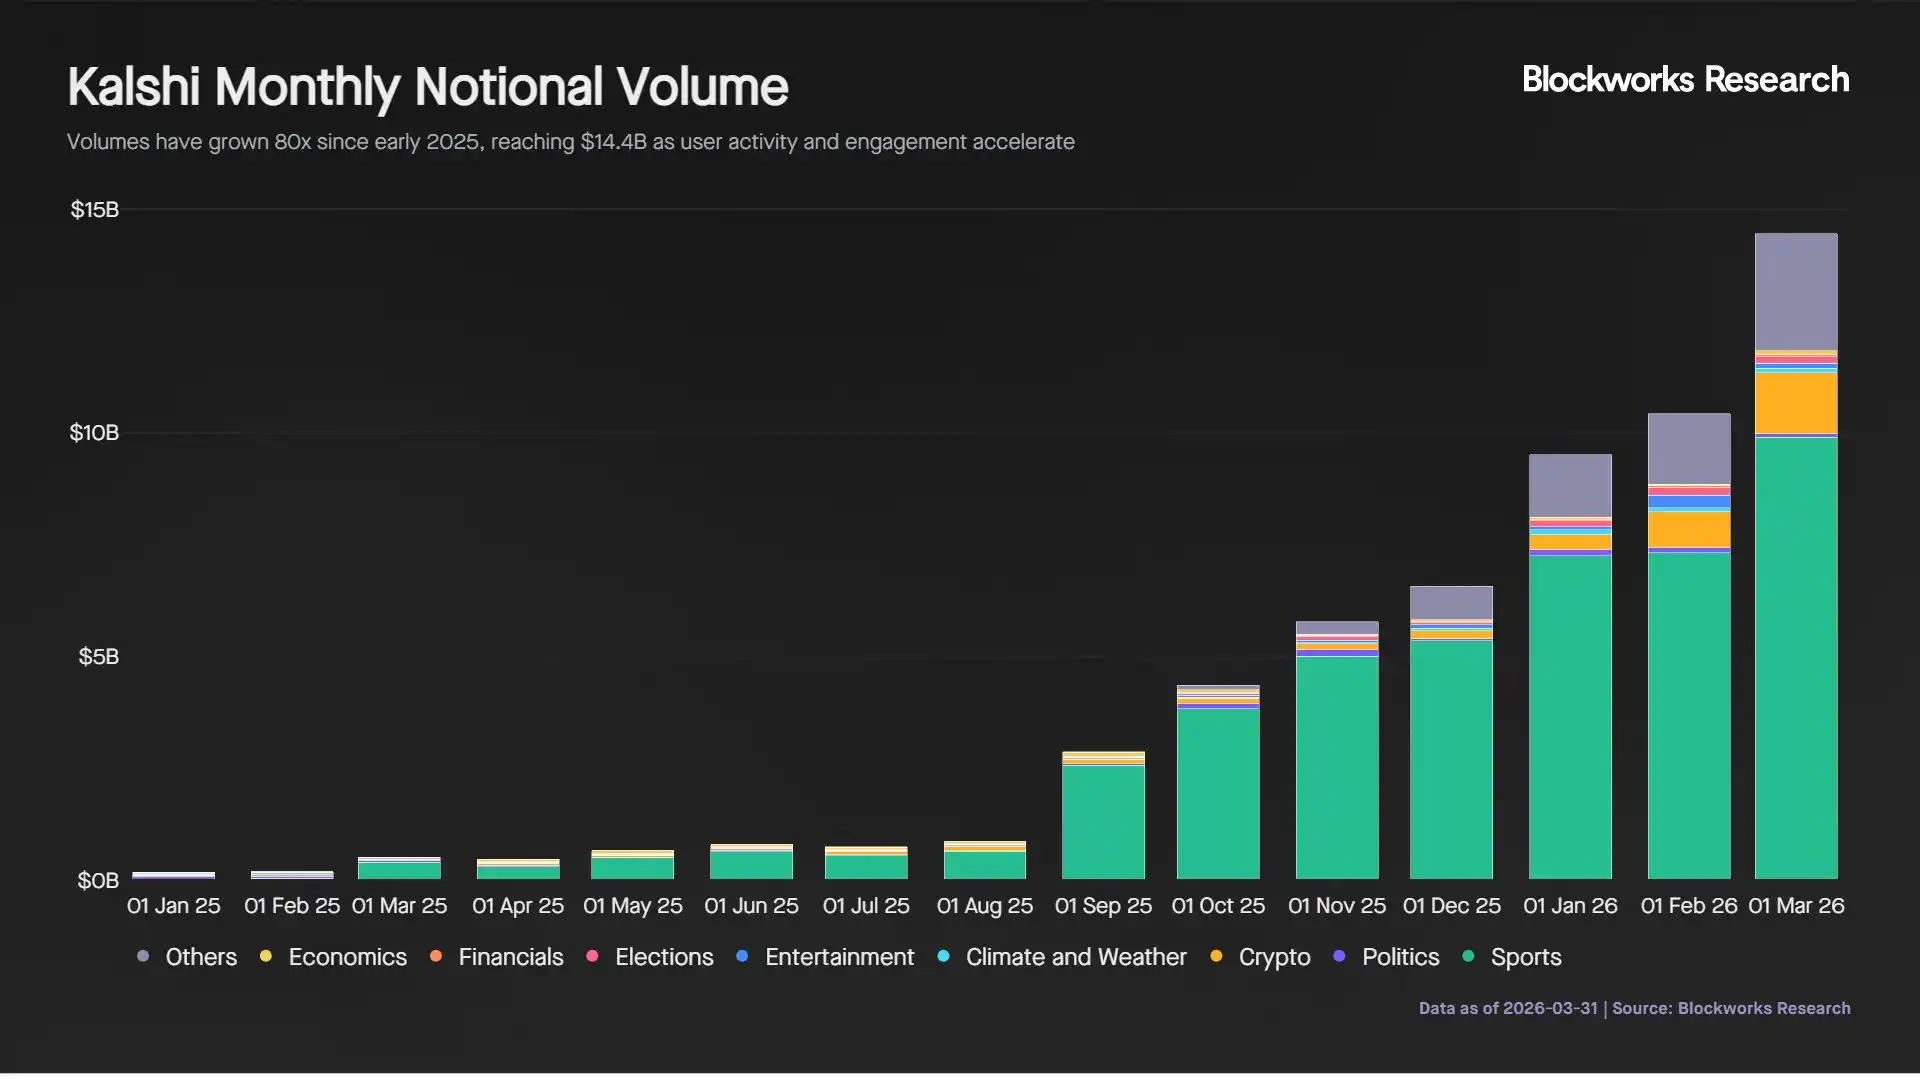
Sports markets have been the primary driver of this growth, now accounting for 68% of total trading volume. Volume in the sports segment grew from $540 million in July 2025 to $9.9 billion in March 2026, an 18-fold increase in three quarters. Kalshi has established a strong position in this area, capturing approximately 70% of the sports prediction market volume.
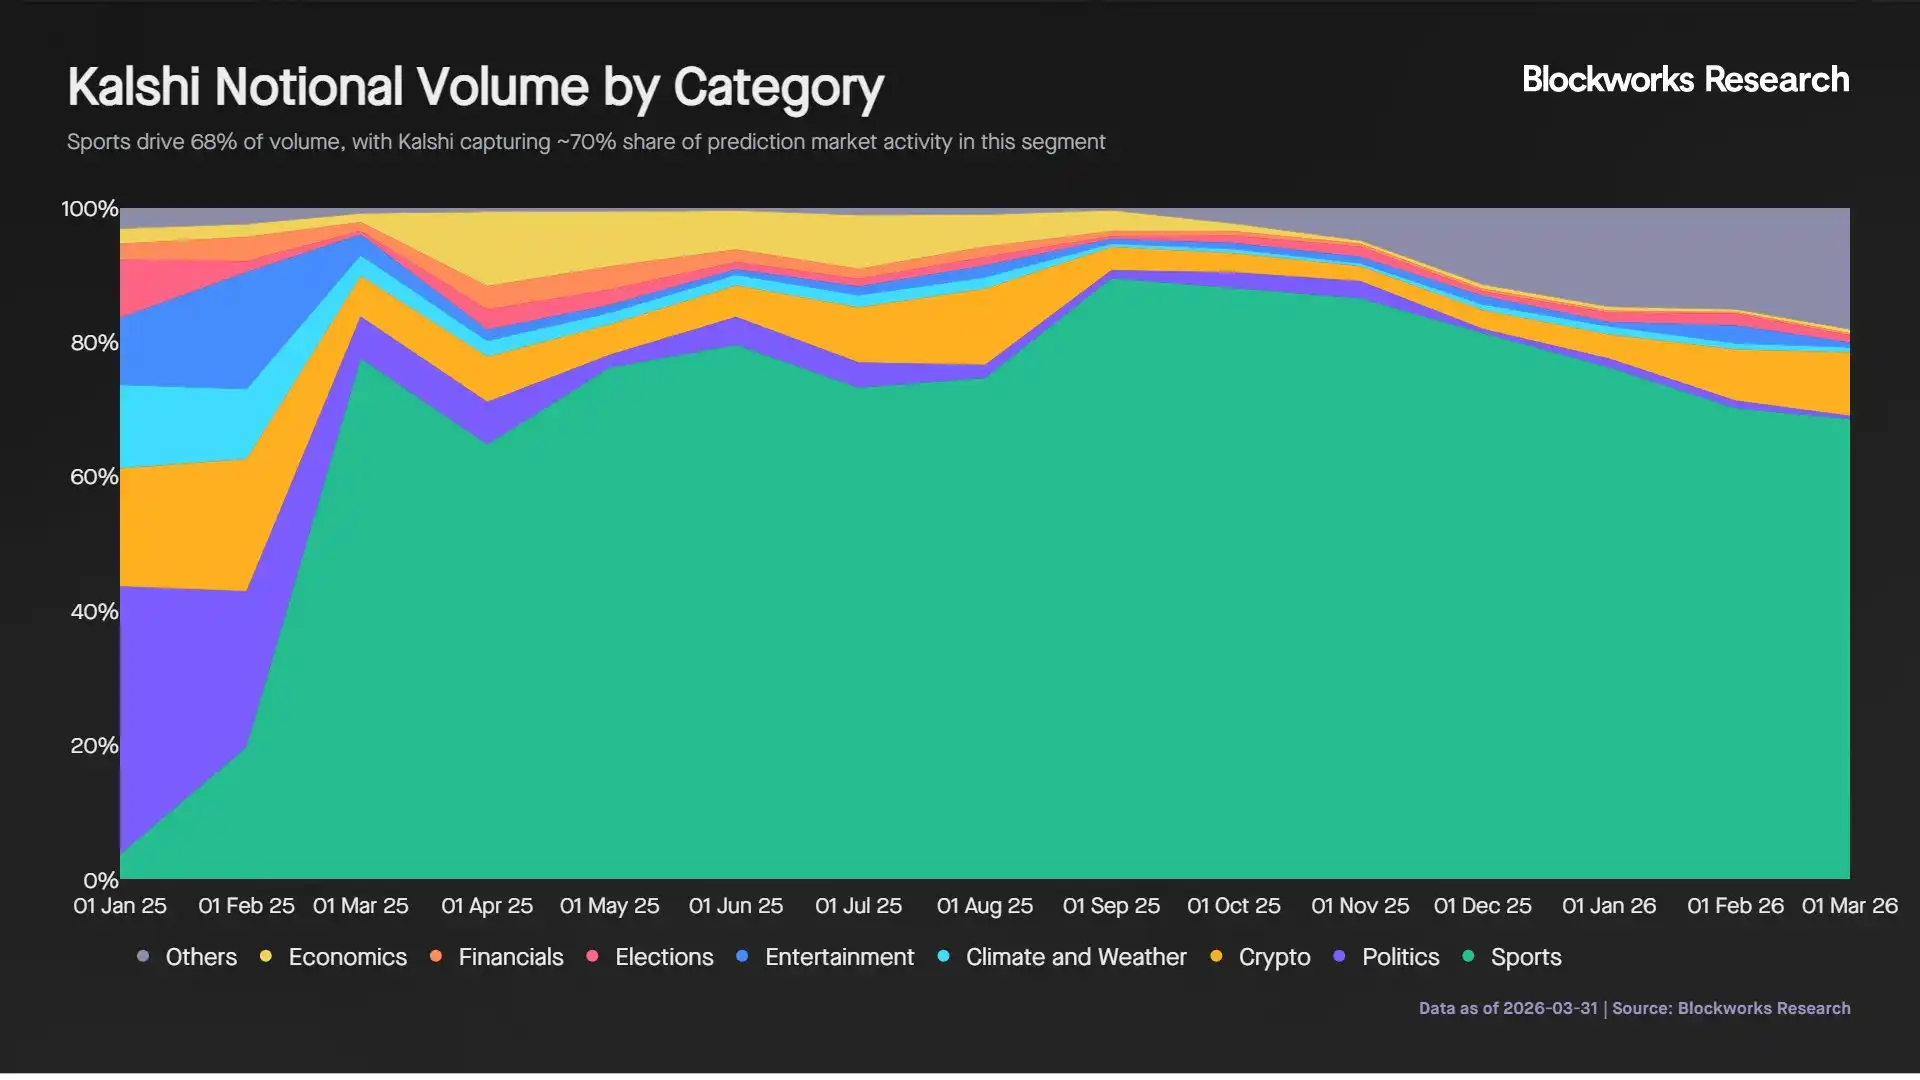
Simultaneously, the composition of trading volume has begun to diversify. The share of sports events has declined from its peak of 90% in September 2025 as other categories like cryptocurrencies, entertainment, and elections gain traction. This diversification reduces reliance on a single category and supports more stable long-term growth.
Within sports trading, volume is highly seasonal and driven by major events. Basketball accounts for 44% of sports volume, followed by football (28%) and tennis (10%). Football drove a sharp increase in volume from August to September 2025, surging from $640 million to $2.6 billion, but receded after the Super Bowl.
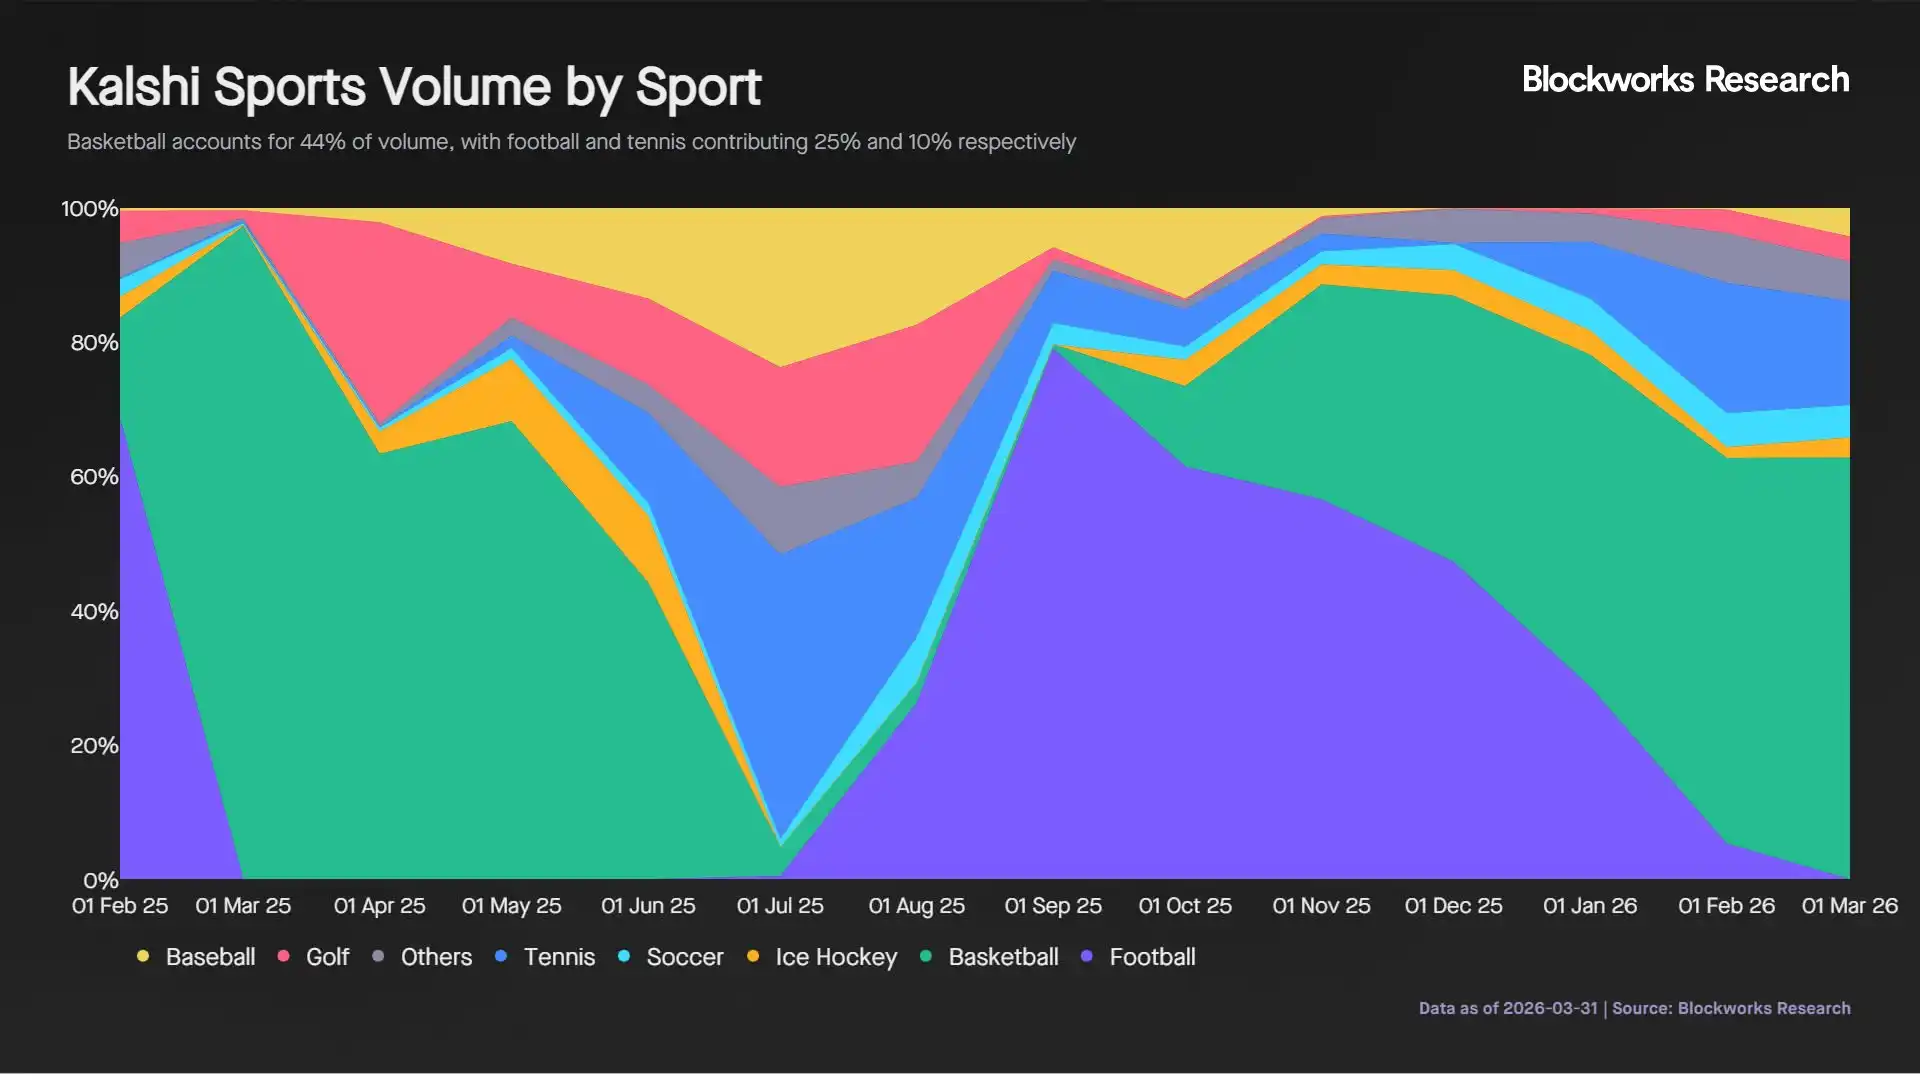
Basketball has dominated volume since October, with the recent NCAA Men's Basketball Tournament generating $1.5 billion in actual volume and $3.3 billion in nominal volume. This is comparable to the estimated $3.3 billion Americans wagered on March Madness in 2026, highlighting the growing role of prediction markets.
Pricing Accuracy and Informational Efficiency
Prediction markets aim to reflect true probabilities. To evaluate this, we compare the implied probabilities two days before a game with the actual outcomes. In an efficient market, a team with 70% odds should win approximately 70% of the time.
Focusing on basketball and NFL markets, which together account for 72% of Kalshi's sports volume, this analysis is based on 3,100 games involving $8.5 billion in nominal volume.
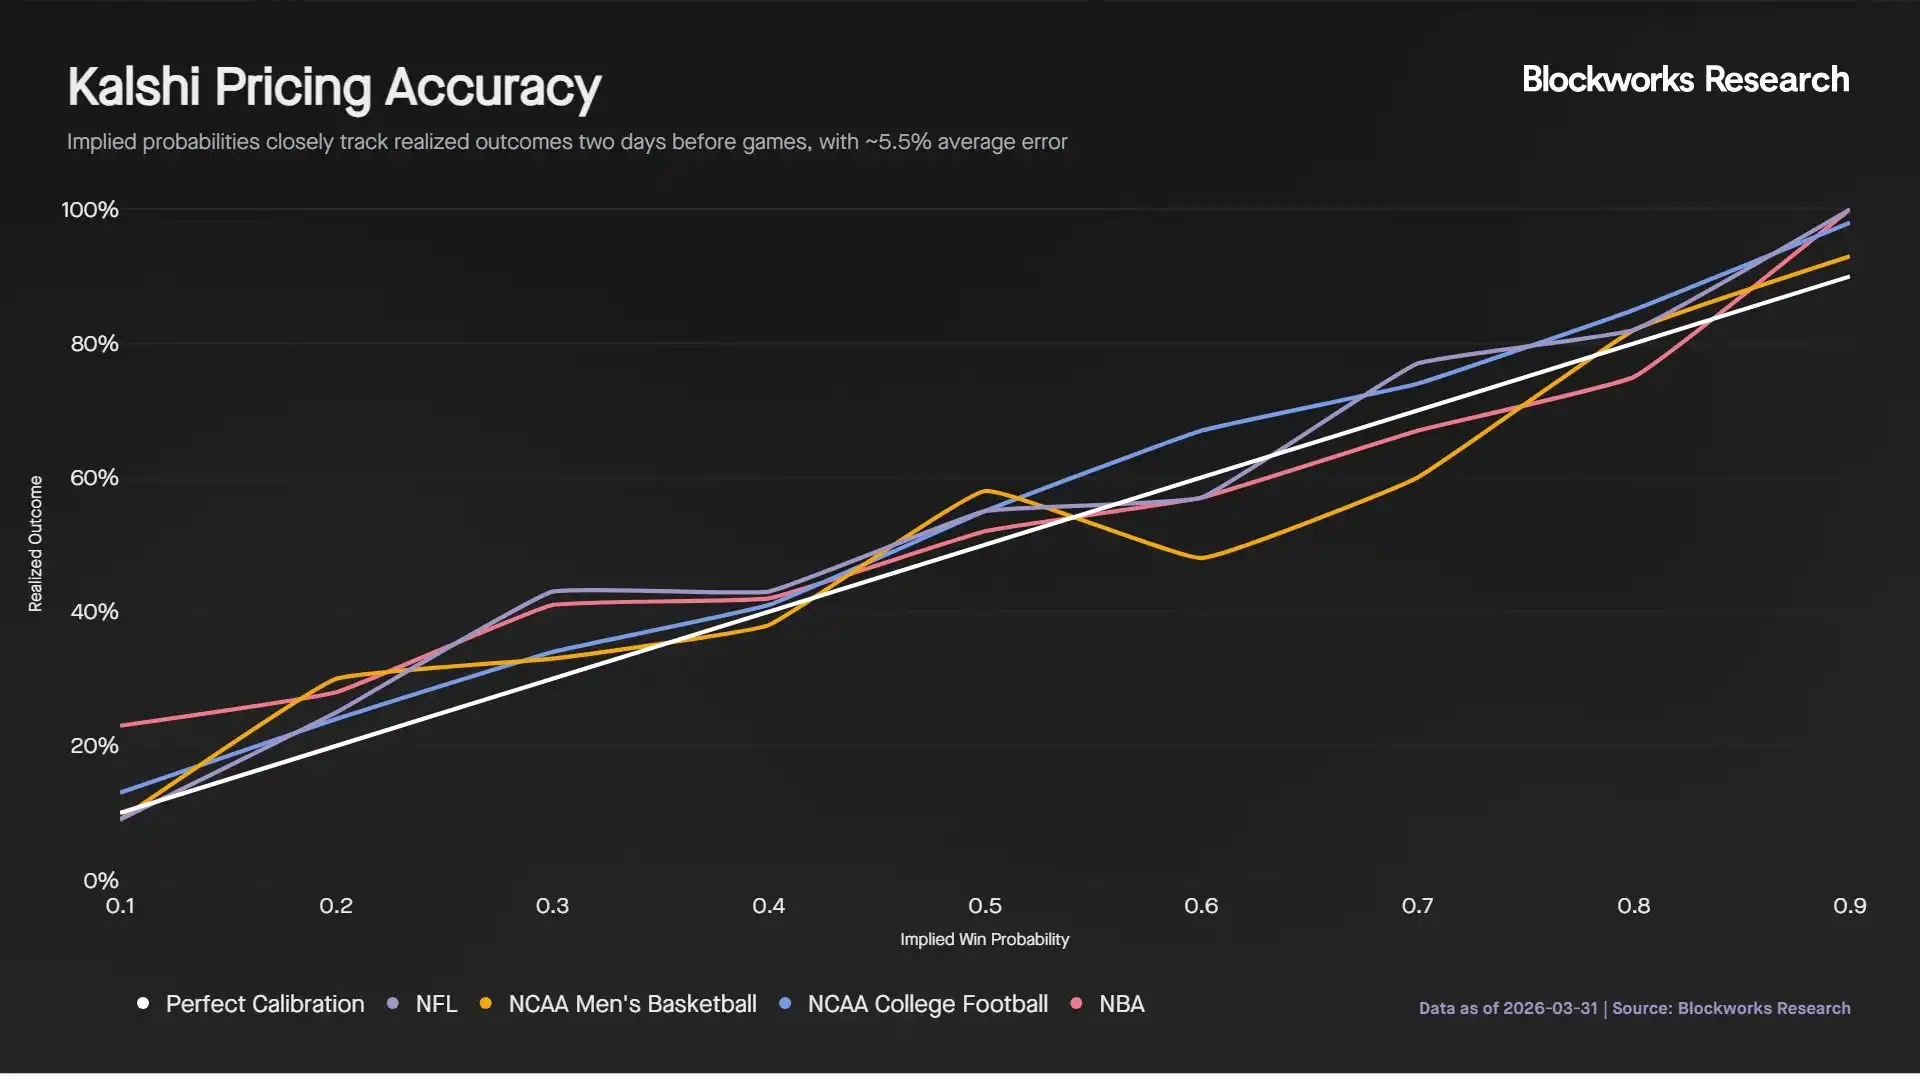
Kalshi prices two days before a game are a strong predictor of the outcome. On average, the implied probability deviates from the actual result by 5.5 percentage points. Among the four leagues analyzed, NCAA college football had the highest predictive accuracy.
This indicates that pre-game odds are a powerful indicator of final outcomes. Kalshi prices are not only reactive but also incorporate significant information before the game starts. This accuracy likely reflects the presence of informed and model-driven traders who actively price probabilities based on available data. Consequently, market prices begin converging toward true outcomes well before the game starts, reinforcing prediction markets as effective mechanisms for information aggregation.
Liquidity, Volume Distribution, and Market Maker Behavior
Analyzing how volume is distributed across the sports market cycle is crucial. Volume distribution provides insights into when valuable information enters the market, how price discovery evolves, and who drives the moves. For traders, this highlights when mispricing might occur and when pricing is efficient. For market makers, it informs spread setting, inventory risk management, and the timing of aggressive or passive quoting.
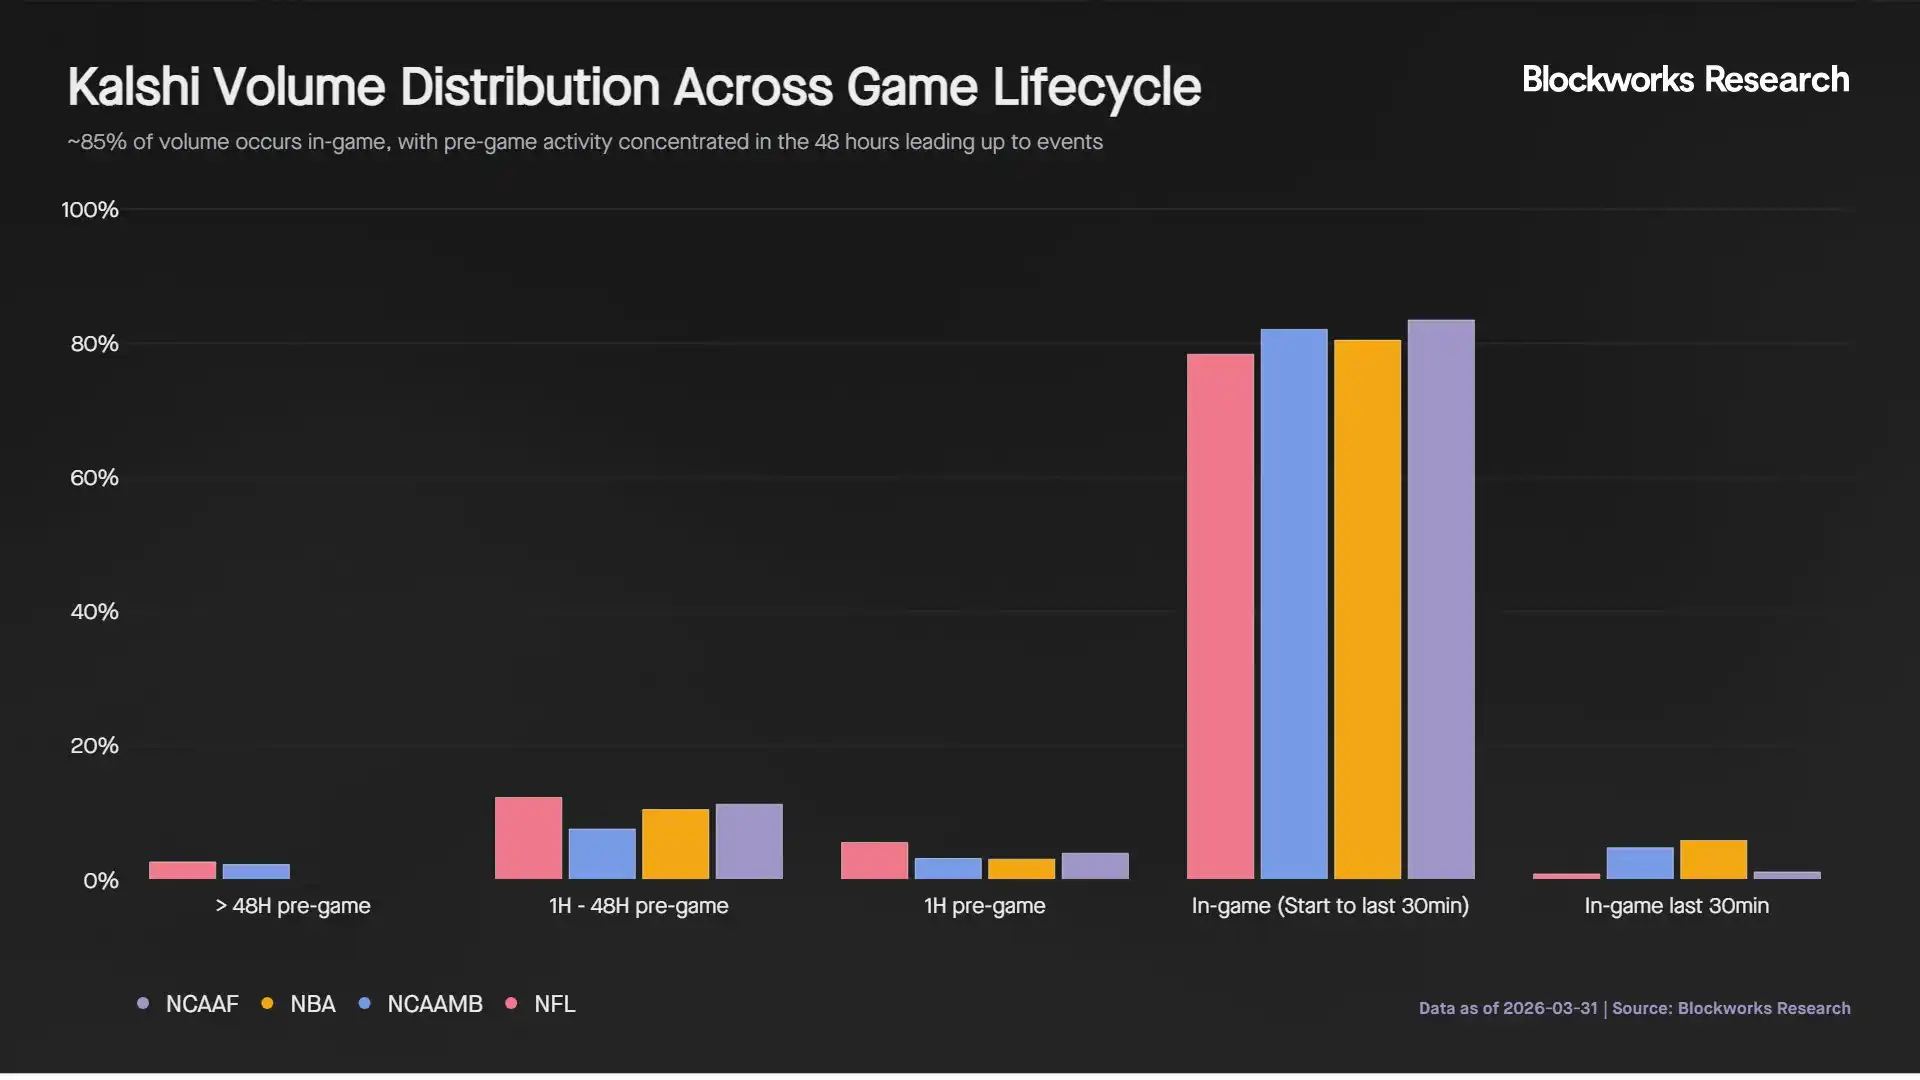
As expected, in-game trading accounts for approximately 85% of total volume, as live events continuously update the probability of each team winning. About 3% of volume occurs in the final 30 minutes, with almost no volume in the last 10 minutes as the outcome becomes certain. The absence of a last-minute volume surge suggests most participants hold their positions until the end rather than actively closing them.
Pre-game trading activity is concentrated in two periods. Volume 1 to 48 hours before the game accounts for 10.4% of total volume, while the final hour pre-game accounts for 4%. Before this, trading activity is minimal, at just 1.3%. This indicates that the market transitions from a low-liquidity, low-information environment to a more active price discovery phase about 48 hours before the game, when informed or model-driven participants begin building positions. The last-minute volume surge likely reflects the integration of final information like lineups and news.
Based on this distribution, we evaluate how market makers adjust their quoting behavior. Depth data became available starting March 25, so the analysis focuses on March Madness games due to the surge in trading volume during this period.
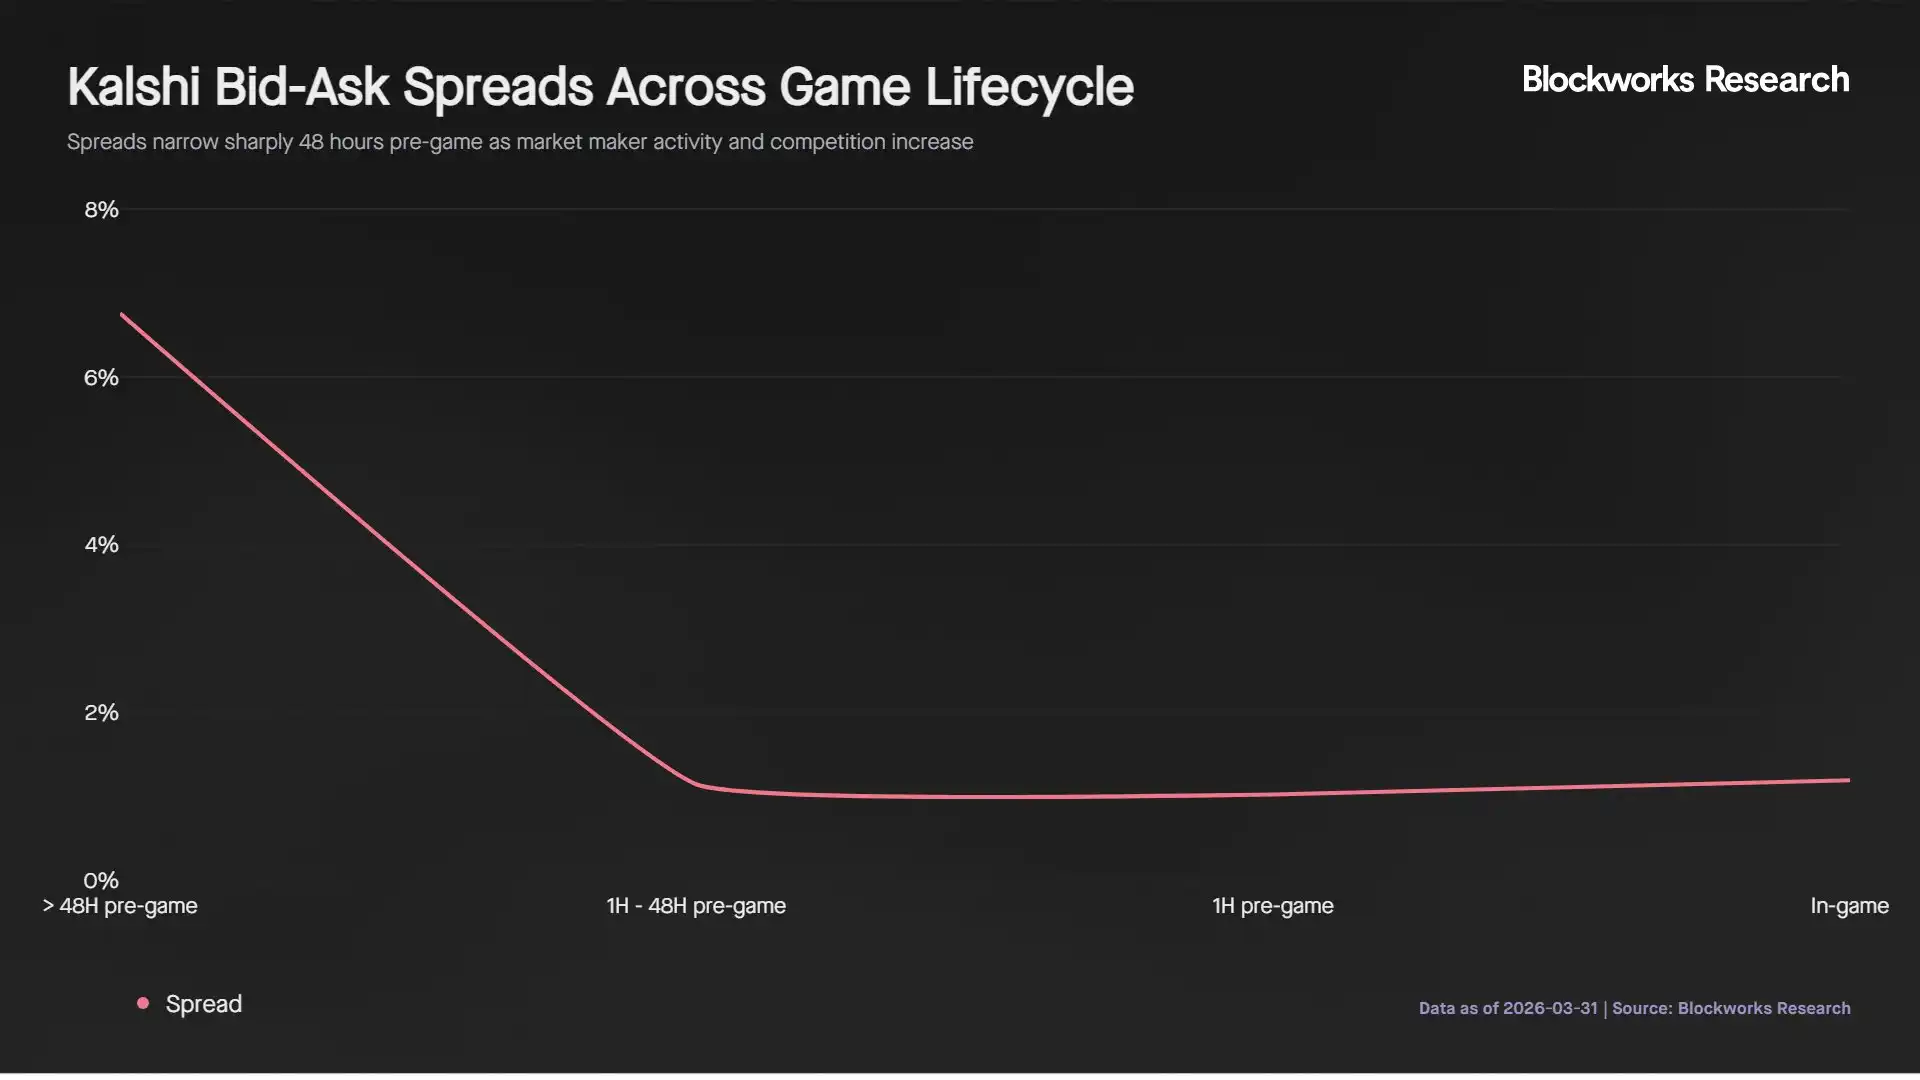
Spreads start wide but tighten to around 1.11% about 48 hours before the game and remain near this 1% lower bound until the game ends. This coincides with the growth in volume, indicating more active and competitive market making during this period.
Market depth increases 19-fold in sync with volume during the 48-hour pre-game window. However, during the game, despite more frequent trading activity, depth decreases by 76%. This suggests market makers reduce their quote sizes while maintaining tight spreads, likely to manage adverse selection risk as probabilities update rapidly during live play.
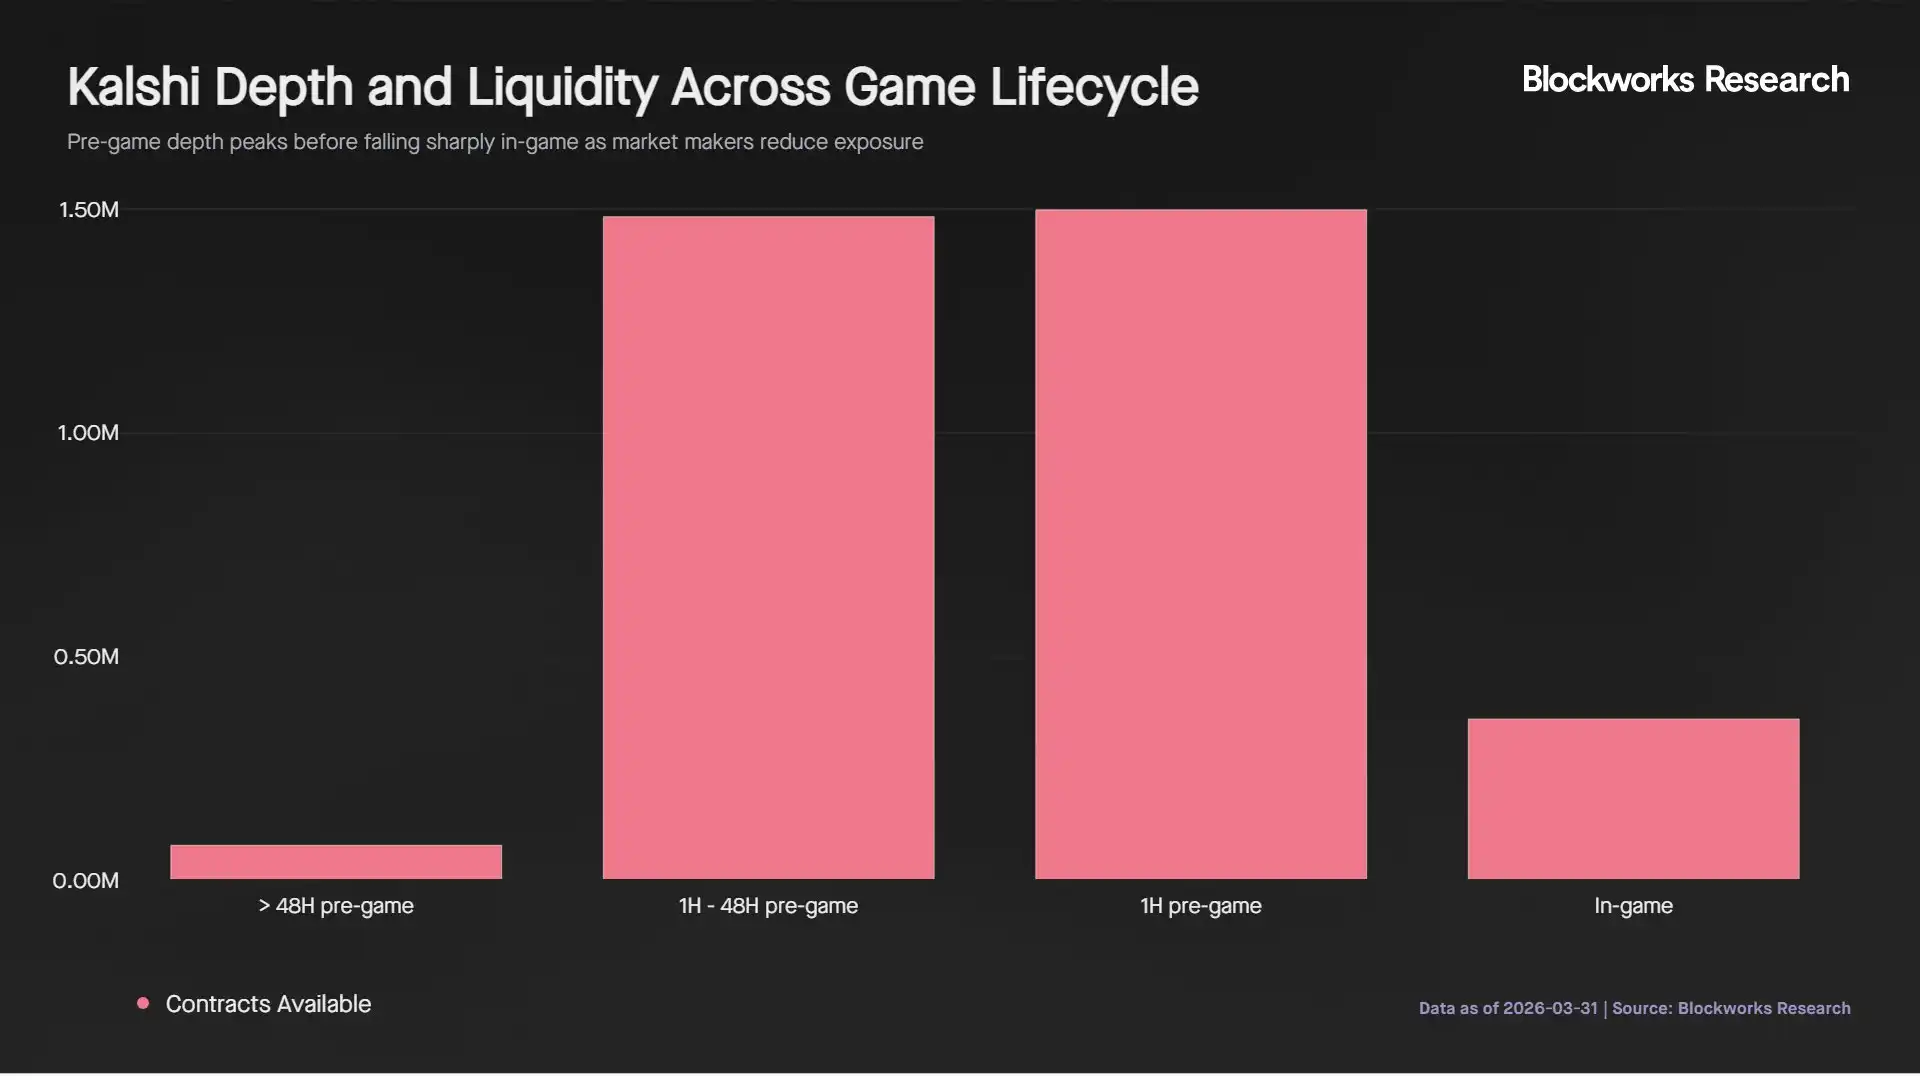
During the game, the average contract depth per market is 163,000 contracts, compared to a pre-game peak of 730,000 contracts. At a typical price near $0.50, this implies about $4,100 of executable liquidity per side at the touch. This is sufficient for small retail trades but becomes a constraint for larger institutional orders.
For institutional participants deploying $5,000 or more per position, execution capacity is limited during the game, as orders would either move the price or need to be spread across multiple markets. Consequently, the optimal execution window for larger traders is the 48-hour to 1-hour pre-game period, when contract depth is over 4 times greater than during the game and spreads remain tight.
Comparison with Traditional Sportsbooks and Arbitrage Dynamics
Prediction market prices must accurately reflect live game conditions to attract sophisticated traders and institutional capital. To evaluate this, we compare real-time odds between Kalshi and FanDuel (a traditional bookmaker) for two high-volume games.
Michigan vs. Arizona, NCAA Tournament
In the 72 hours leading up to the game, predictions on Kalshi and FanDuel were very close, with Arizona's implied win probability around 48% on both platforms. About 18 hours before tip-off, FanDuel adjusted Arizona's probability closer to 50%, and Kalshi followed suit about 7 hours later. The average pre-game difference was 0.54%, indicating high consistency in pre-game predictions.
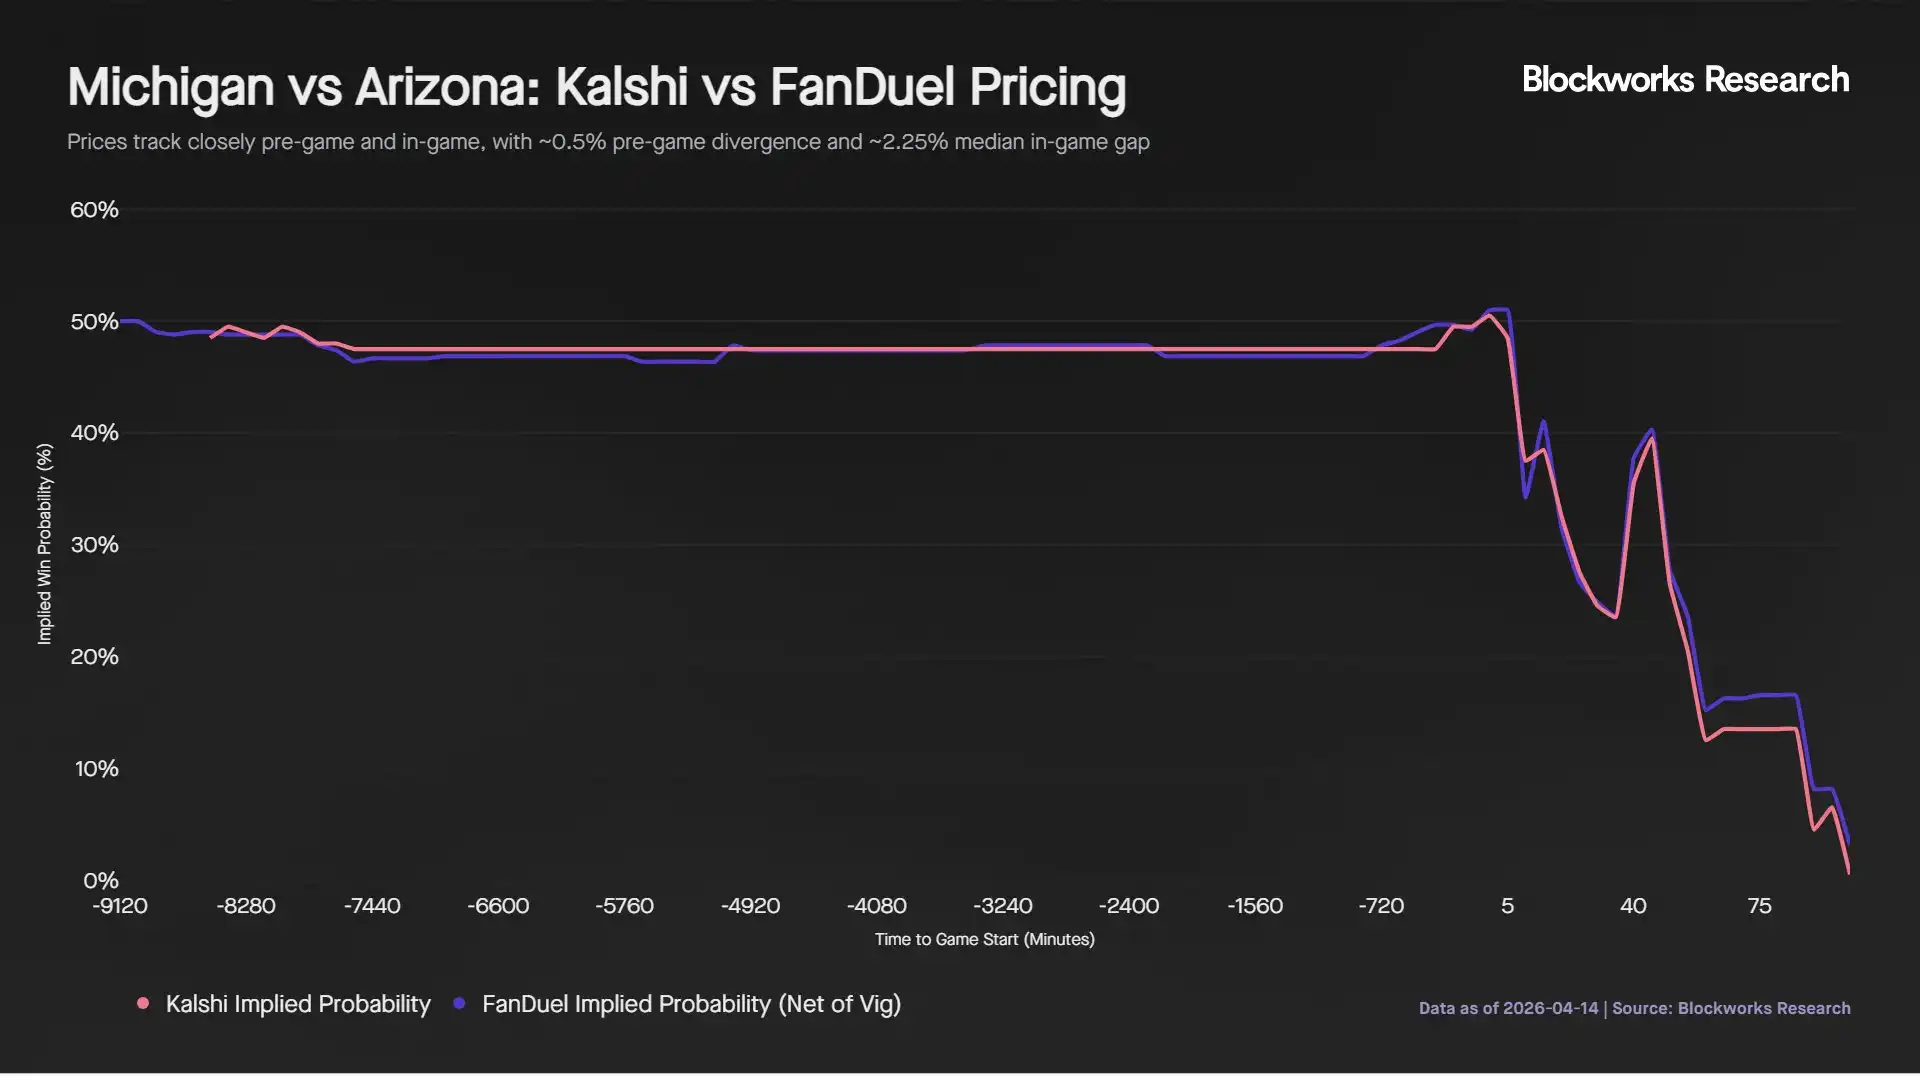
Once the game started, prices moved almost in lockstep, with a correlation of 0.9962. This suggests no significant lead or lag between the two within 5-minute intervals. However, a persistent pricing gap emerged, with a median in-game difference of 2.25%.
This difference stems primarily from structural differences between the platforms. FanDuel builds in a vig of approximately 4.5%, equating to about 2.25% per side. On Kalshi, contracts trade in 1% increments with a minimum spread of 1%. The effective cost for the taker in an arbitrage trade is about 0.5% to cross the spread, making the total trading friction approximately 2.75%. Thus, traders must overcome these combined costs for an arbitrage opportunity to be profitable.
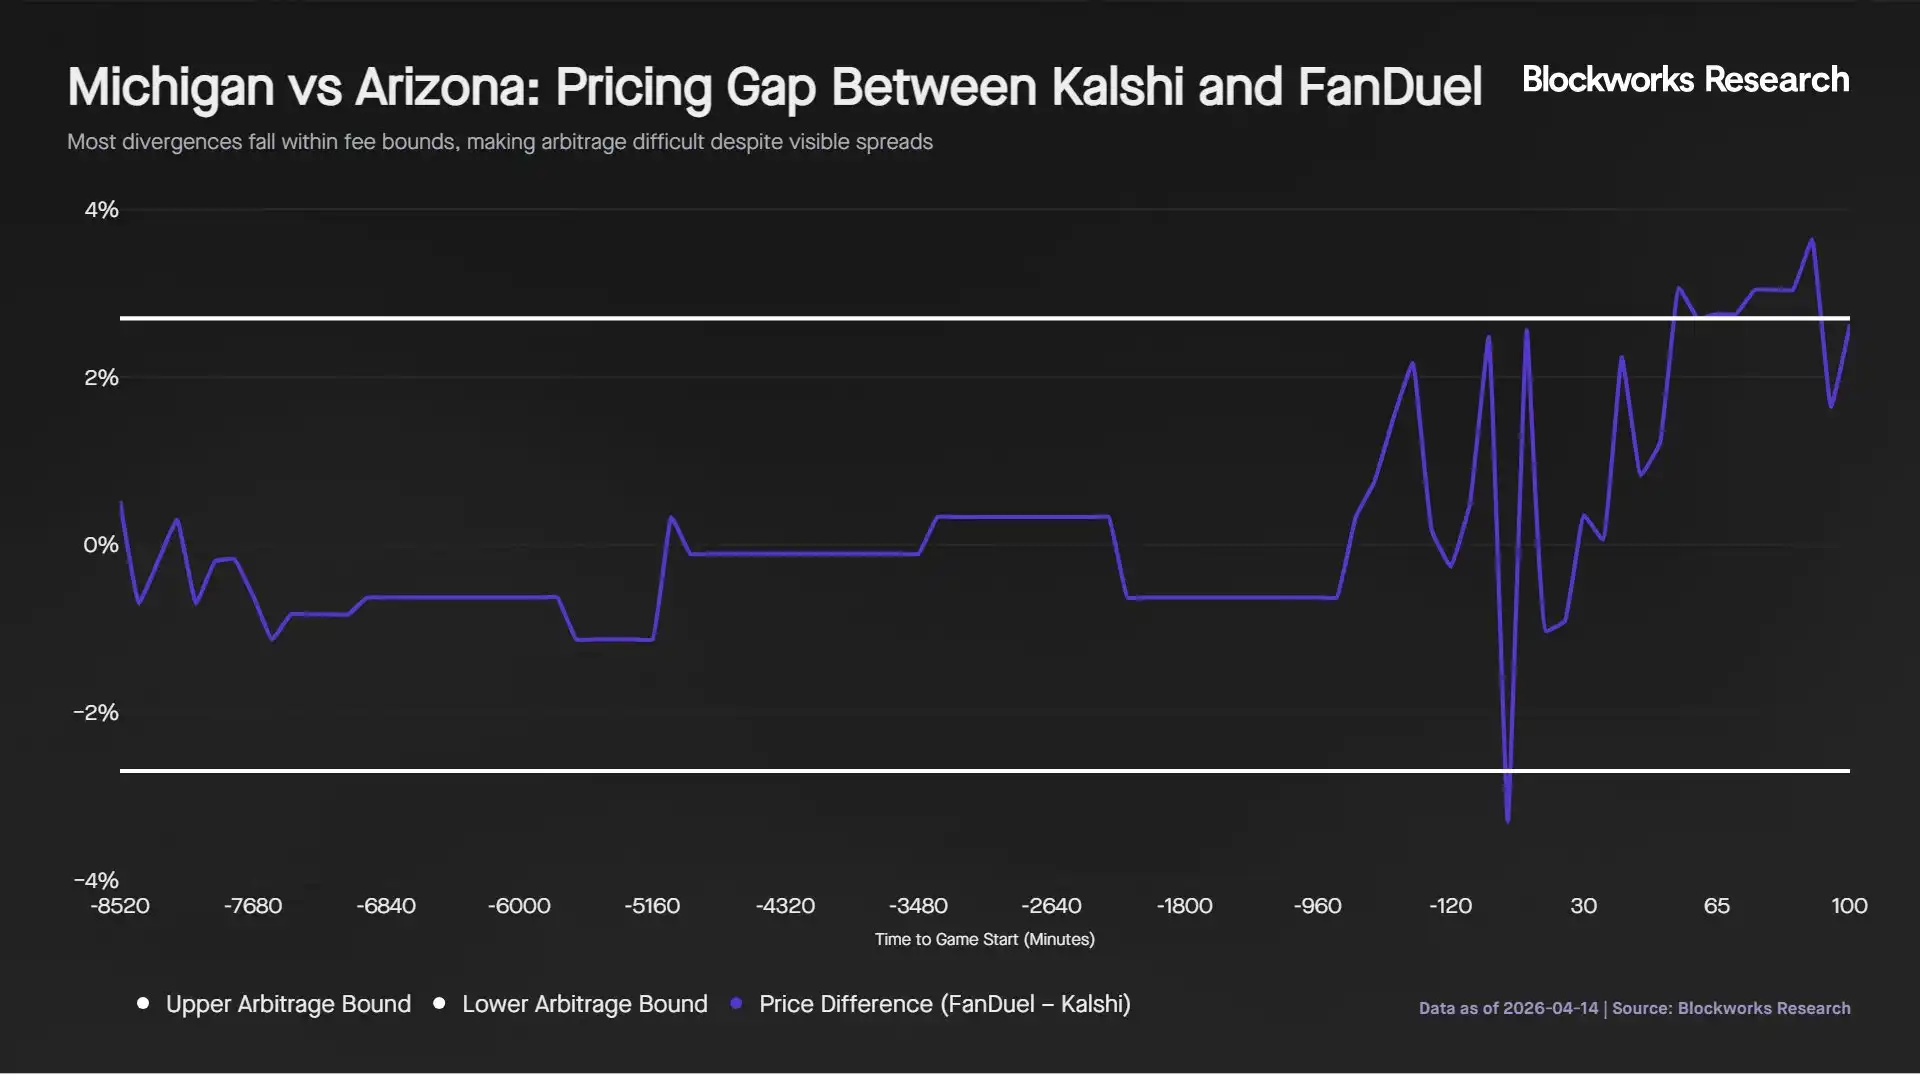
In practice, the price differential only marginally covers these costs. The median price difference during the game was 2.59%, with 8 out of 20 five-minute intervals (40%) exceeding the cost threshold. Although the differential reached 3.64% in the second half as FanDuel was slower to reprice Michigan's expanding lead, these opportunities were not sustained long enough to support a reliable arbitrage strategy. Furthermore, insufficient in-game liquidity on Kalshi further limited the effective size for arbitrage.
Notably, the price differential in the second half was directional, with FanDuel consistently pricing Arizona higher than Kalshi as Michigan extended its lead. This suggests Kalshi incorporates in-game information more quickly during periods of strong momentum.
Buffalo Bills vs. Denver Broncos, NFL Playoffs
Pre-game pricing did not immediately converge. Five days before kickoff, the platforms differed by 5.7%, with FanDuel showing a 53.7% win probability for Buffalo versus Kalshi's 48%. Over the next week, both platforms gradually adjusted their forecasts, with neither consistently leading. By kickoff, both platforms converged near a 48% probability for Buffalo. The average pre-game difference was 1.40%, more than double that of the NCAAB example, indicating weaker early consensus.
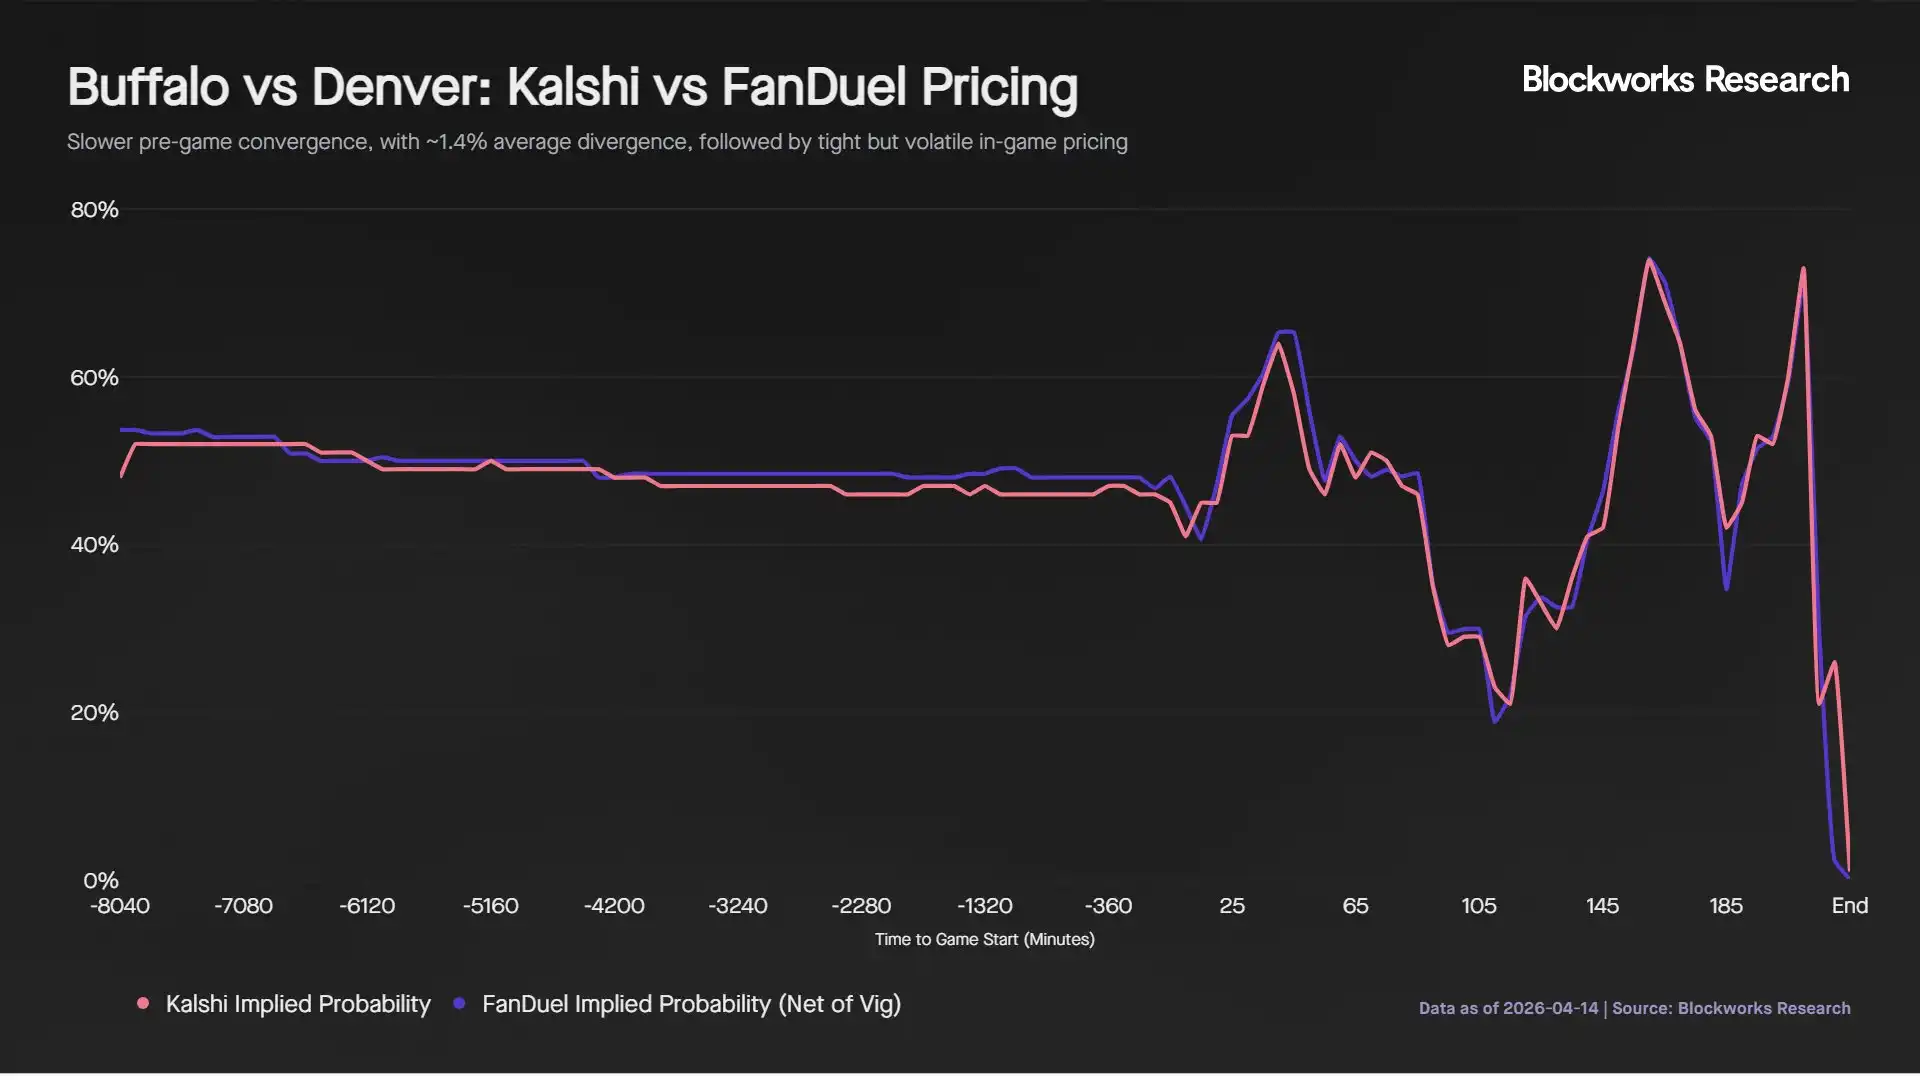
Once the game began, prices again moved closely together, with a correlation of 0.9738. The game was exceptionally close, featuring multiple lead changes and large swings in win probability, including Buffalo reaching a 74% probability late in overtime before Denver ultimately won.
The median difference during the game was 1.61%, with an average of 2.40%. Unlike the NCAAB example, the gap direction showed no clear pattern, with the platforms alternating in leading and lagging throughout the game.
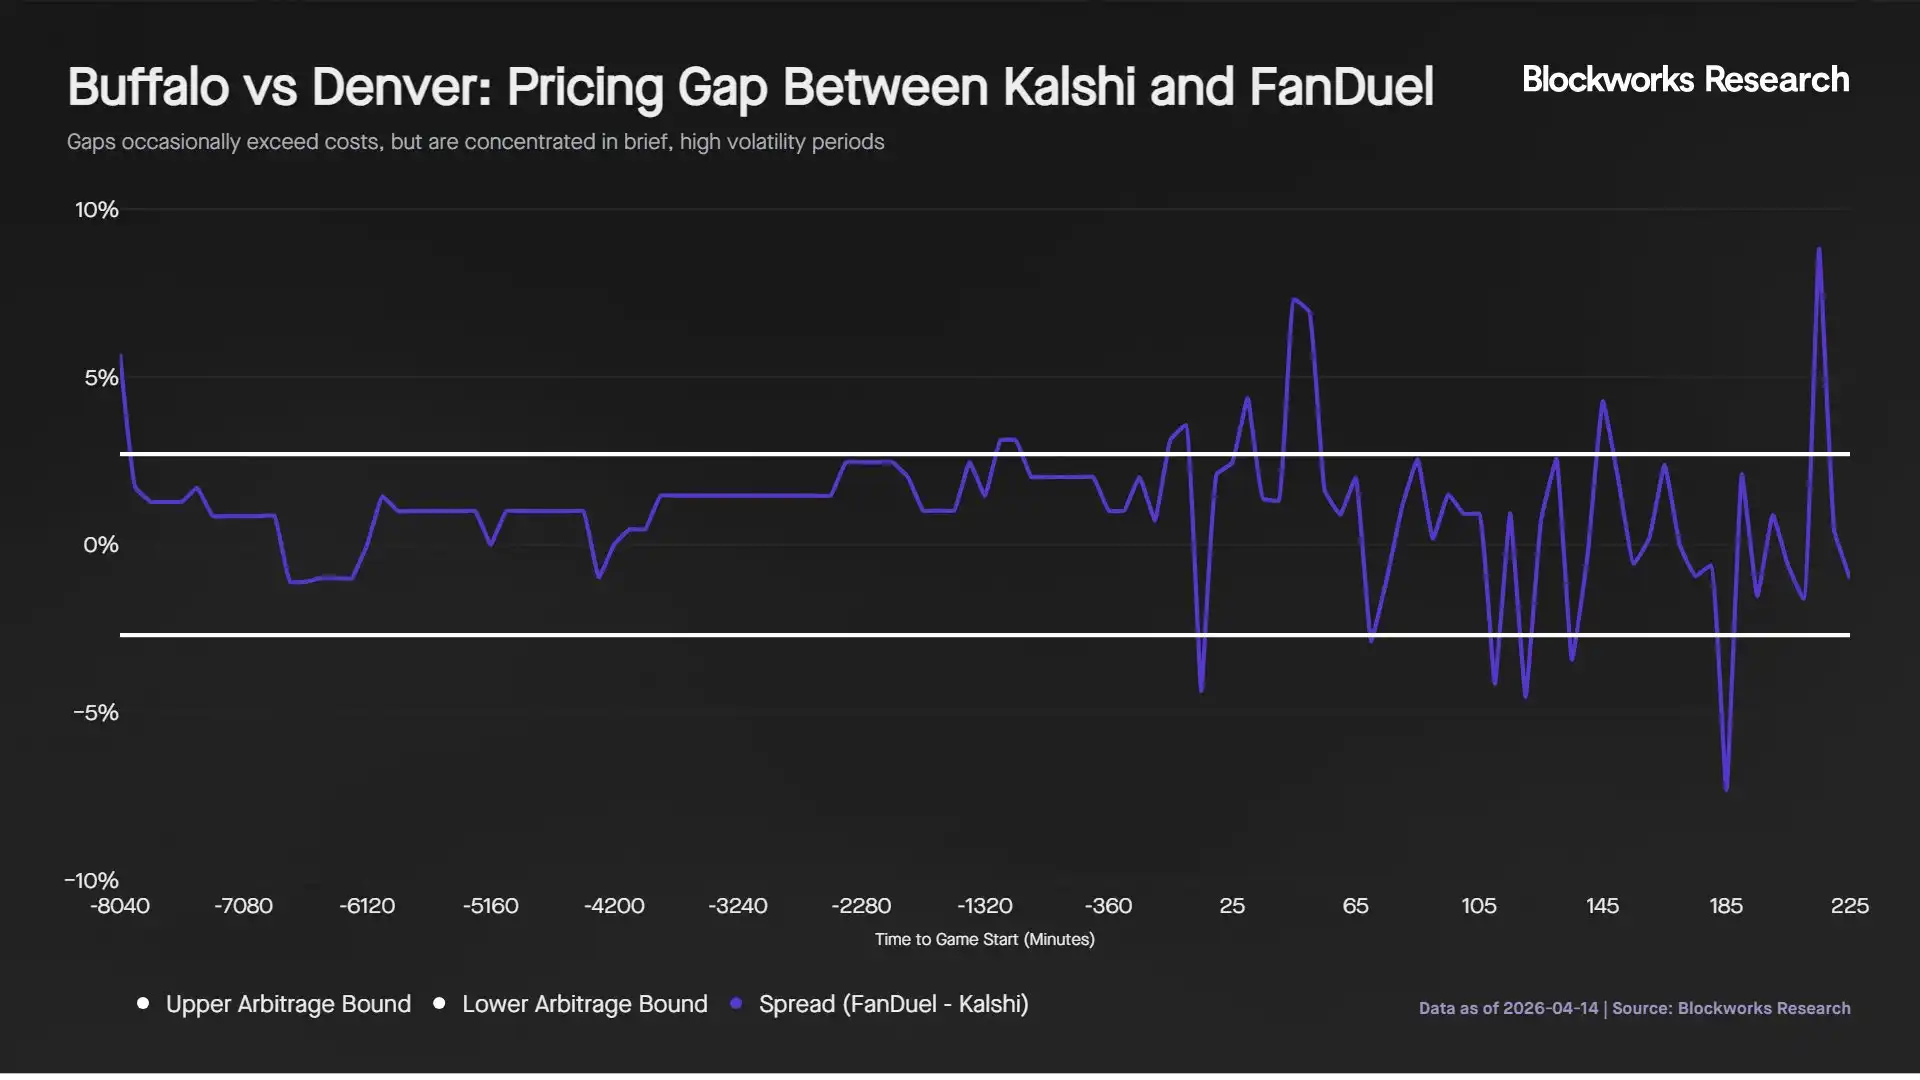
With the 2.75% cost threshold, 13 out of 45 five-minute intervals (29%) showed spreads wide enough to trade. These opportunities clustered around periods of high volatility, with the spread peaking at 8.8%, but were short-lived. Similar to the NCAAB example, limited in-game liquidity on Kalshi constrained effective trade sizes, reducing the practical feasibility of arbitrage.
What This Means for Market Participants
Kalshi's odds are closely correlated with traditional sportsbooks, with both platforms incorporating in-game information nearly in real-time. The consistency between pre-game and in-game odds is high, albeit with some subtle but persistent differences. This highlights the strength of Kalshi's markets in information aggregation and generating accurate probabilities.
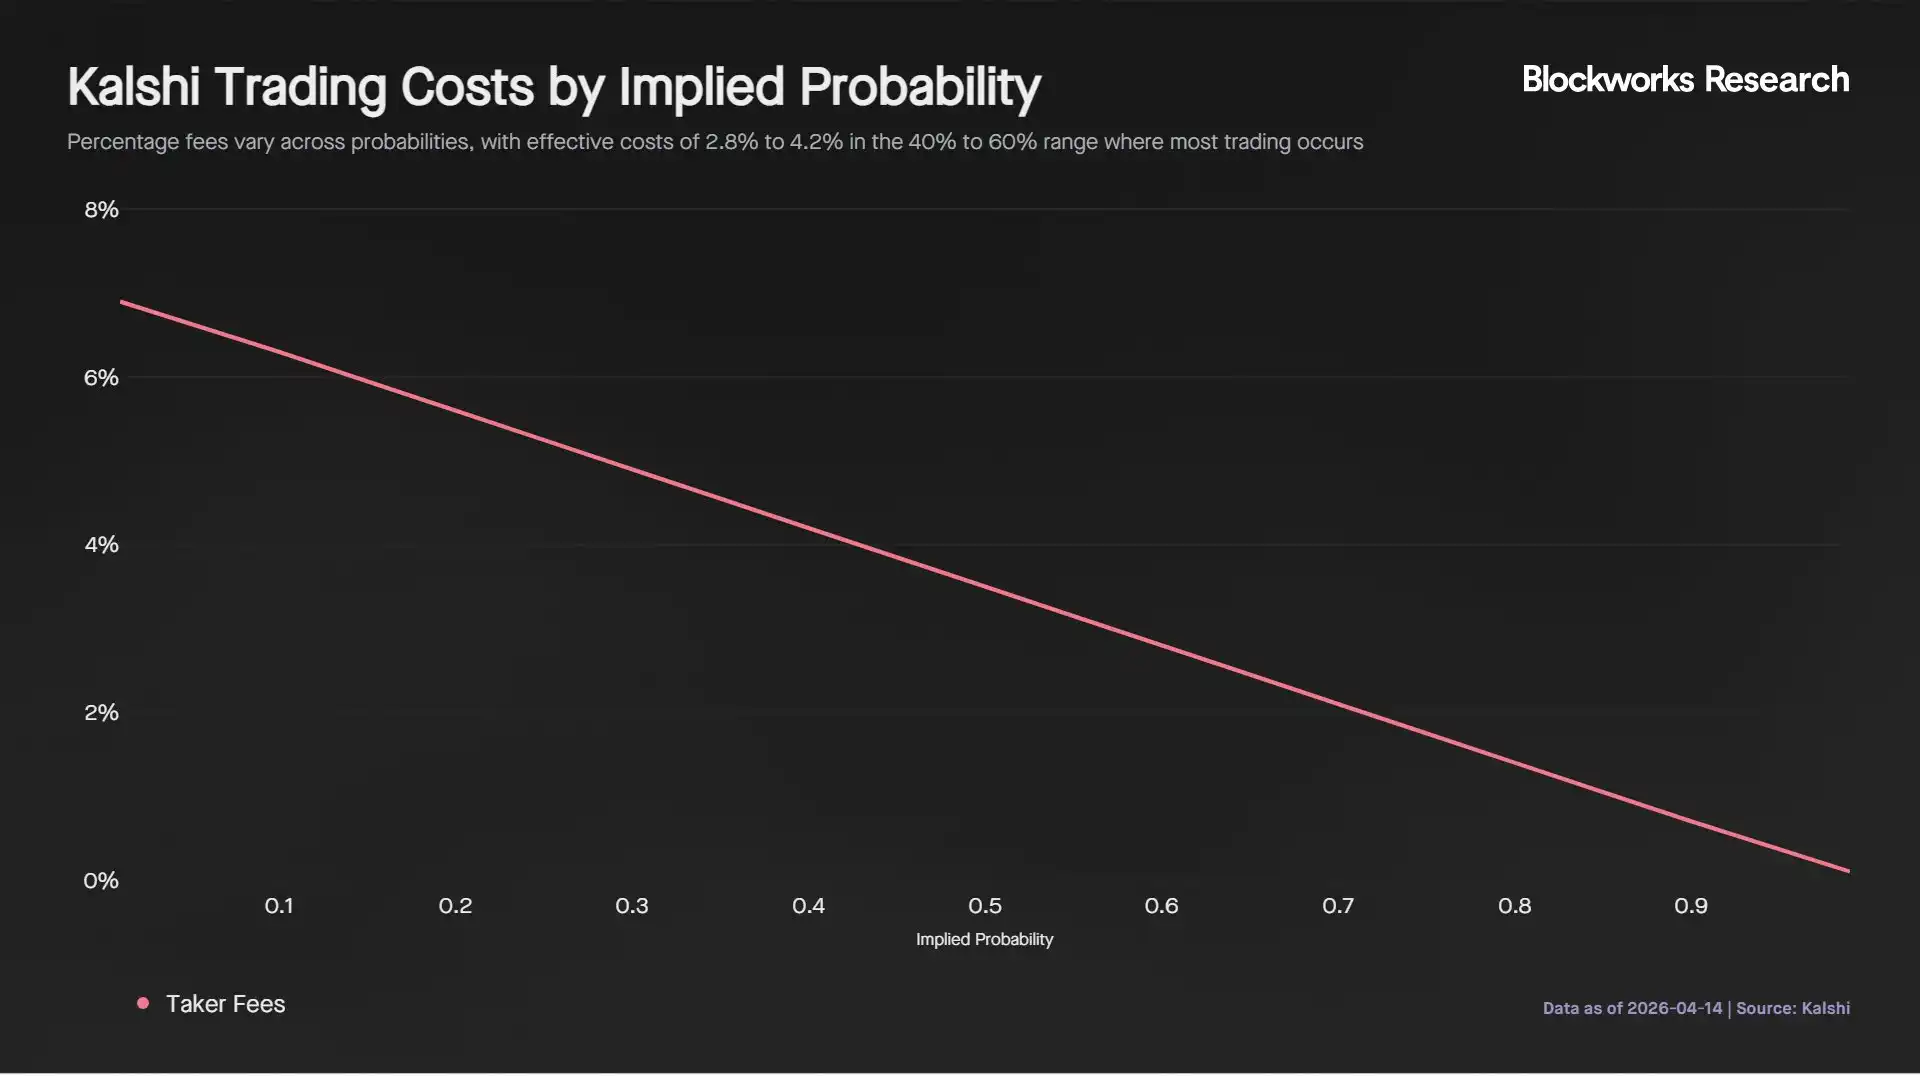
FanDuel's odds are net of commission, which equates to an entry cost of roughly 2% per side. On Kalshi, fees vary based on contract probability, peaking in absolute terms around 50% probability, costing a taker about 3.50% and a maker about 0.88%. Since most in-game trading occurs between 40% and 60% probability, the effective trading cost on Kalshi ranges from 2.8% to 4.2%, making it comparable to, and in certain cases higher than, traditional sportsbooks, particularly for takers.
These higher costs, combined with thinner in-game liquidity, mean larger, more sophisticated bettors will likely continue preferring traditional books, where pricing can often be negotiated and large trades executed more efficiently. To be more competitive, Kalshi needs to lower fees and enhance liquidity incentives, especially during in-game trading when activity is high but depth declines.
However, these limitations may improve over time. Increasing competition from platforms like Polymarket should drive changes in fee structures and liquidity incentives. In the sports betting market, Polymarket charges a 0.03 taker fee, lower than Kalshi's 0.07, while offering zero fees and a 25% fee rebate for makers. Additionally, Polymarket announced a $5 million sports liquidity incentive program starting April 2026, aimed at encouraging tighter quotes and deeper order books.
While Kalshi also offers liquidity incentive programs, its base fee structure remains higher. As competition between platforms intensifies, it should drive fee compression and improve liquidity conditions across the market.
This, in turn, creates a virtuous cycle. Improved liquidity attracts more traders, increased volume attracts more market makers, and heightened market making activity further deepens liquidity, enhancing execution quality.
Over time, as market depth improves and execution becomes more efficient, expect greater participation from sophisticated capital, including sports-focused hedge funds and reinsurance-like participants. Early signs of this trend are emerging, with Kalshi expanding into reinsurance market through partnerships with firms like Game Point Capital.
Beyond trading, the probability data on Kalshi is also beginning to show informational value. In sports markets, clubs, agents, or reinsurers could use market-implied probabilities to hedge contractual risks, such as performance bonuses tied to player or team outcomes.
Kalshi's Structural Advantages
Despite similar pricing mechanics to traditional sportsbooks and sometimes higher trading costs, Kalshi has achieved rapid expansion based on several structural advantages it holds over traditional sportsbooks.
First, prediction markets operate on a P2P model where traders transact with each other, rather than betting against a house with a built-in edge. This structure allows Kalshi to be regulated by the U.S. Commodity Futures Trading Commission (CFTC) as a designated contract market, enabling it to operate in all 50 states. In contrast, major U.S. sportsbooks like DraftKings and FanDuel are only available in select states, while platforms like Pinnacle and Betfair remain inaccessible in the U.S., giving Kalshi a broader potential market.
Second, traditional sportsbooks limit bet sizes for winning users, capping the amount profitable bettors can wager. These limits are often dynamic, and winning users may face reduced betting limits or restricted accounts. This creates a structural ceiling on profitability. Kalshi imposes no such limits and instead benefits from the participation of more sophisticated traders, who help improve price accuracy and overall market efficiency.
Third, Kalshi's interface presents outcomes directly as probabilities rather than odds, making pricing more intuitive and easier to understand. This aligns more closely with how institutional participants assess expected value and risk. Additionally, Kalshi supports continuous trading, allowing users to dynamically build and close positions throughout the entire game cycle. While sportsbook websites may offer early cash-out features, these are not universally available and often become restricted during critical moments.
That said, Kalshi's liquidity is not consistently stable throughout the entire game. Based on conversations with market makers, liquidity can drop during key moments (e.g., shots or crucial actions), with some liquidity providers temporarily pulling quotes while awaiting settlement. However, users can still close positions during these periods, albeit with potential execution slippage.
Valuation Assessment
Given the above, the key question is how Kalshi's valuation compares to traditional sportsbook operators.
Using Kalshi's fee calculation: 0.07 × number of shares × price × (1 − price), we estimate the revenue it generates across its markets. This formula excludes certain fee-free markets, differences in market maker fees, etc. It also excludes volume traded through partners like Robinhood, which requires revenue sharing.
Based on this, Kalshi's revenue over the past year was approximately $263 million, with a projected $1.3 billion for 2026, representing a 24% average monthly growth rate. An estimated 80% to 90% of this revenue comes from sports betting markets. Based on its last funding round valuation of $22 billion, this implies a forward price-to-sales (P/S) ratio of about 16.9x for 2026.
In comparison, traditional sportsbook operators like DraftKings (DKNG) and Flutter Entertainment (FLUT) have significantly higher absolute revenues, projected to reach $6.1 billion and $16.4 billion in 2025, respectively.
Nonetheless, their market capitalizations are $11 billion and $17.9 billion, respectively, implying significantly lower valuation multiples. Historically, these companies have traded at P/S ratios typically between 2x and 4x.
The valuation gap reflects a difference in how the market perceives Kalshi. While its basic utility is similar—wagering based on analysis of event outcomes—Kalshi is valued more like an exchange than a sportsbook. This is driven by its P2P trading structure, CFTC regulation in the U.S., and its ability to expand into areas like cryptocurrencies, macroeconomics, and political markets. These factors imply a larger total addressable market and higher long-term growth potential.
Kalshi's growth prospects further support its premium. Although DraftKings and Flutter continue to grow revenue, their growth rates have slowed significantly in recent years. In contrast, Kalshi's growth is explosive, with monthly growth rates exceeding the annual growth rates of these traditional operators.
The valuation differential across the industry also reflects broader market dynamics. Betting operators tend to have lower multiples due to regulatory risks, taxes, and margin pressures. In contrast, exchanges like Coinbase and Robinhood command higher multiples, suggesting investors are valuing Kalshi similarly.
This market positioning aligns with its structure, where participants trade amongst themselves rather than against the house. However, risks exist. Traditional sportsbooks are actively exploring entry into prediction markets, which could erode Kalshi's early lead. Recent regulatory pushback from these operators may reflect attempts to delay competition while building their own products.
Furthermore, a significant portion of Kalshi's volume is estimated to come from distribution partners like Robinhood. Ownership of the end-user is a key long-term value driver, and any move by partners to launch competing products could impact Kalshi's growth trajectory.
Conclusion
Kalshi has emerged as a leading sports prediction market platform, with prices that closely track live action and gradually converge toward true probabilities before events begin. This pricing accuracy and informational efficiency make it a reliable alternative to traditional sportsbooks.
While currently elevated fees and limited in-game liquidity constrain trade execution, particularly for larger sizes, these issues are expected to improve as competition drives down fees and enhances liquidity incentives. As market depth increases, higher volume, tighter spreads, and more active market making will create a virtuous cycle, further enhancing market quality.
Sports are the primary driver of volume and user engagement, and Kalshi's exchange-like structure and ability to attract participants provide a strong foundation for continued growth. Its valuation reflects this market positioning. But maintaining this premium valuation will depend on its ability to effectively scale liquidity and maintain its role as the central hub for sports prediction markets.
Related reading: Polymarket vs Kalshi: Who is the King of Prediction Markets?