Author: Curry, Chaoxiang Research
Synopsis: SpaceX is set to price after market close on June 11 and list on Nasdaq on the 12th under ticker SPCX, with an offering price of $135 per share, a valuation of approximately $1.75 trillion, raising $75 billion, making it the largest IPO in history.
However, historical data from 30 star tech IPOs compiled by Motley Fool shows: the median returns 6 months and 12 months post-listing were both -9%, with a median maximum drawdown of 54% in the first year, and none escaped unscathed. Morningstar's fair value estimate is only about $780 billion, less than half the offering valuation.
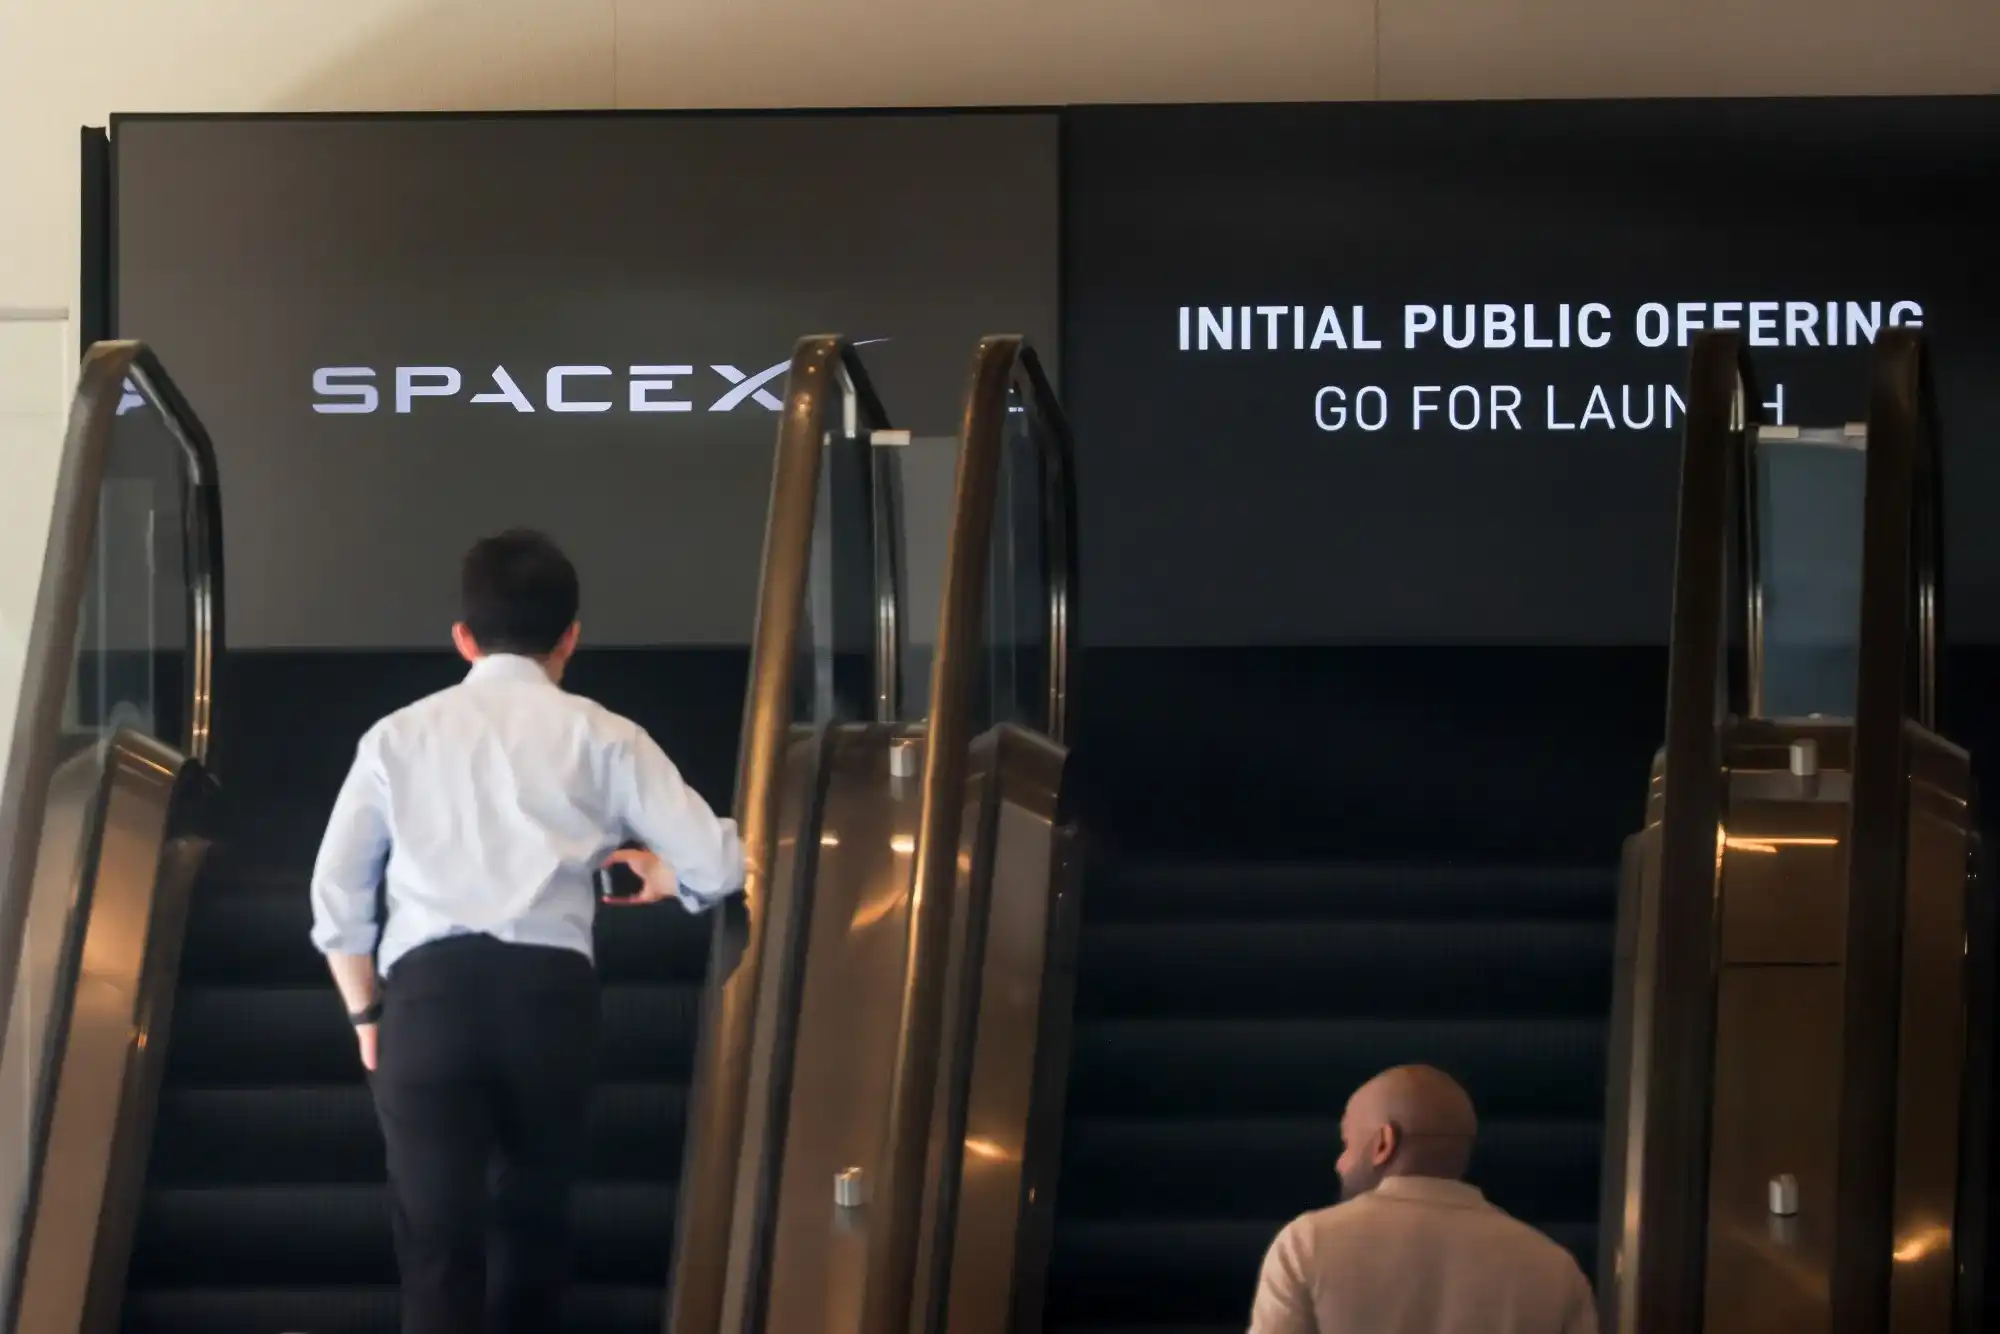
This Friday (June 12), SpaceX will list on Nasdaq under the ticker SPCX. According to a Reuters report on June 3, the offering price was set at $135 per share, issuing about 5.56 billion shares to raise $75 billion, corresponding to a valuation of about $1.75 trillion (some sources calculate it as $1.77 trillion based on post-offering shares). By either measure, this is the largest IPO in stock market history, with Goldman Sachs leading a syndicate of 21 underwriters. The final pricing will be determined after the U.S. market close on June 11.
The hype is undeniable. SpaceX stated in its S-1 filing that the company has "identified the largest executable total addressable market in human history," quantified at $28.5 trillion. The retail allocation was set at about 30% of the float, roughly three times the usual level for large IPOs.
The problem is, for ordinary investors rushing in on the first day, the answer provided by historical data is quite grim.
The Median Ledger: Small Gains in the First Three Months, Collective Losses After Six
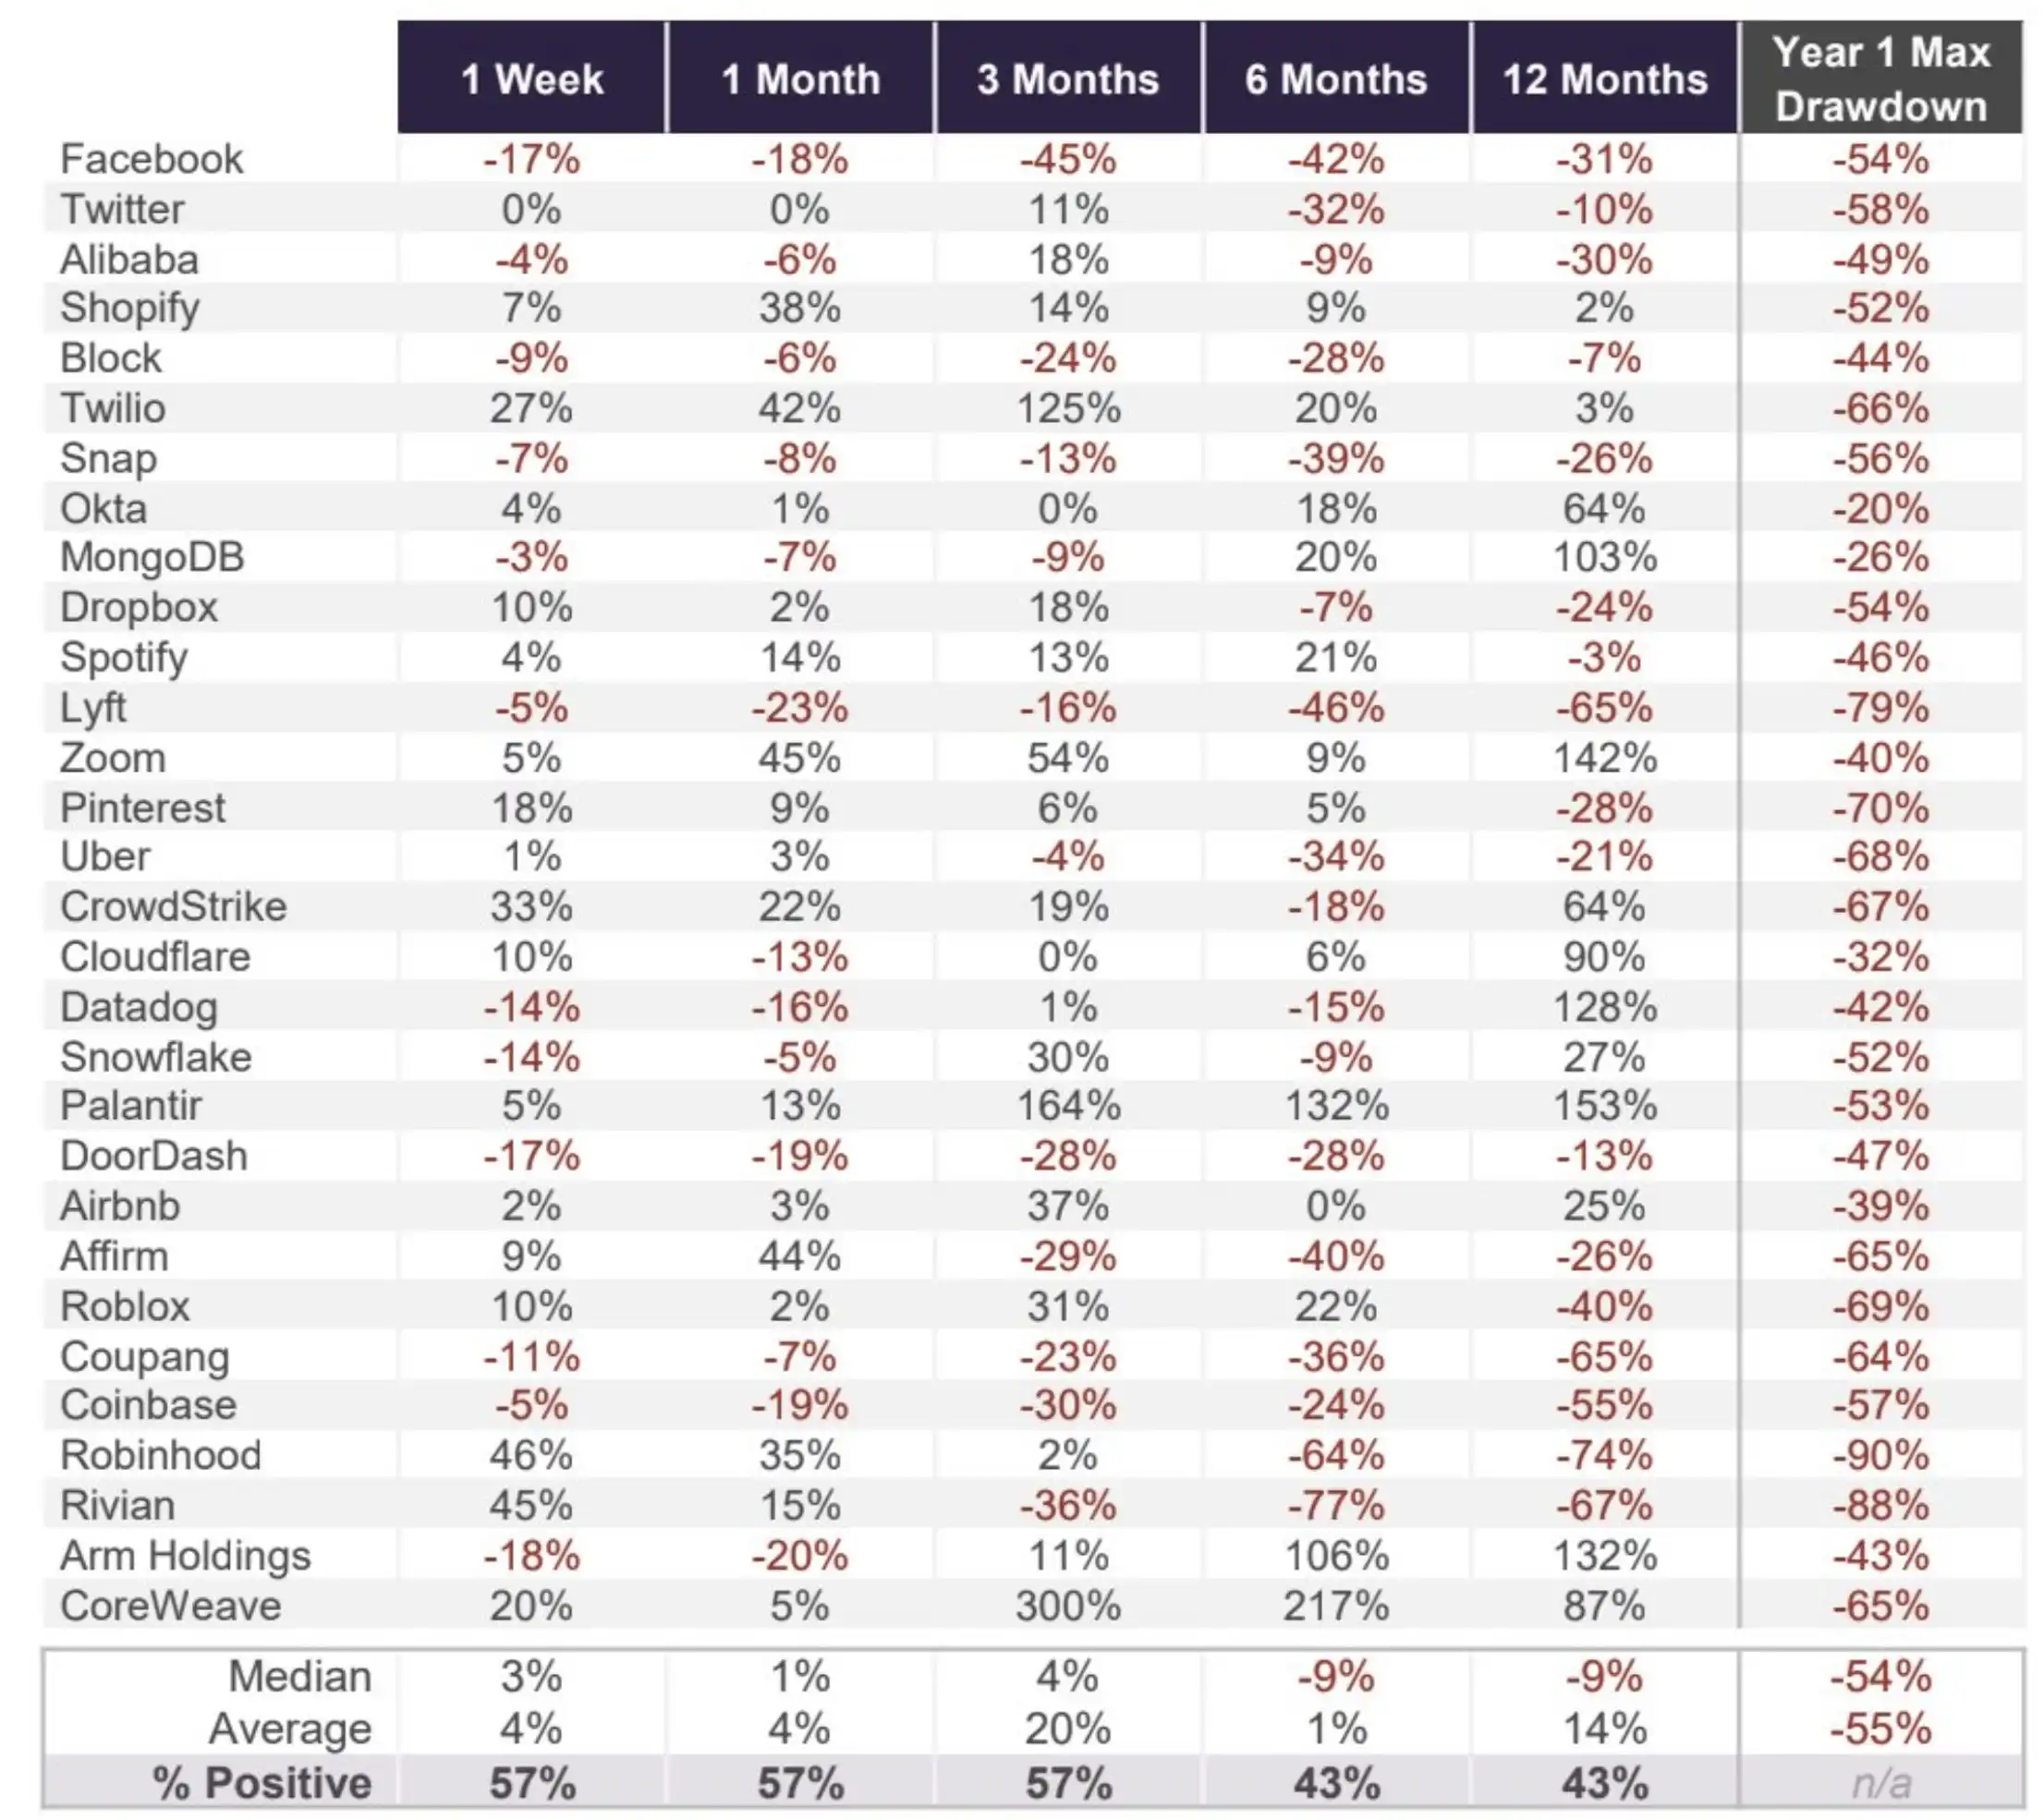
In an article published on June 9, Motley Fool analyst Ryan Vanzo analyzed the post-listing performance of 30 star technology companies since 2012, with a sample ranging from Facebook and Twitter to Coinbase, Robinhood, Rivian, Arm, and CoreWeave.
The shape of the median curve is telling: median returns were +3% after 1 week, +1% after 1 month, and +4% after 3 months—all passable up to this point. But extending to 6 months, the median becomes -9%; at 12 months, it remains -9%. The proportion of companies with positive returns also collapses in sync, dropping from 57% maintained in the first three months to 43% at both the 6-month and 12-month marks. In other words, holding for a full year results in losses for most momentum buyers.
Individual stock divergence is extreme. CoreWeave soared 300% three months after listing, Palantir gained 164% in three months, and Zoom rose 142% in twelve months. But negative cases are equally dense: Lyft fell 65% in twelve months, Robinhood dropped 74%, Rivian fell 67%, and Coupang declined 65%. There is no stable relationship between star power and post-IPO returns.
Median Maximum First-Year Drawdown 54%, Robinhood and Coinbase Both Halved
More striking than returns are the drawdown figures. The median maximum drawdown within the first year of listing for the 30 companies was 54%, with an average of 55%. Okta had the smallest drawdown at 20%, and none avoided it.
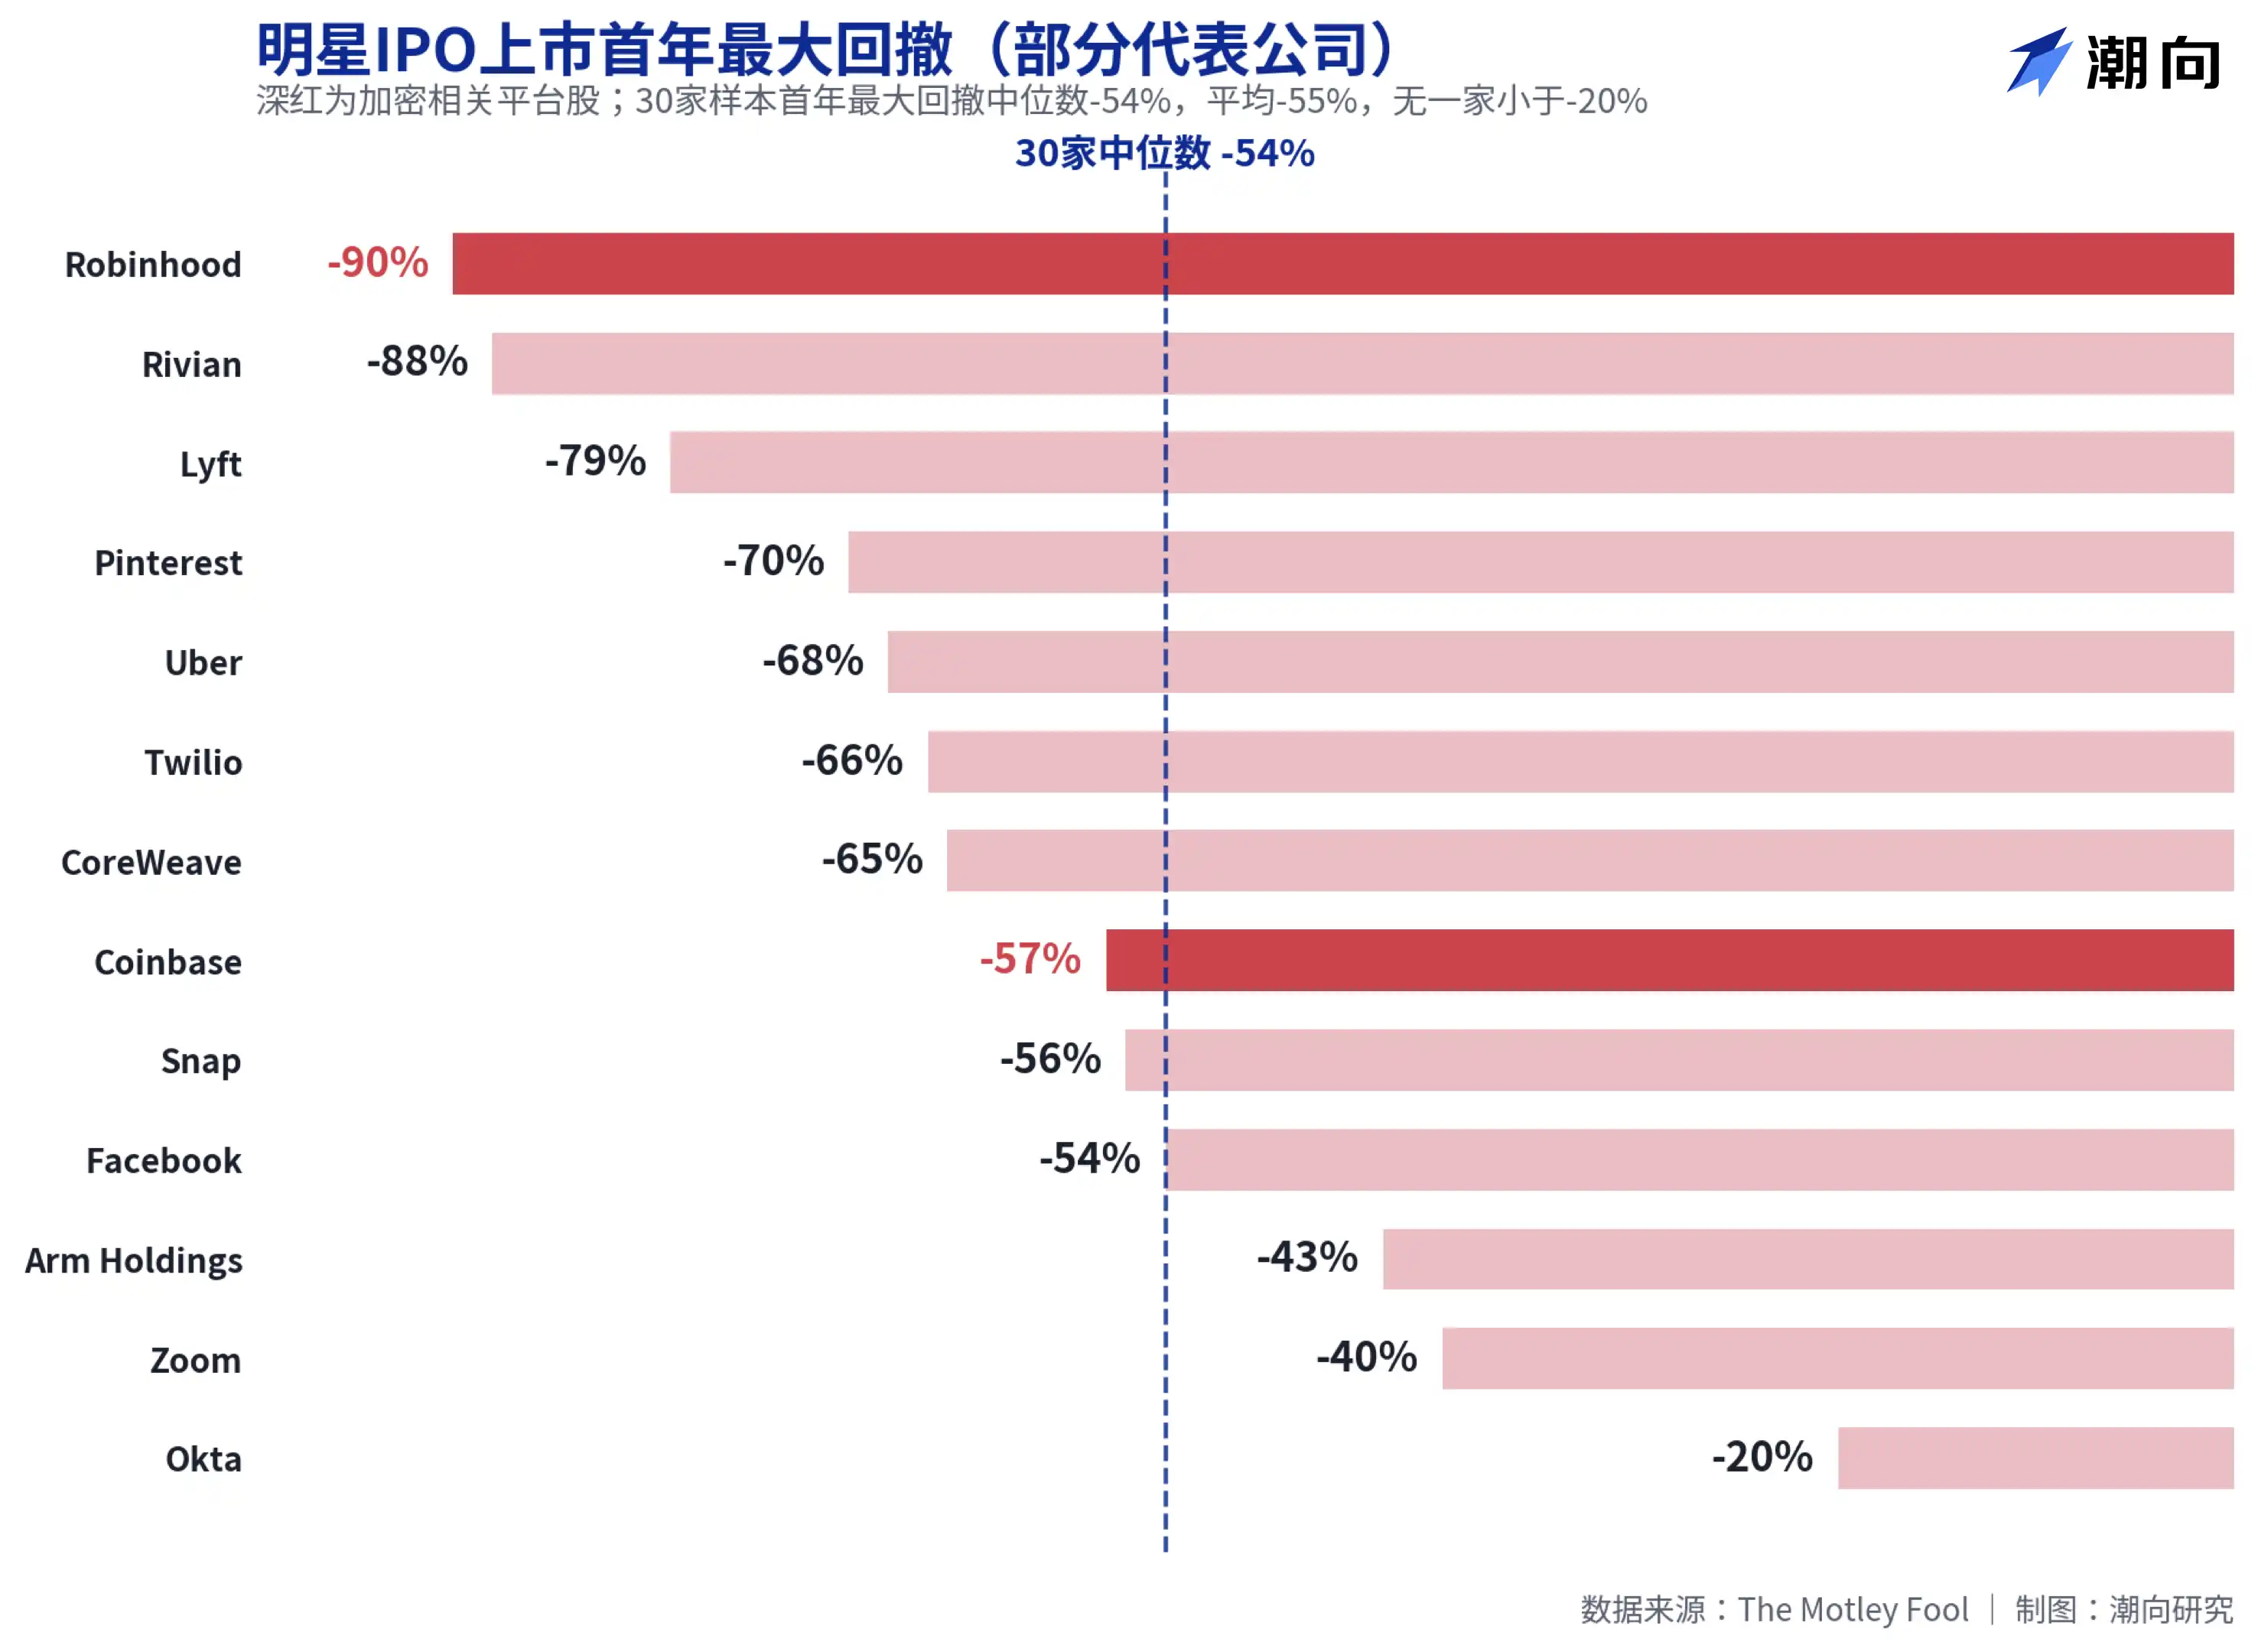
Two platforms familiar to crypto users are in the hardest-hit areas. Robinhood's maximum drawdown in its first year was 90%, the highest among the 30; Coinbase saw a 57% drawdown. Even companies later proven to be big winners were not exempt: CoreWeave had a 65% first-year drawdown, Palantir 53%, and Meta (then Facebook) 54%. This data points to a simple conclusion: even if you pick the right company, buying at the opening price will likely subject you to floating losses at the halving level first.
Academic research paints a similar picture. Jay Ritter, Director of the IPO Research Program at the University of Florida, tracked 1,479 IPOs from 2012 to 2021, finding an average first-day return as high as 23.6%, but the average total return over the subsequent three years was only 10.6%. The Wall Street Journal cited Ritter's data stating that investors who bought on the first day and held for three years underperformed a market-cap-weighted index by about 21%. The excitement of the first day largely borrowed future gains.
SpaceX's Ledger: $18.7 Billion in Revenue Supporting a $1.75 Trillion Valuation
Returning to SpaceX itself, the valuation debate is more concrete than historical patterns.
According to financial data cited by The Motley Fool, SpaceX's 2025 revenue was $18.7 billion, a 33% year-over-year increase, but it reported a net loss of $4.9 billion, reversing a profit of about $790 million in 2024. S-1 data compiled by BitMEX shows a single-quarter net loss of $4.28 billion in Q1 2026, with cumulative losses reaching $41.3 billion, of which the AI business (post-merger with xAI) burns about $2.5 billion per quarter. Calculated at a $1.75 trillion valuation, the price-to-sales ratio exceeds 90 times.
Morningstar's stance is the most direct. Analysts at the firm called SpaceX "severely overvalued," suggesting long-term investors will have opportunities to buy at better margins of safety after the IPO, and set the fair value estimate at approximately $780 billion, less than half the offering valuation. A reference point: SpaceX's over-the-counter tender offer in December 2025 corresponded to a valuation of about $800 billion. In just over half a year, the pricing more than doubled.
Bullish logic also exists. The rocket launch business holds over 80% of the U.S. market share, and Starlink has over 12 million paying subscribers and is profitable, forming the foundation of this valuation. Vanzo's own judgment is that SpaceX's stock will likely perform well on its first trading day, but given the valuation level and historical data, it wouldn't be surprising to see the stock struggle over the next 12 months.
For those preparing to place orders on Friday, this data from 30 companies is at least worth a glance: history doesn't guarantee repetition, but halving in the first year has been the norm for this game over the past fourteen years.