86% Return? How to Use a Bot to 'Earn Passively' on Polymarket

marsbitОпубліковано о 2025-12-30Востаннє оновлено о 2025-12-30

Анотація

This article details the development and backtesting of an automated trading bot for the "BTC 15-minute UP/DOWN" market on Polymarket. The author identified market inefficiencies and automated a manual strategy to exploit them. The bot operates in two modes. In manual mode, users can directly place orders. In auto mode, it runs a two-leg cycle: First, it observes the market for a set time after a round begins. If either the "UP" or "DOWN" side drops by a specified percentage (e.g., 15%) within seconds, it triggers "Leg 1" and buys the crashed side. It then waits for "Leg 2," a hedging trade on the opposite side, which is only executed if the sum of the Leg 1 entry price and the opposite ask price meets a target threshold (e.g., ≤ 0.95). Due to a lack of historical market data from Polymarket's API, the author created a custom backtesting system by recording 6 GB of live price snapshots over four days. A conservative backtest with parameters of a 15% crash threshold and a 0.95 sum target showed an 86% ROI, turning $1,000 into $1,869. An aggressive parameter set resulted in a -50% loss, highlighting the critical role of parameter selection. The author acknowledges significant limitations of the backtesting, including its short data period, failure to model order book depth, partial fills, variable network latency, and the market impact of the bot's own orders. Future improvements include rewriting the bot in Rust for performance, running a dedicated node, and deploying on a ...

A few weeks ago, I decided to build my own Polymarket bot. The full version took me a few weeks to complete.

I was willing to invest this effort because there are indeed inefficiencies on Polymarket. Although there are already some bots exploiting these inefficiencies for profit, it's far from enough. The opportunities in this market still far outnumber the bots.

Bot Construction Logic

The bot's logic is based on a strategy I previously executed manually. To improve efficiency, I automated it. This bot runs on the "BTC 15-minute UP/DOWN" market.
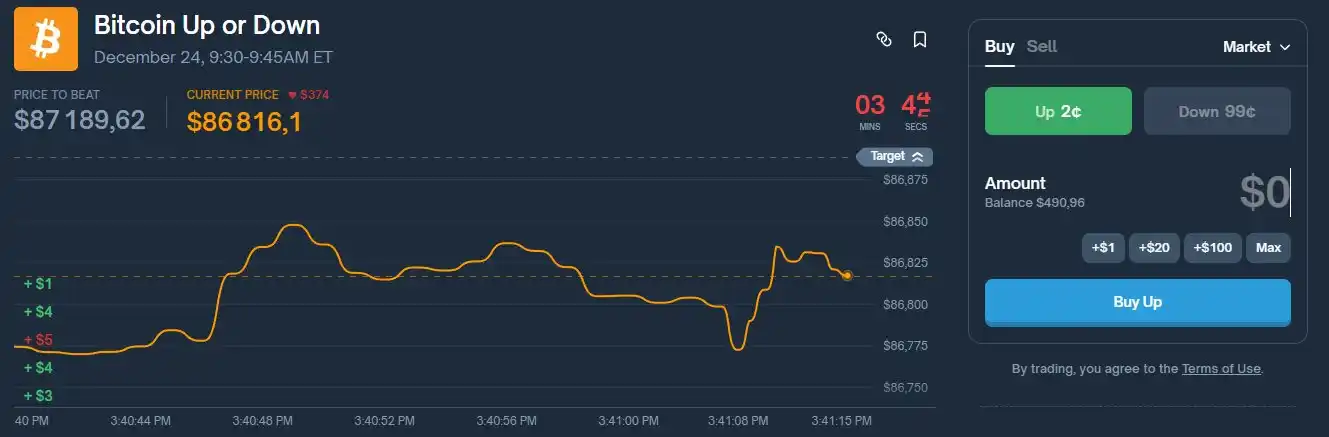
The bot runs a real-time monitoring program that can automatically switch to the current BTC 15-minute round, stream the best bid/ask via WebSocket, display a fixed terminal UI, and allow full control via text commands.
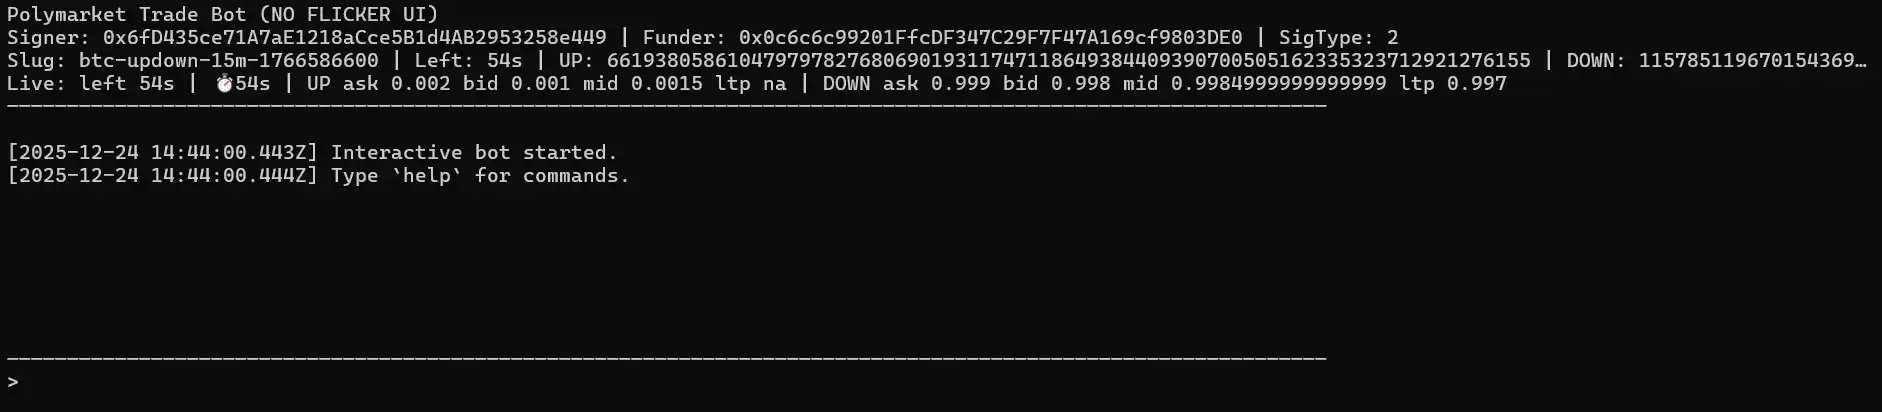
In manual mode, you can place orders directly.

buy up / buy down : Buy a specific USD amount.

buyshares up / buyshares down : Purchase an exact number of shares using user-friendly LIMIT + GTC (Good-Til-Cancelled) orders, filled at the current best ask price.

Automatic mode runs a repeating two-leg cycle.

First, it only observes price fluctuations within the first windowMin minutes after each round starts. If either side drops sufficiently fast (a drop of at least movePct within about 3 seconds), it triggers "Leg 1," buying the side that just crashed.

After completing Leg 1, the bot will never buy the same side again. It waits for "Leg 2 (the hedge)" and only triggers it when the following condition is met: leg1EntryPrice + oppositeAsk <= sumTarget.

When this condition is met, it buys the opposite side. After Leg 2 is completed, the cycle ends, and the bot returns to the observation state, waiting for the next crash signal using the same parameters.

If the round changes during the cycle, the bot abandons the open cycle and restarts with the same settings in the next round.

The parameters for automatic mode are set as follows: auto on [sum=0.95] [move=0.15] [windowMin=2]

· shares: The position size used for both legs of the trade.

· sum: The threshold allowed for hedging.

· move (movePct): The crash threshold (e.g., 0.15 = 15%).

· windowMin: The duration from the start of each round during which Leg 1 is allowed to execute.

Backtesting

The bot's logic is simple: wait for a violent price drop, buy the side that just finished dropping, then wait for the price to stabilize and hedge by buying the opposite side, while ensuring: priceUP + priceDOWN < 1.

But this logic needed testing. Does it really work in the long run? More importantly, the bot has many parameters (shares, sum, move percentage, window minutes, etc.). Which parameter set is optimal and maximizes profit?

My first thought was to let the bot run live for a week and observe the results. The problem was that this would take too long and only test one parameter set, while I needed to test many.

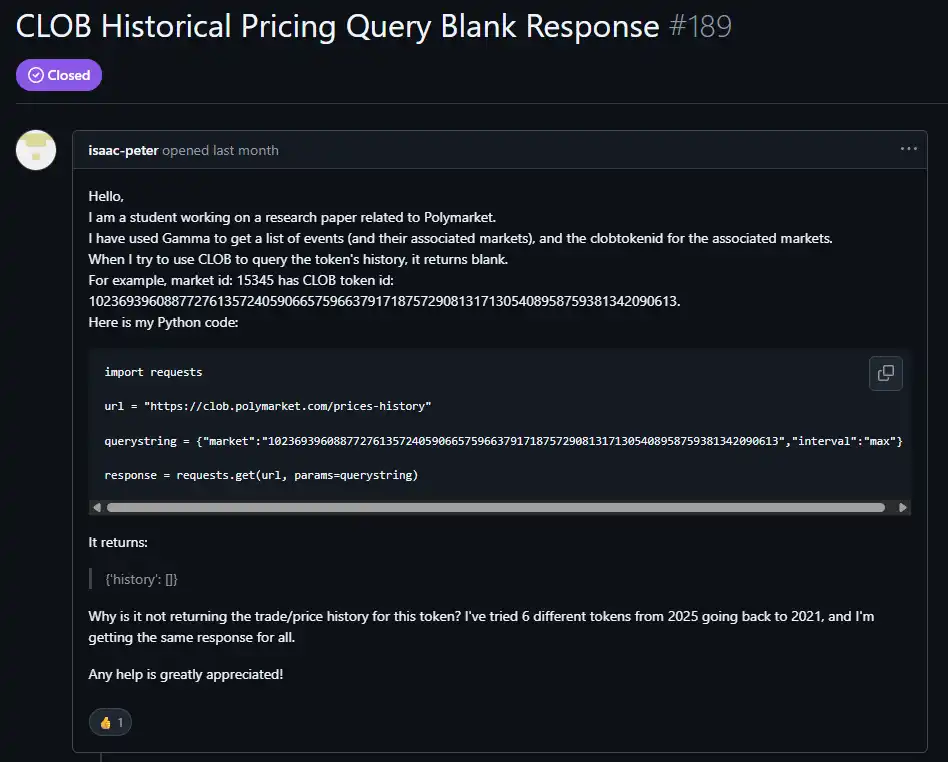
My second thought was to backtest using historical data from the Polymarket CLOB API. Unfortunately, for the BTC 15-minute UP/DOWN market, the historical data endpoint kept returning empty datasets. Without historical price ticks, the backtest couldn't detect "a crash within about 3 seconds," couldn't trigger Leg 1, and would yield 0 cycles and 0% ROI regardless of parameters.

After further investigation, I found other users encountered the same issue fetching historical data for certain markets. I tested other markets that did return historical data and concluded that for this specific market, historical data simply isn't retained.

Due to this limitation, the only reliable way to backtest this strategy was to create my own historical dataset by recording the real-time best-ask prices while the bot was running.
The logger writes snapshots to disk containing:

· Timestamp

· Round identifier (round slug)

· Seconds remaining

· UP/DOWN token IDs

· UP/DOWN best ask prices

Subsequently, the "recorded backtest" replays these snapshots and deterministically applies the same automatic logic. This guarantees access to the high-frequency data needed to detect crashes and hedging conditions.

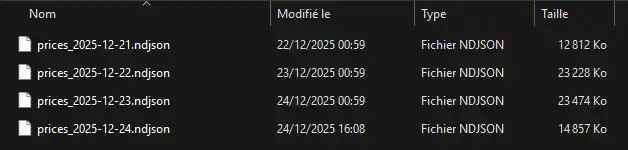
I collected 6 GB of data over 4 days in total. I could have recorded more, but I deemed it sufficient for testing different parameter sets.
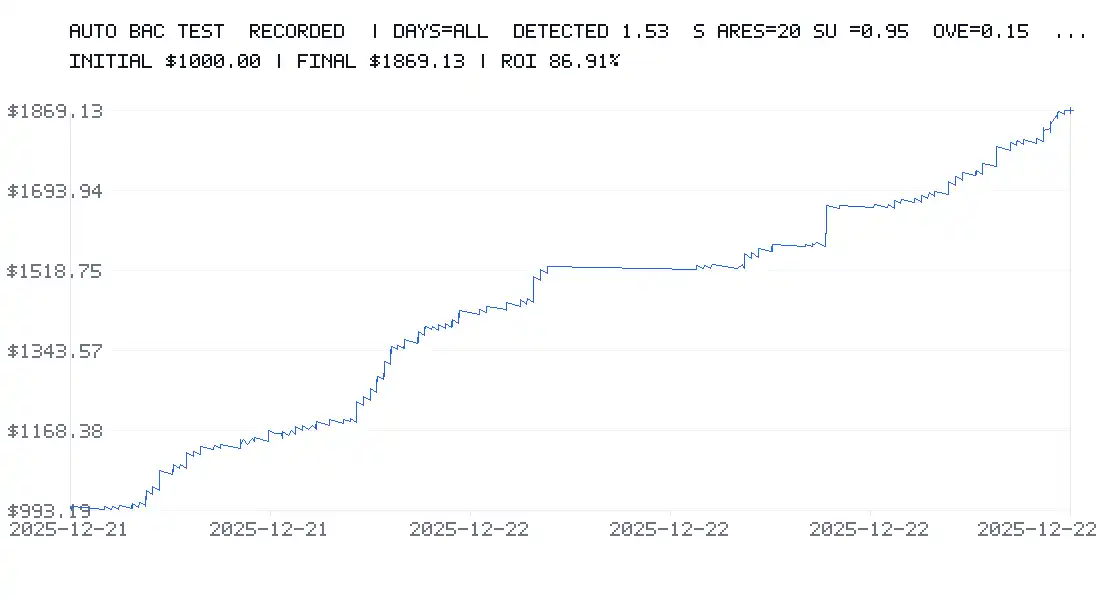
I started testing this parameter set:

· Initial balance: $1,000

· 20 shares per trade

· sumTarget = 0.95

· Crash threshold = 15%

· windowMin = 2 minutes

I also applied a constant 0.5% fee and a 2% spread to stay in a conservative scenario.

The backtest showed an ROI of 86%, turning $1,000 into $1,869 in just a few days.
Then I tested a more aggressive parameter set:

· Initial balance: $1,000

· 20 shares per trade

· sumTarget = 0.6

· Crash threshold = 1%

· windowMin = 15 minutes

Result: -50% ROI after 2 days.
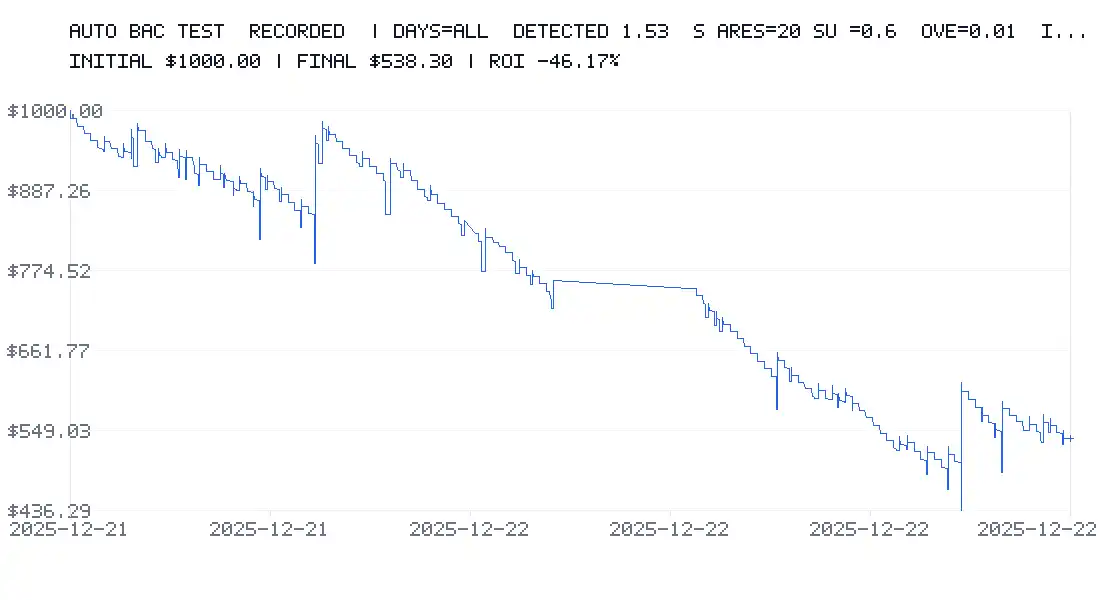
This clearly shows that parameter selection is the most critical factor. It can make you a lot of money or lead to significant losses.

Limitations of Backtesting

Even with fees and spreads included, backtesting has its limitations.

· First, it only used a few days of data, which might not be enough for a comprehensive market perspective.

· It relies on recorded best-ask snapshots; in reality, orders might be partially filled or filled at different prices. Furthermore, order book depth and available volume are not modeled.

· Micro-fluctuations below the second level are not captured (data is sampled once per second). The backtest has 1-second timestamps, but a lot can happen between seconds.

· In the backtest, slippage is constant, and variable latency (e.g., 200–1500 ms) or network spikes are not simulated.

· Each leg of the trade is considered "instantly" executed (no order queuing, no pending orders).

· Fees are charged uniformly, whereas in reality fees might depend on: market/token, maker vs. taker, fee tier, or conditions.

To be pessimistic (prudent), I applied a rule: if Leg 2 fails to execute before the market closes, Leg 1 is considered a total loss.

This is deliberately conservative but doesn't always match reality:

· Sometimes Leg 1 can be closed early,

· Sometimes it ends in-the-money (ITM) and wins,

· Sometimes the loss can be partial rather than total.

While losses might be overestimated, this provides a practical "worst-case" scenario.

Most importantly, backtesting cannot simulate the impact of your large orders on the order book or attracting other traders to hunt you. In reality, your orders can:

· Disturb the order book,

· Attract or repel other traders,

· Cause non-linear slippage.

The backtest assumes you are a pure price taker with no influence.

Finally, it does not simulate rate limits, API errors, order rejections, suspensions, timeouts, reconnections, or the bot being busy and missing signals.

Backtesting is extremely valuable for identifying good parameter ranges, but it is not a 100% guarantee, as some real-world effects cannot be modeled.

Infrastructure

I plan to run this bot on a Raspberry Pi to avoid consuming resources on my main machine and maintain 24/7 operation.

But there is still significant room for improvement:

· Using Rust instead of JavaScript would provide far superior performance and processing times.

· Running a dedicated Polygon RPC node would further reduce latency.

· Deploying on a VPS close to Polymarket's servers would also significantly reduce latency.

There are certainly other optimizations I haven't discovered yet. Currently, I am learning Rust as it is becoming an indispensable language in Web3 development.


Трендові криптовалюти

Пов'язані питання

QWhat is the core strategy used by the Polymarket trading bot described in the article?

AThe bot's core strategy is to wait for a sharp price drop (a 'flash crash') in the BTC 15-minute UP/DOWN market, buy the side that just crashed (Leg 1), and then wait to hedge by buying the opposite side once the combined price of UP and DOWN tokens meets a specific threshold, ensuring that priceUP + priceDOWN

QWhy couldn't the author perform a backtest using historical data from the Polymarket API?

AThe author couldn't perform a backtest using the Polymarket CLOB API's historical data because, for the specific BTC 15-minute UP/DOWN market, the historical data endpoint consistently returned empty datasets. No historical price ticks were available, which are required to detect the rapid price movements the strategy relies on.

QHow did the author create a dataset to backtest the bot's strategy despite the lack of historical API data?

AThe author created their own historical dataset by running a custom logger alongside the bot. This logger recorded real-time snapshots of the best-ask prices, timestamps, round identifiers, and other market data. These snapshots were then replayed in a 'recorded backtest' to deterministically apply the bot's logic.

QWhat was the result of the backtest using the conservative parameter set (sumTarget=0.95, movePct=15%, windowMin=2)?

AThe backtest using the conservative parameter set (20 shares per trade, sumTarget=0.95, movePct=15%, windowMin=2 minutes) showed a return on investment (ROI) of 86%, turning an initial $1,000 into $1,869 over a few days, even after applying a constant 0.5% fee and 2% spread.

QWhat are some key limitations of the backtesting method mentioned by the author?

AKey limitations include: using only a few days of data; relying on best-ask snapshots without modeling order book depth or partial fills; not capturing sub-second micro-fluctuations; assuming constant slippage and instant order execution; not simulating the market impact of large orders; and not accounting for API errors, network latency, or rate limits.

Пов'язані матеріали

Goldman Sachs: July Smashes Through Crowded Trades, U.S. Stock Bull Market Not Broken but Harder to Navigate

Goldman Sachs: July Sees Crowded Trades Unwound, U.S. Bull Market Intact but Getting Tougher. The U.S. stock market in July did not see an index-level crash, but rather a significant unwinding of speculative positions. While the S&P 500 remained stable—trading within a narrow 3.5% range and staying within 2% of its high—underlying market dynamics were volatile. Heavily crowded trades, particularly in high-momentum tech, AI-linked stocks, and Asian strategies, faced severe pressure and forced deleveraging. Data indicates this was a meaningful cleanse, not a minor adjustment. Global tech exposure saw its largest sell-off in over five years, leverage in Korean equity ETFs plummeted, and Goldman's prime brokerage recorded the largest gross exposure reduction since late 2022. Leverage on momentum factors among fundamental long/short clients fell to the 28th percentile of its one-year range. The AI trade narrative shifted from pure potential to a focus on tangible returns. While Meta failed to show clear AI monetization, Microsoft and Amazon provided evidence that massive capital expenditure is translating into scalable revenue and product growth, preventing a blanket sell-off of the AI sector. The Federal Reserve's more opaque communication style and volatility in long-end Treasury yields have introduced new friction, particularly for rate-sensitive growth and tech stocks. The broader outlook for U.S. equities remains favorable, supported by a strong economy, robust earnings, and substantial AI capital expenditure. However, risk/reward is no longer cheap, and the market's upward elasticity has weakened. The Nasdaq 100's trajectory—up 12% year-to-date despite significant pullbacks—illustrates that the bull trend persists but the path is becoming more difficult. The key lesson from July is that the market no longer rewards crowded, highly leveraged trades, requiring more disciplined and liquid portfolio approaches.

marsbit2 год тому

Goldman Sachs: July Smashes Through Crowded Trades, U.S. Stock Bull Market Not Broken but Harder to Navigate

marsbit2 год тому

Interview with Robinhood Executive: Meme + Tokenized US Stocks as "Barbell" Customer Acquisition Strategy, All Business Lines Achieve Hundreds of Millions in Revenue

Interview with Robinhood executive Johann Kerbrat reveals the company's "barbell" customer acquisition strategy for its new Robinhood Chain, combining meme tokens with tokenized stocks. Three weeks after mainnet launch, the chain has seen over $3B in weekly DEX volume and 105M transactions. Kerbrat explains the logic behind the permissionless chain: meme tokens attract DeFi users, while tokenized real-world assets (RWA), currently over 90 US stocks and ETFs accessible in 120+ countries, serve global users. The goal is to bring Robinhood's 27 million funded accounts on-chain by simplifying DeFi with a user-friendly interface, exemplified by features like Robinhood Earn which offers yield without requiring wallet management. Built on Arbitrum's technology stack for its speed, low cost, and Ethereum's security, the chain focuses on financial products like Earn, spot trading, and perpetuals. Kerbrat downplays direct competition with platforms like Base, emphasizing the goal of expanding the overall market for on-chain assets. He details selective partnerships (e.g., Morpho, Lighter) based on compliance, unique UX, and differentiation. While regulatory clarity is pending for US perpetuals, the expansion continues via Bitstamp in Europe. Finally, Kerbrat positions Robinhood as a "super app" integrating stocks, options, crypto, banking, and AI trading, with all major business lines generating hundreds of millions in revenue. For the chain, current priority is driving adoption over maximizing gas fee revenue.

marsbit4 год тому

Interview with Robinhood Executive: Meme + Tokenized US Stocks as "Barbell" Customer Acquisition Strategy, All Business Lines Achieve Hundreds of Millions in Revenue

marsbit4 год тому

Торгівля

Спот

Популярні статті

Як купити O

Ласкаво просимо до HTX.com! Ми зробили покупку O1 exchange (O) простою та зручною. Дотримуйтесь нашої покрокової інструкції, щоб розпочати свою криптовалютну подорож.Крок 1: Створіть обліковий запис на HTXВикористовуйте свою електронну пошту або номер телефону, щоб зареєструвати обліковий запис на HTX безплатно. Пройдіть безпроблемну реєстрацію й отримайте доступ до всіх функцій.ЗареєструватисьКрок 2: Перейдіть до розділу Купити крипту і виберіть спосіб оплатиКредитна/дебетова картка: використовуйте вашу картку Visa або Mastercard, щоб миттєво купити O1 exchange (O).Баланс: використовуйте кошти з балансу вашого рахунку HTX для безперешкодної торгівлі.Треті особи: ми додали популярні способи оплати, такі як Google Pay та Apple Pay, щоб підвищити зручність.P2P: Торгуйте безпосередньо з іншими користувачами на HTX.Позабіржова торгівля (OTC): ми пропонуємо індивідуальні послуги та конкурентні обмінні курси для трейдерів.Крок 3: Зберігайте свої O1 exchange (O)Після придбання O1 exchange (O) збережіть його у своєму обліковому записі на HTX. Крім того, ви можете відправити його в інше місце за допомогою блокчейн-переказу або використовувати його для торгівлі іншими криптовалютами.Крок 4: Торгівля O1 exchange (O)Легко торгуйте O1 exchange (O) на спотовому ринку HTX. Просто увійдіть до свого облікового запису, виберіть торгову пару, укладайте угоди та спостерігайте за ними в режимі реального часу. Ми пропонуємо зручний досвід як для початківців, так і для досвідчених трейдерів.

432 переглядів усьогоОпубліковано 2026.06.19Оновлено 2026.06.19

Як купити O

Як купити PROS

Ласкаво просимо до HTX.com! Ми зробили покупку Pharos (PROS) простою та зручною. Дотримуйтесь нашої покрокової інструкції, щоб розпочати свою криптовалютну подорож.Крок 1: Створіть обліковий запис на HTXВикористовуйте свою електронну пошту або номер телефону, щоб зареєструвати обліковий запис на HTX безплатно. Пройдіть безпроблемну реєстрацію й отримайте доступ до всіх функцій.ЗареєструватисьКрок 2: Перейдіть до розділу Купити крипту і виберіть спосіб оплатиКредитна/дебетова картка: використовуйте вашу картку Visa або Mastercard, щоб миттєво купити Pharos (PROS).Баланс: використовуйте кошти з балансу вашого рахунку HTX для безперешкодної торгівлі.Треті особи: ми додали популярні способи оплати, такі як Google Pay та Apple Pay, щоб підвищити зручність.P2P: Торгуйте безпосередньо з іншими користувачами на HTX.Позабіржова торгівля (OTC): ми пропонуємо індивідуальні послуги та конкурентні обмінні курси для трейдерів.Крок 3: Зберігайте свої Pharos (PROS)Після придбання Pharos (PROS) збережіть його у своєму обліковому записі на HTX. Крім того, ви можете відправити його в інше місце за допомогою блокчейн-переказу або використовувати його для торгівлі іншими криптовалютами.Крок 4: Торгівля Pharos (PROS)Легко торгуйте Pharos (PROS) на спотовому ринку HTX. Просто увійдіть до свого облікового запису, виберіть торгову пару, укладайте угоди та спостерігайте за ними в режимі реального часу. Ми пропонуємо зручний досвід як для початківців, так і для досвідчених трейдерів.

503 переглядів усьогоОпубліковано 2026.06.22Оновлено 2026.06.22

Як купити PROS

Що таке VERONA

I. Вступ до проекту VERONA - це блокчейн, створений для всіх, скрізь, через абстракцію ланцюга. Використовуючи свій загальний шар абстракції, VERONA вирізняється інтеграцією складних функцій блокчейну, таких як рахунки, підписи та взаємодія, безпосередньо на рівні протоколу. Цей підхід дозволяє взаємодіяти з блокчейн-додатками без необхідності розуміти основні технології.1) Основна інформація Назва: VERONA (VERONA)III. Пов'язані посилання Офіційне посилання на сайт: https://xion.burnt.com/ Біла книга: https://xion.burnt.com/whitepaper.pdf Експлорери: https://explorer.burnt.com/ Соціальні мережі: https://x.com/burnt_xion Примітка: Вступ до проекту взято з матеріалів, опублікованих або наданих офіційною командою проекту, які є лише для довідки і не є інвестиційною порадою. HTX не несе відповідальності за будь-які прямі або непрямі збитки, що виникають внаслідок цього.

360 переглядів усьогоОпубліковано 2026.06.22Оновлено 2026.06.22

Що таке VERONA

Обговорення

Ласкаво просимо до спільноти HTX. Тут ви можете бути в курсі останніх подій розвитку платформи та отримати доступ до професійної ринкової інформації. Нижче представлені думки користувачів щодо ціни A (A).

活动图片