Ethereum is trading at $1,856.19 on August 3, down 1.44%, consolidating within the Fibonacci range between $1,837 and $1,939, as the downtrend line from the May peak continues to limit recovery attempts.
$ETH Holds the 0.382 Fibonacci Level, But the Downtrend Line Remains Unbroken
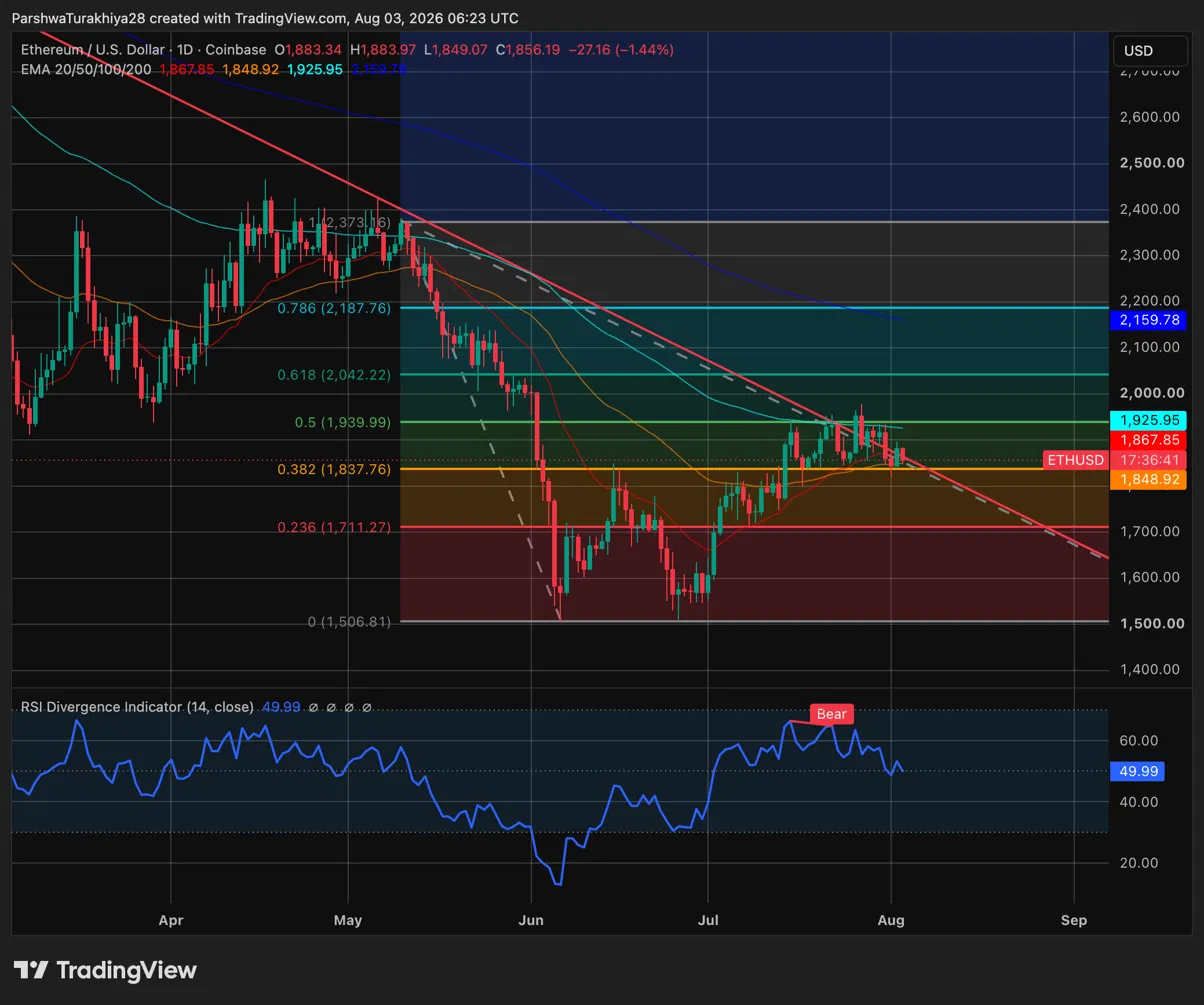
$ETH is trading between the 0.382 Fibonacci level at $1,837.76 and the 0.5 level at $1,939.99, with today's session falling from a high of $1,883.97 to close at $1,856.19. The 20-day EMA at $1,867.85 is just above the nearest ceiling, and the 50-day EMA at $1,848.92 is the first support below.
The downtrend line from the May peak around $2,373 continues to push the price back near $1,900, and the 100-day EMA at $1,925.95 clusters with this line, making the $1,925–$1,940 zone a key area to overcome before reaching $2,000. The RSI at 49.99 is right at neutral with a bearish divergence signal, indicating that momentum has not yet confirmed a recovery.
Support and Resistance Levels for $ETH, August 3, 2026
| Type | Price | Level |
| Resistance | $1,867.85 | 20-day EMA, nearest ceiling |
| Resistance | $1,925.95 | 100-day EMA, coincides with downtrend line |
| Resistance | $1,939.99 | 0.5 Fibonacci |
| Resistance | $2,042.22 | 0.618 Fibonacci |
| Resistance | $2,159.78 | 200-day EMA, long-term ceiling |
| Support | $1,848.92 | 50-day EMA, first support below |
| Support | $1,837.76 | 0.382 Fibonacci, key floor |
| Support | $1,711.27 | 0.236 Fibonacci |
| Support | $1,506.81 | June low, Fibonacci base |
Spot $ETH ETFs Record Fourth Consecutive Week of Inflows
Spot Ethereum ETFs recorded a daily net inflow of $9.03 million on July 31, bringing the total weekly inflow to $27.42 million and extending the $ETH inflow streak to four consecutive weeks, according to SoSoValue. This flow followed weekly inflows of $103.90 million, $105.44 million, and $84.42 million over the previous three weeks, making the week of July 31 the mildest of the four but still positive. The cumulative net inflows for all products now stand at $11.21 billion with total net assets of $10.23 billion.
The contrast with Bitcoin ETFs is noticeable. Spot $BTC products recorded a one-day outflow of $265.37 million on July 31, breaking a three-week inflow streak, while $ETH products maintained a positive result for the fourth consecutive week.
The $ETH/$BTC Ratio Forms a Cup and Handle
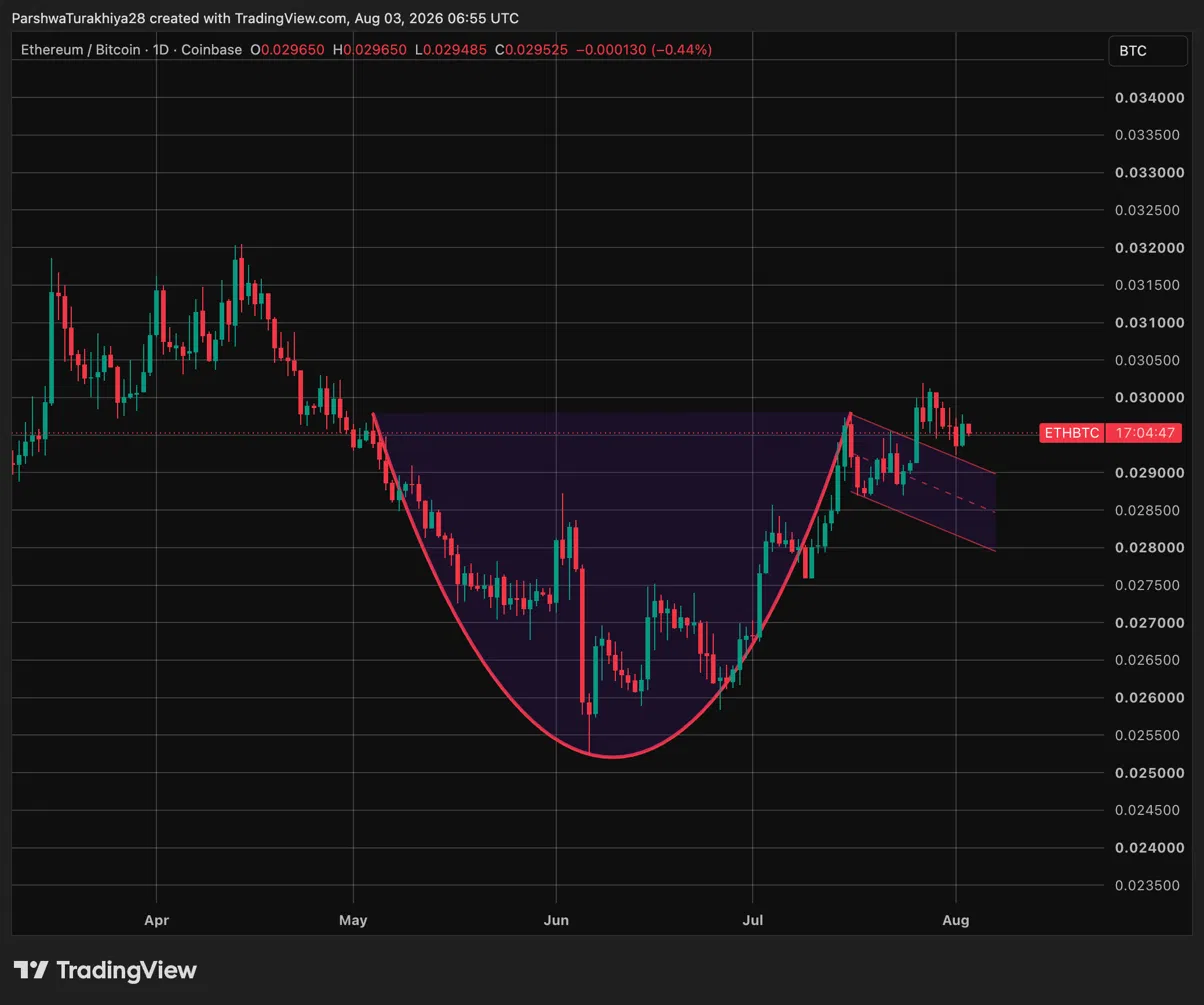
The $ETH/$BTC pair is trading at 0.029525 on the daily chart, down 0.44% for the session, but the broader structure tells a more constructive story. The ratio carved out a full cup from the May high around 0.0300, reaching a low around 0.0255 in June before recovering back to the breakout line. The price is now forming a handle just below the 0.030 resistance—a classic cup and handle pattern.
A confirmed breakout above 0.030 on a daily close would signal that $ETH is outperforming Bitcoin in the near term, which historically corresponds to broader altcoin strength. The lower bound of the handle around 0.0285 is a level to watch for downside risk. A break below this would again call the recovery structure into question and indicate that Bitcoin continues to lead.
The Ethereum Valuation Debate: Scaling Without Capturing Fees
➥ Ethereum is scaling faster than ever, yet $ETH is still trading below $2,000
— Tanaka (@Tanaka_L2) July 31, 2026
As someone who actually holds $ETH, I think this disconnect is the most important debate in the ecosystem right now.
Q2 numbers were not terrible, but they exposed a structural weakness:
– Ethereum... https://t.co/c8UCEkhCk9 pic.twitter.com/ke8X3XcEiI
Analyst Tanaka highlighted a key tension in a July 31 thread: Ethereum is scaling faster than ever, but the $ETH itself is capturing less and less of the value being created on top of it.
Second-quarter data makes this concrete. Ethereum L1 generated $88.4 million in real economic value, while applications built on it generated about $1.79 billion in fees, meaning L1 captured only 4.9% of its ecosystem's output. Rollups currently process about 1,270 operations per second compared to just 20.4 on L1—a gap of 41.6 times. Robinhood Chain alone processes about 4.7 times more activity than the Ethereum mainnet. Cheap blob fees have enabled scaling but have also reduced $ETH burn, with the 7-day blob fee burn being only 0.22 $ETH.
Tanaka's argument is that the old theory of more users driving higher gas fees and more $ETH burn no longer holds. His current bet is on institutional adoption: $17.2 billion in tokenized real-world assets are already on Ethereum within a $299.4 billion stablecoin market, positioning $ETH as collateral and settlement infrastructure, not as a fee-generating asset.
| Metric | Value |
| L1 Real Economic Value | $88.4 million (up 7% QoQ, down 68% YoY) |
| Application-Level Fees | ~$1.79B |
| L1 Value Capture Ratio | ~4.9% of application-level fees |
| Rollup Activity | ~1,270 UOPS vs 20.4 on L1 |
| 7-Day Blob Fee Burn | ~0.22 $ETH |
| $ETH Staked | ~41.10 million (33.7% of supply) |
| Tokenized RWAs on Ethereum | ~$17.2B |
Ethereum Price Forecast: Upside Targets and Downside Risks
Bull Case, Target: $2,042 (0.618 Fibonacci)
$ETH holds the 50-day EMA at $1,848.92 and reclaims the 20-day EMA at $1,867.85 at the daily close, confirming the 0.382 Fibonacci as support. The downtrend line breaks as $ETH ETF inflows continue for a fifth consecutive week, and the $ETH/$BTC ratio confirms a cup and handle breakout above 0.030. The price breaks through the 100-day EMA at $1,925.95 and the psychological $2,000 level to the 0.618 Fibonacci at $2,042.22.
Bear Case, Risk Level: $1,711 (0.236 Fibonacci)
The downtrend line continues to reject the price, and the bearish RSI divergence worsens. $ETH loses the 50-day EMA at $1,848.92 and the 0.382 Fibonacci level at $1,837.76, with the $ETH/$BTC ratio breaking below 0.0285, confirming a resumption of Bitcoin dominance. The price falls towards the 0.236 Fibonacci level at $1,711.27, with the June low of $1,506.81 coming back into view for a deeper low.
end-content