4 Classic Bottom-Fishing Indicators All Failed, 3 New Indicators Point to the Bottom-Fishing Opportunity?

Odaily星球日报Опубліковано о 2026-03-19Востаннє оновлено о 2026-03-19

Анотація

The article analyzes the shifting effectiveness of traditional Bitcoin bottom-buying indicators and proposes new metrics to identify potential market bottoms. Four classic indicators are discussed: - **MVRV Z-Score** (currently ~1.31) is distorted by institutional holdings, making historical "extreme negative" values unlikely. - **Ahr999 Index** has remained below 0.45 for nearly 50 days, but its long-term predictive power has diminished due to macro factors. - **SOPR Metrics** show STH-SOPR consistently below 1 (bearish), while LTH-SOPR remains between 0.75–1, indicating no full capitulation. - **Mayer Multiple** (price/200-day MA) has also stayed below 0.8 for 50 days but lacks consistent predictive strength. Three alternative indicators are suggested: 1. **CVDD (Cumulative Value Days Destroyed)**: Models a historical "iron bottom" near $45,000. 2. **NUPL (Net Unrealized Profit/Loss)**: Currently at 0.2; negative values often signal market bottoms. 3. **Stablecoin Exchange Netflow**: Sustained inflows of USDT/USDC to exchanges typically precede rebounds by 2–4 weeks, but current outflows suggest no immediate bottom. The conclusion emphasizes that indicators are reference tools, not guarantees, and cautions that widespread public euphoria (e.g., mainstream adoption talks) may signal a sell opportunity rather than a buy.

Original | Odaily Planet Daily (@OdailyChina)

Author | Wenser (@wenser 2010)

After experiencing eight consecutive days of gains on the daily chart, BTC has once again turned downward, falling continuously from $76,000 and is currently trading at $69,200. The mainstream bottom-fishing indicators previously referenced within the industry, including Ahr999 (also known as the "9 God Index"), Weekly RSI, STH-SOPR (Short-Term Holder Spent Output Profit Ratio), LTH (Long-Term Holder Spent Output Profit Ratio), and MVRV Z-Score (Market Value to Realized Value Z-Score), have all shown a state of being "sometimes effective, sometimes not": many indicators are at low levels, yet the market continues to fall; some indicators are at high levels, but the market occasionally surges.

In view of this, this article will present 4 representative bottom-fishing indicators within the industry and combine them with data and real-life "implicit indicators" to construct new "bottom-fishing indicators," attempting to explore the downside potential of BTC. The following content is for learning and exchange purposes only, does not constitute investment advice, all investment risks are your own, please DYOR.

4 Classic Indicators for BTC Bottom-Fishing Timing: The Best Time Has Not Yet Come, BTC May Fall Below $60k

From the new high of $126,000 in October last year to the current oscillation around $70,000, BTC's price has been like a roller coaster in just a few months. In such a volatile crypto market environment, many industry indicators have already lost their reference value, including but not limited to the dynamic and flexible miner shutdown price, the industry Fear and Greed Index, Google search heat index, and the Rainbow Chart based on the early penetration stage of BTC.

The reason is none other than the fact that after the influx of BTC spot ETF funds, the increasing number of US DAT treasury companies, and the facilitation by US regulators, the evaluation system for BTC has undergone structural changes. Institutional holdings, derivative arbitrage, internal exchange settlements, US macro monetary policy, and even global geopolitics have become factors with higher weightings affecting BTC's price. In other words, past on-chain indicators and profit/loss can only serve as references and cannot lead to direct conclusions anymore.

Here, we use industry indicators that still have some representativeness to present data and analyze results, which may more intuitively illustrate the failure of the old indicators.

Indicator 1: MVRV Z-Score, Collective Deviation of the Anchored Value System
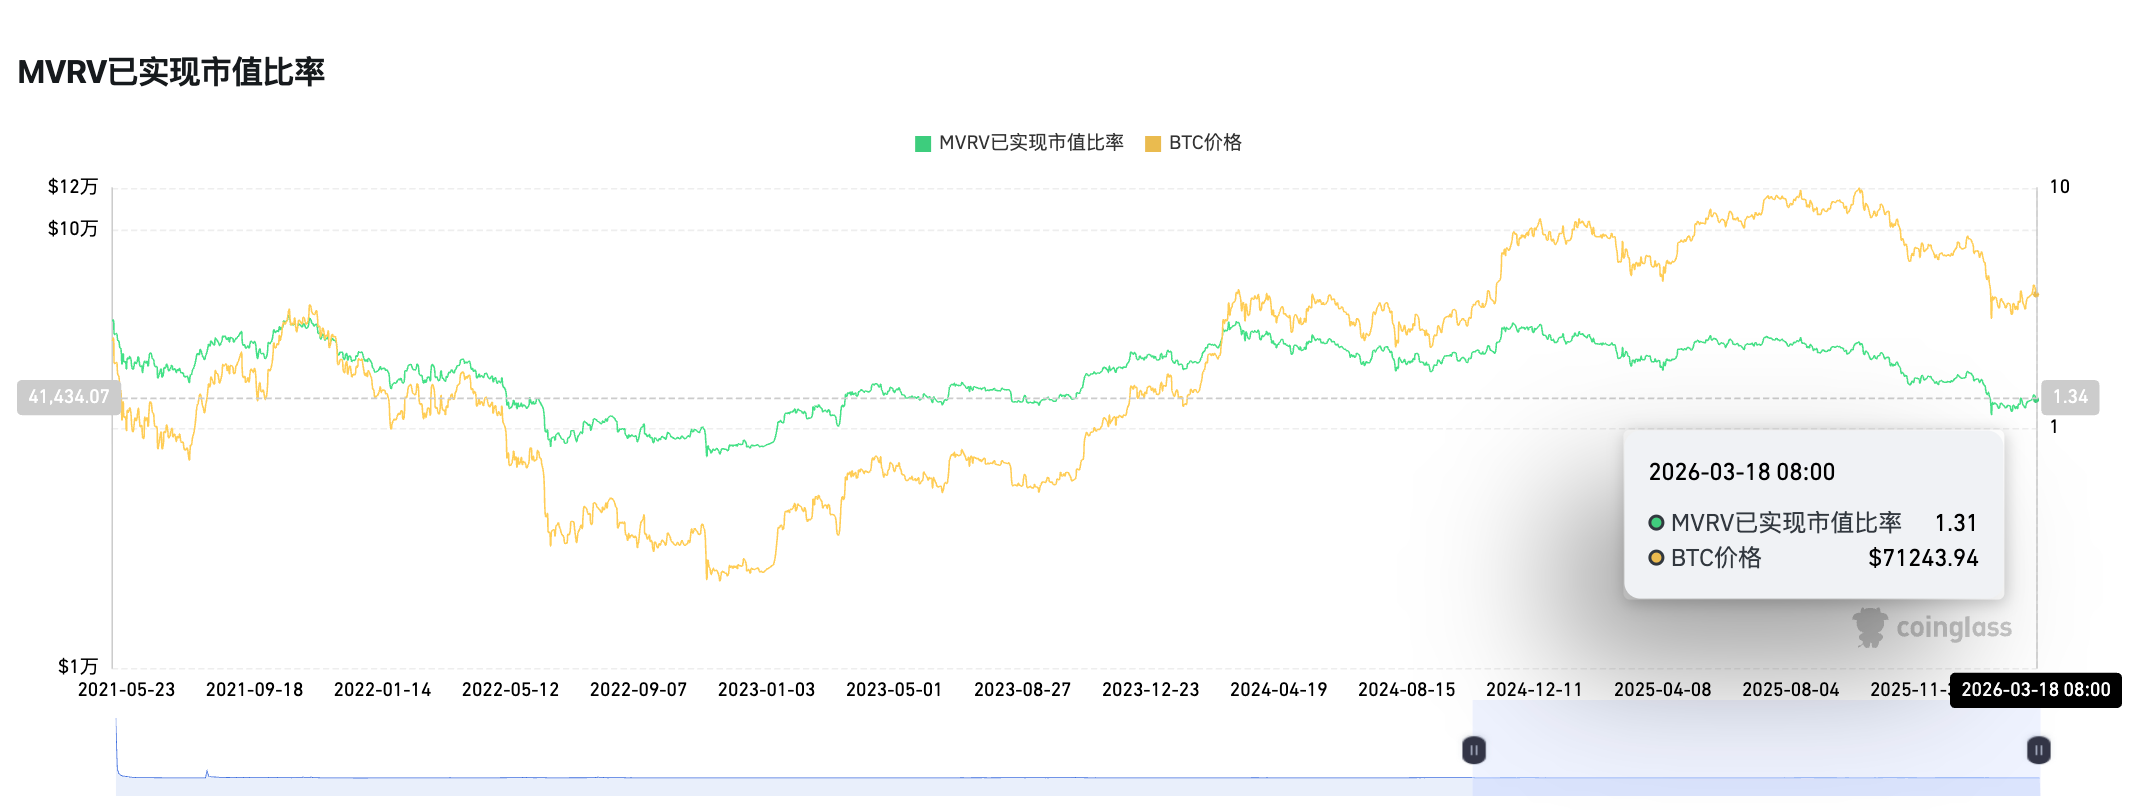
Figure 1
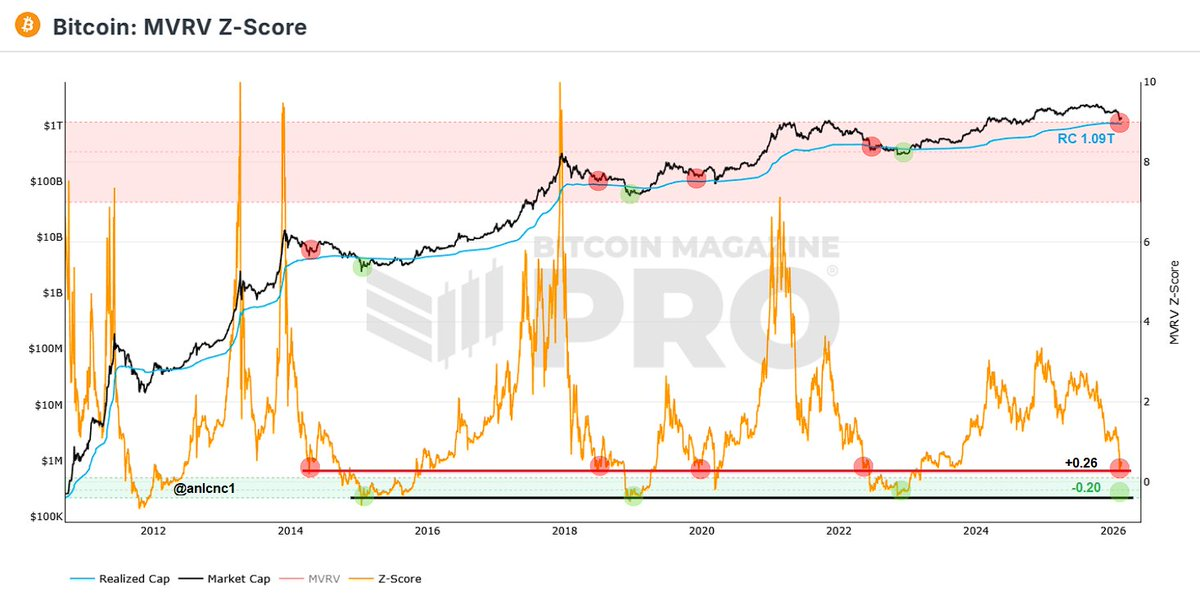
Figure 2
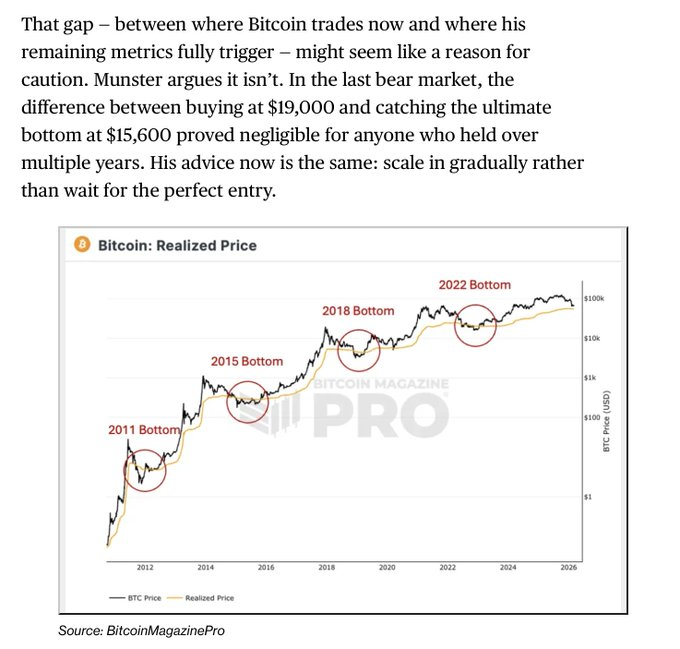
Figure 3

As of March 18, the MRVR indicator was temporarily reported at 1.31; previously, in February, crypto researcher anıl pointed out, "When the MVRV Z-Score falls below 0, especially below -0.20, Bitcoin is at its price bottom. In this cycle, the lowest value Bitcoin touched was +0.26, which means the classic 'green zone' has not yet been tested." (Figure 2 above) On March 14, Bitcoin News published an article stating that the MVRV Z Score had dropped to about 0.38, a level that previously indicated undervaluation. Other key support levels include the realized price near $54,000 and the 200-week moving average near $58,000. Bloomberg pointed out that the potential bottom range is between $45,000 and $55,000, but sustained recovery requires new demand support. (Figure 3 above)

Reason for failure: Large-scale holdings by ETF custodians and DAT companies have systematically raised the Realized Value (RV), significantly increasing the denominator (standard deviation) of the Z-Score, making the historically "extreme negative values" extremely difficult to reappear under the current structure.

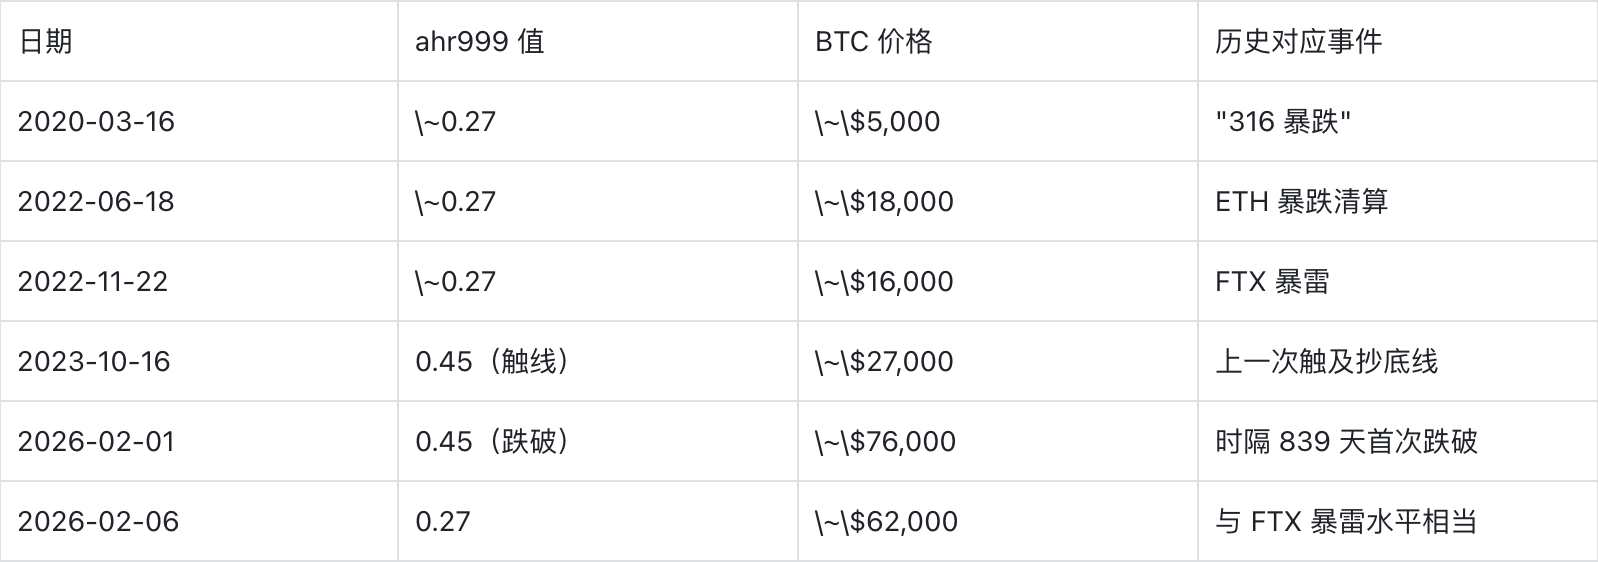
Indicator 2: Ahr999 Index (9 God Index), The bottom-fishing zone below 0.45 has lasted for nearly 50 days
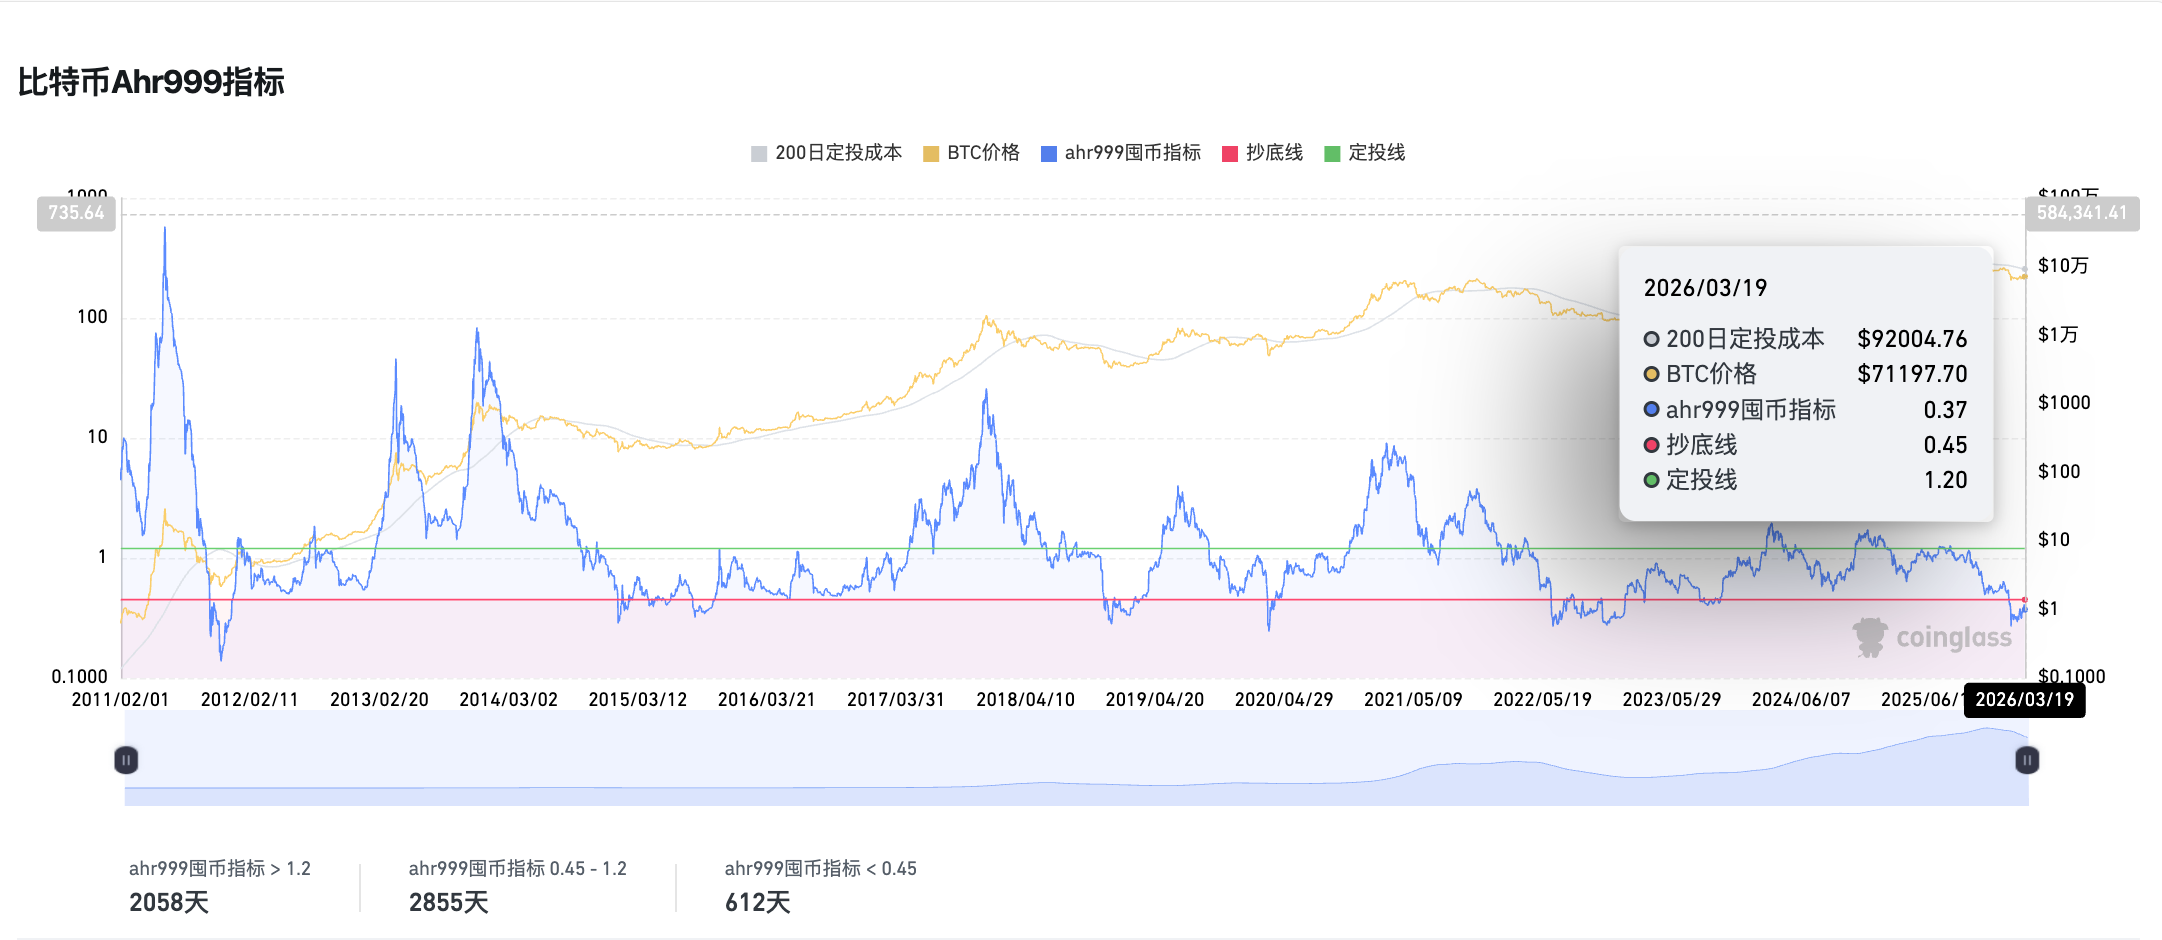
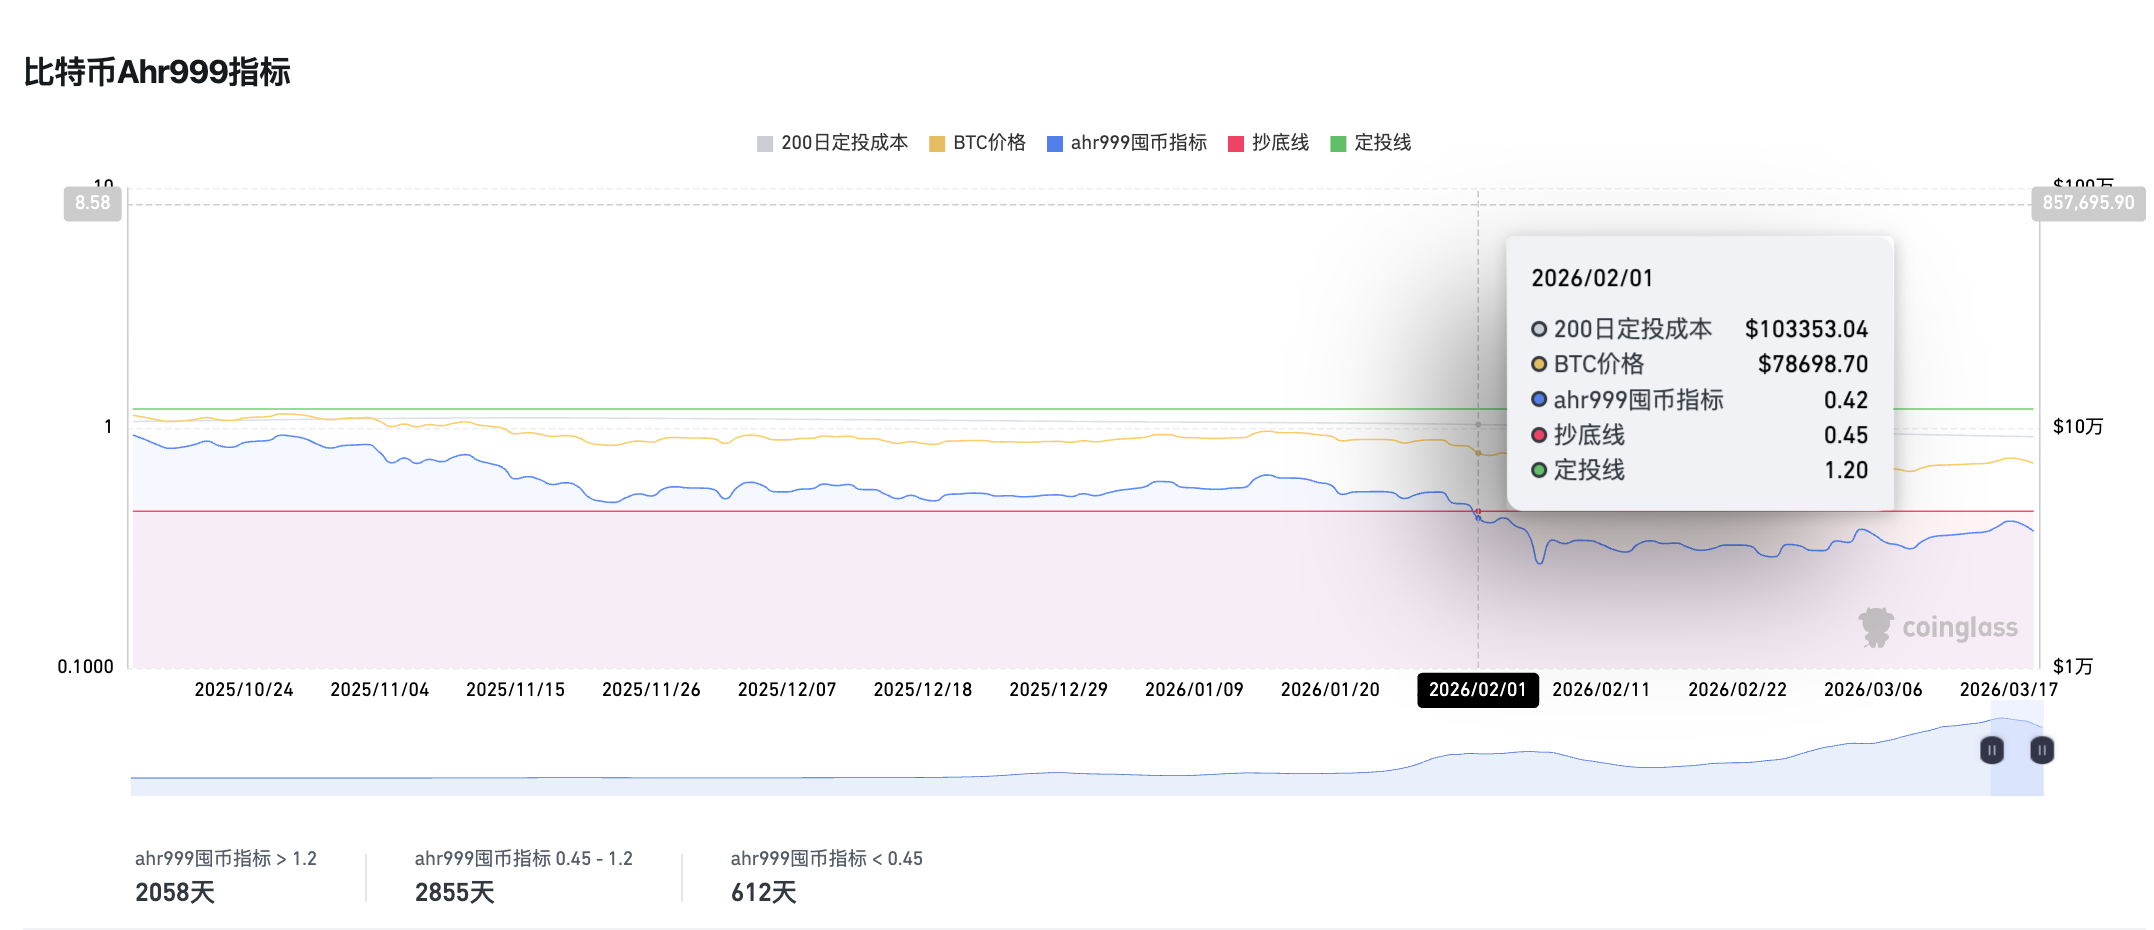
Since February 1st until now, the Ahr999 indicator has been below 0.45 for nearly 50 consecutive days. Historically, the number of days this indicator has been <0.45 is only 612 days, accounting for about 11% of the total time. On March 19, the Ahr999 accumulation indicator data was 0.37, still indicating a bottom-fishing zone, but it is difficult to provide more long-term guidance information.

Reason for failure: Since the major crash on October 11 last year, the market has been in a state of continuous oversold conditions. Coupled with Trump's volatile policies, the Federal Reserve's interest rate cuts falling short of expectations, and international geopolitical turmoil, BTC's safe-haven属性 has greatly diminished. Therefore, even after falling below the $76,000 cost line of the largest BTC DAT listed company, Strategy, it awaits more liquidity repair. This indicator has gradually become a comfort index for "long-term value investors".

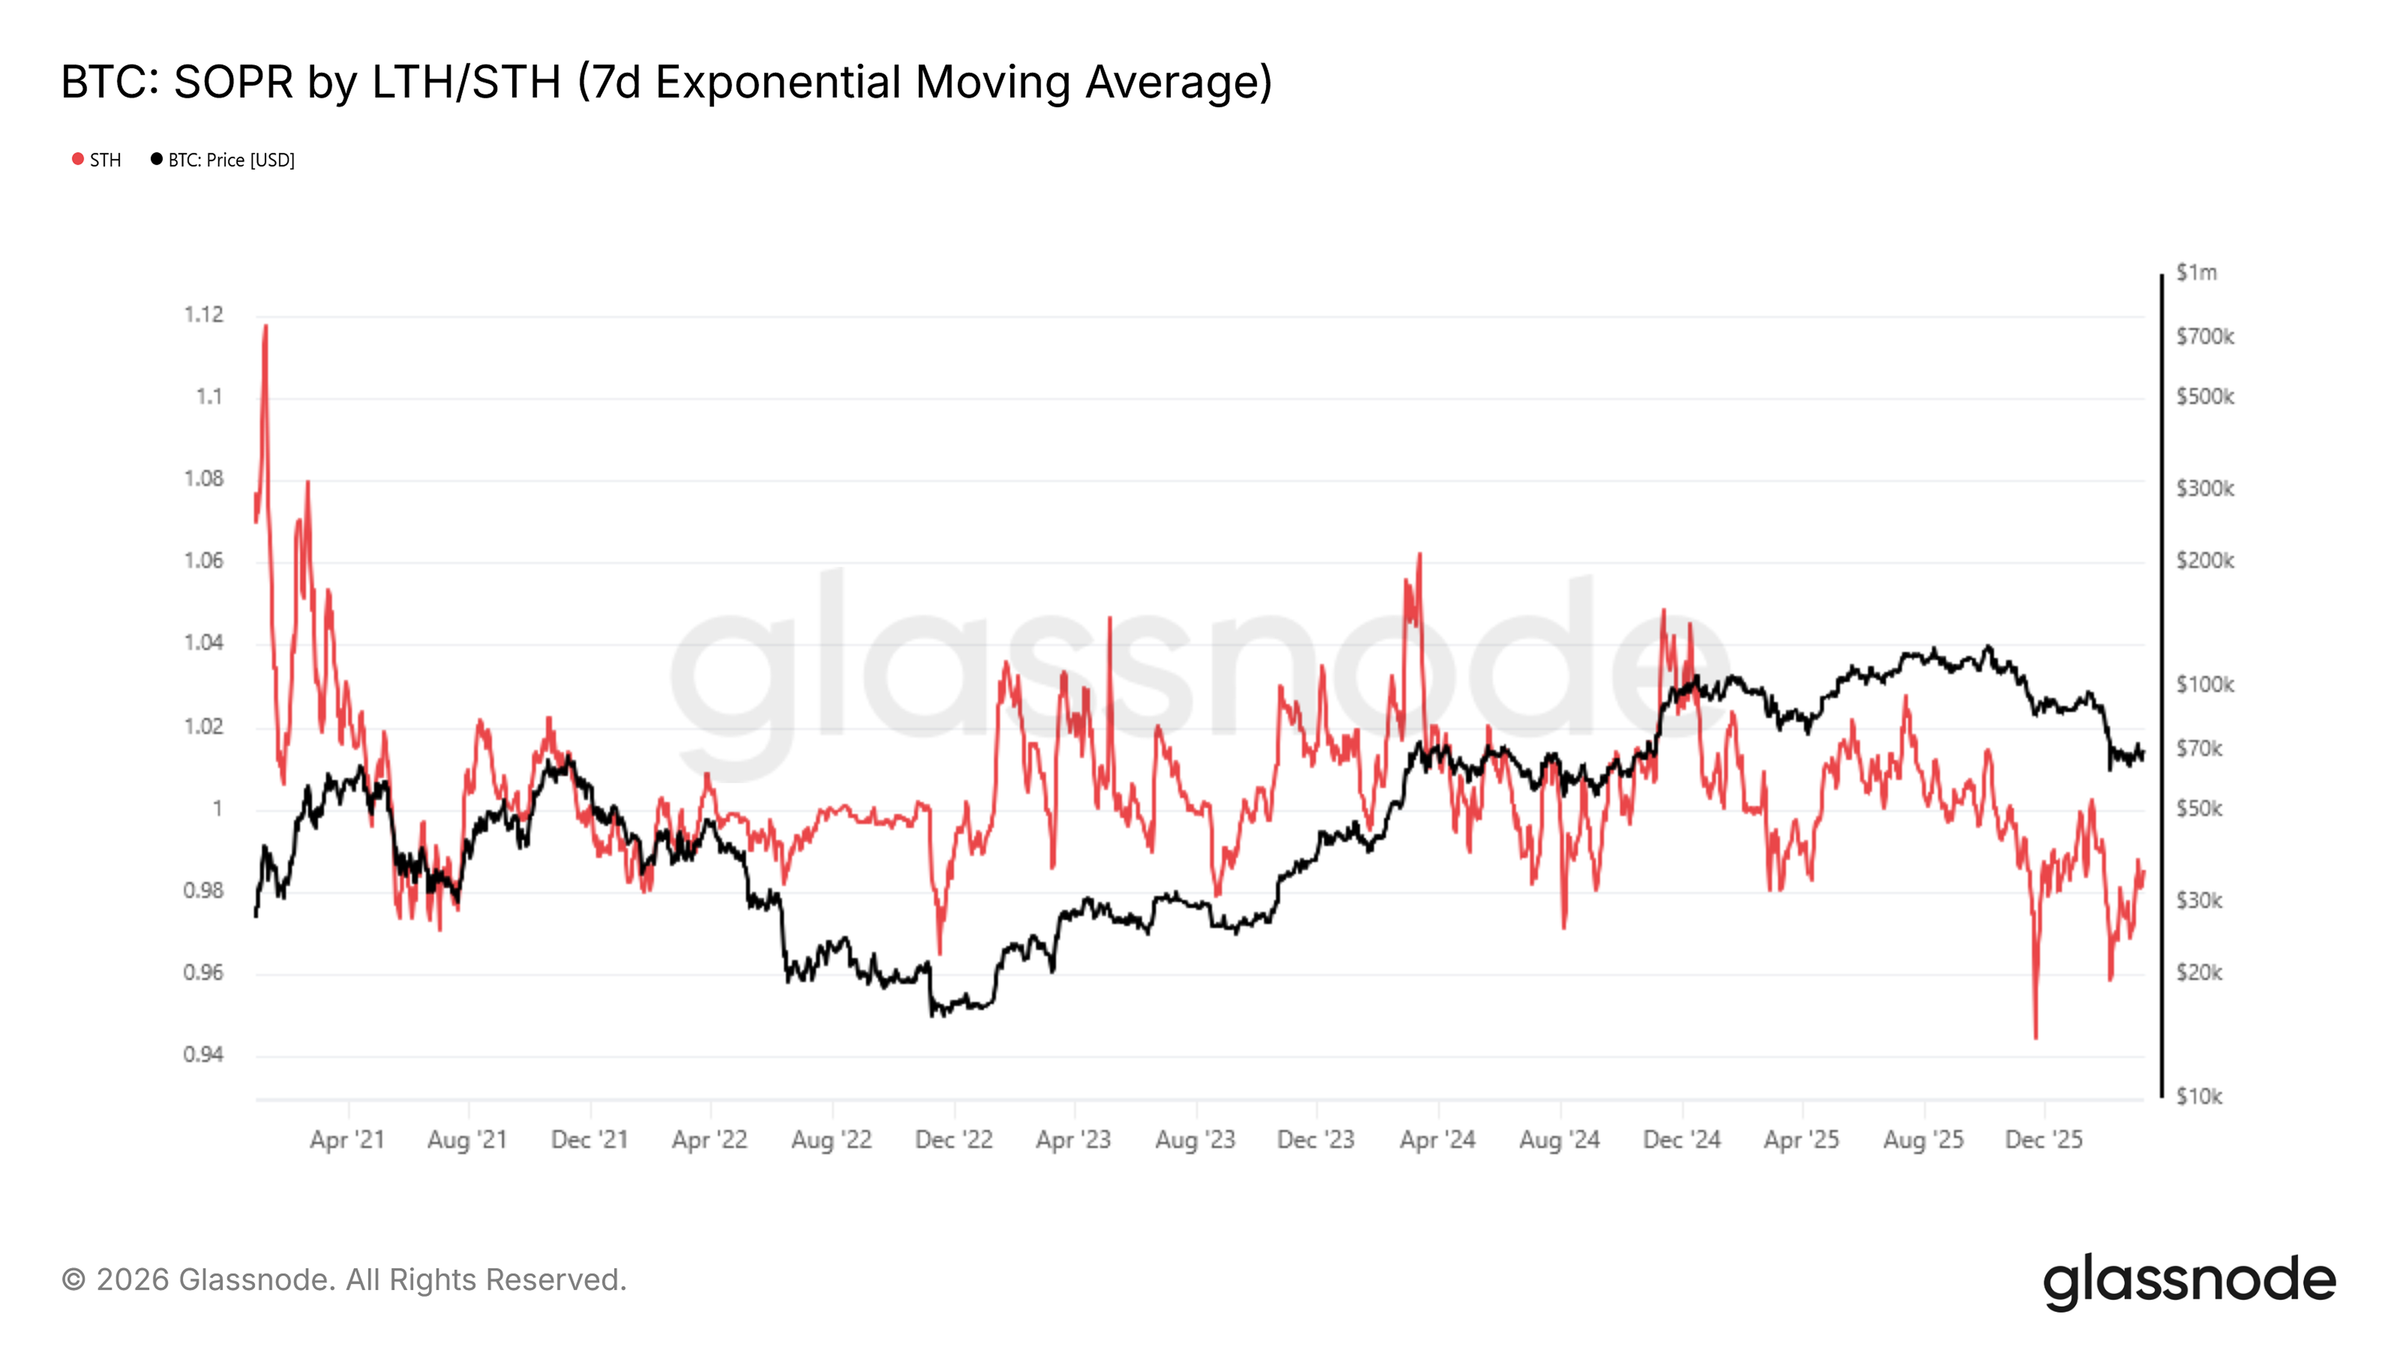
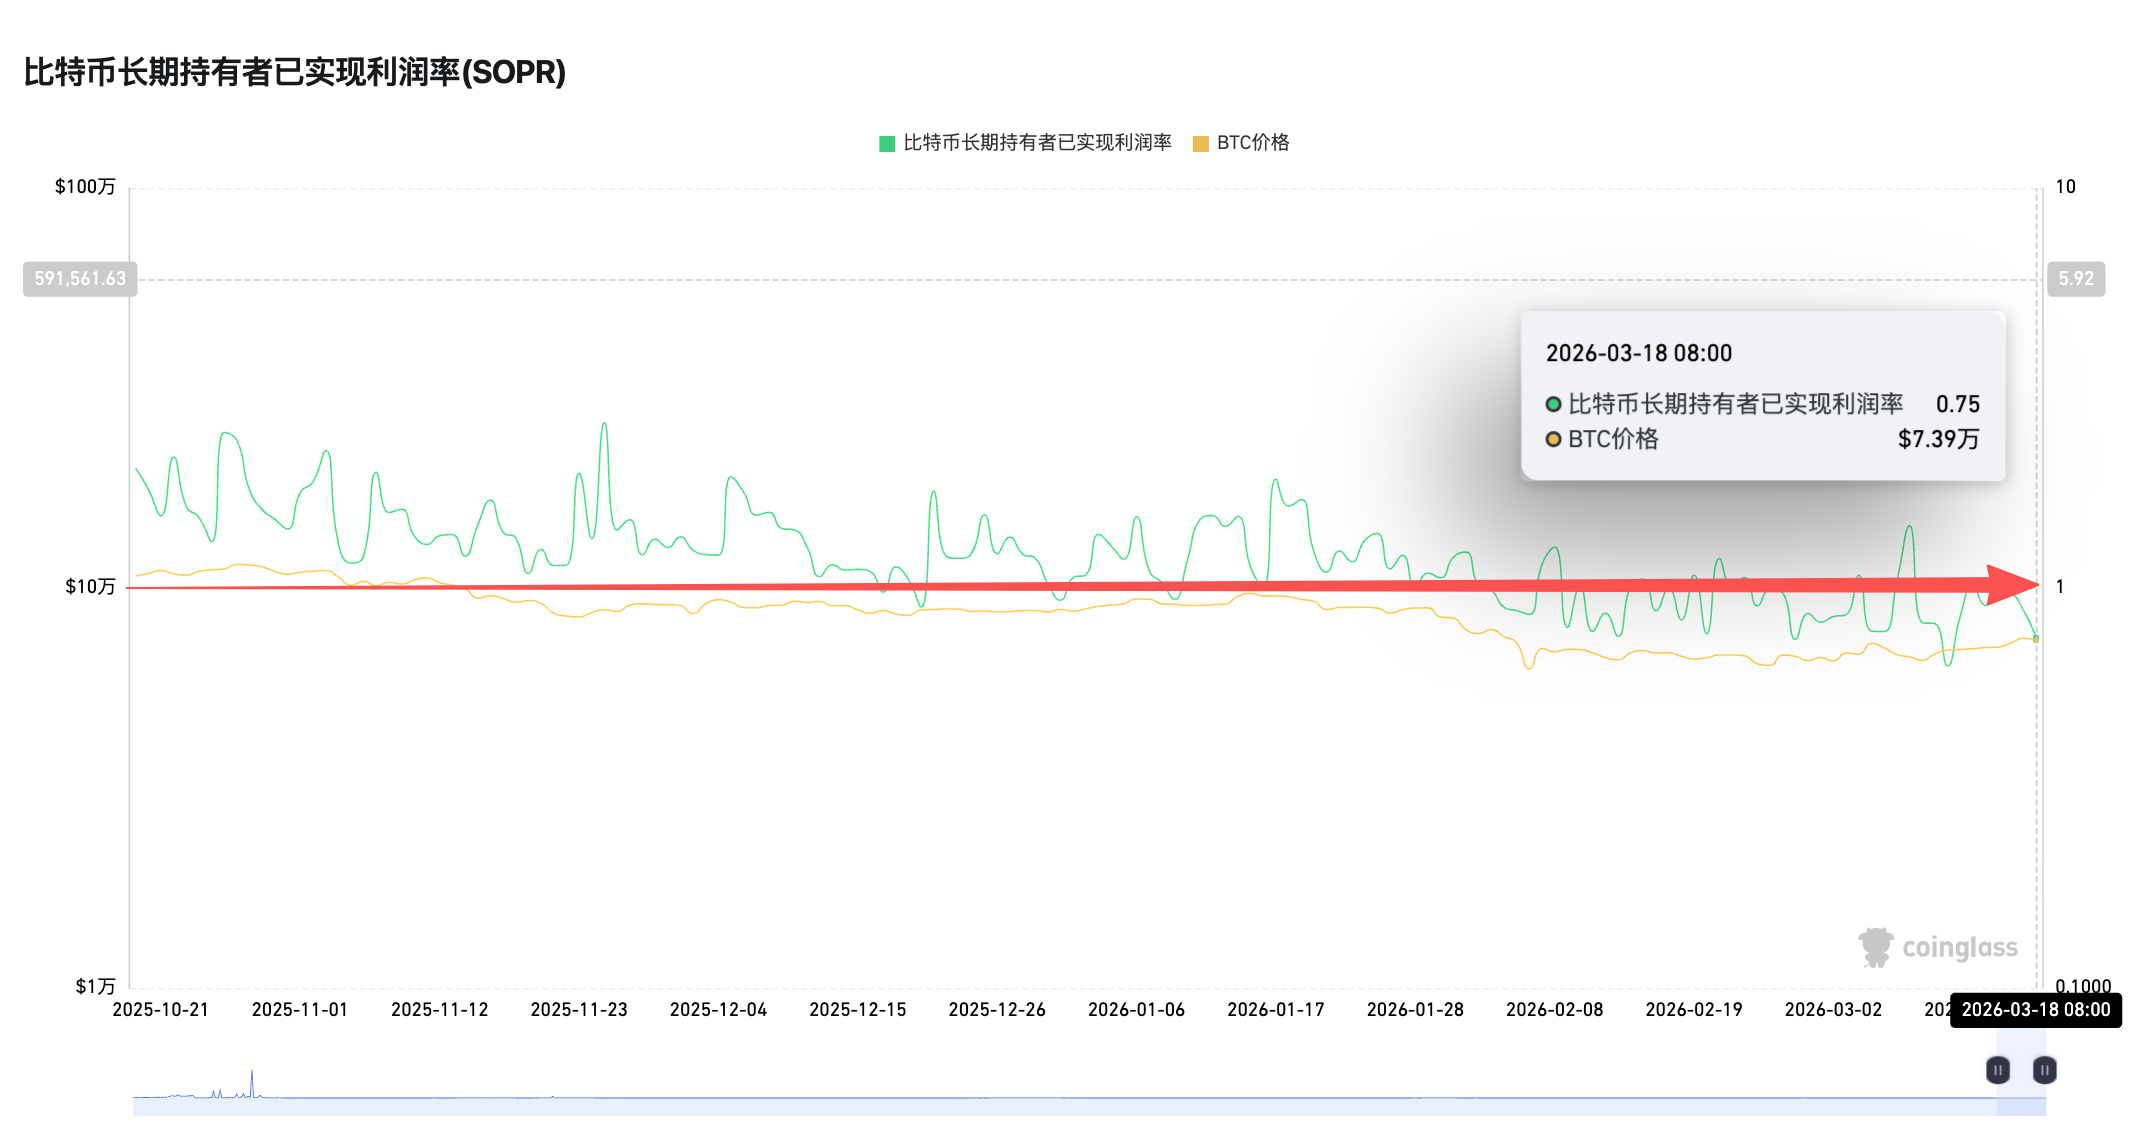
Indicator 3: SOPR, STH-SOPR consistently below 1, LTH-SOPR consistently between 0.75-1
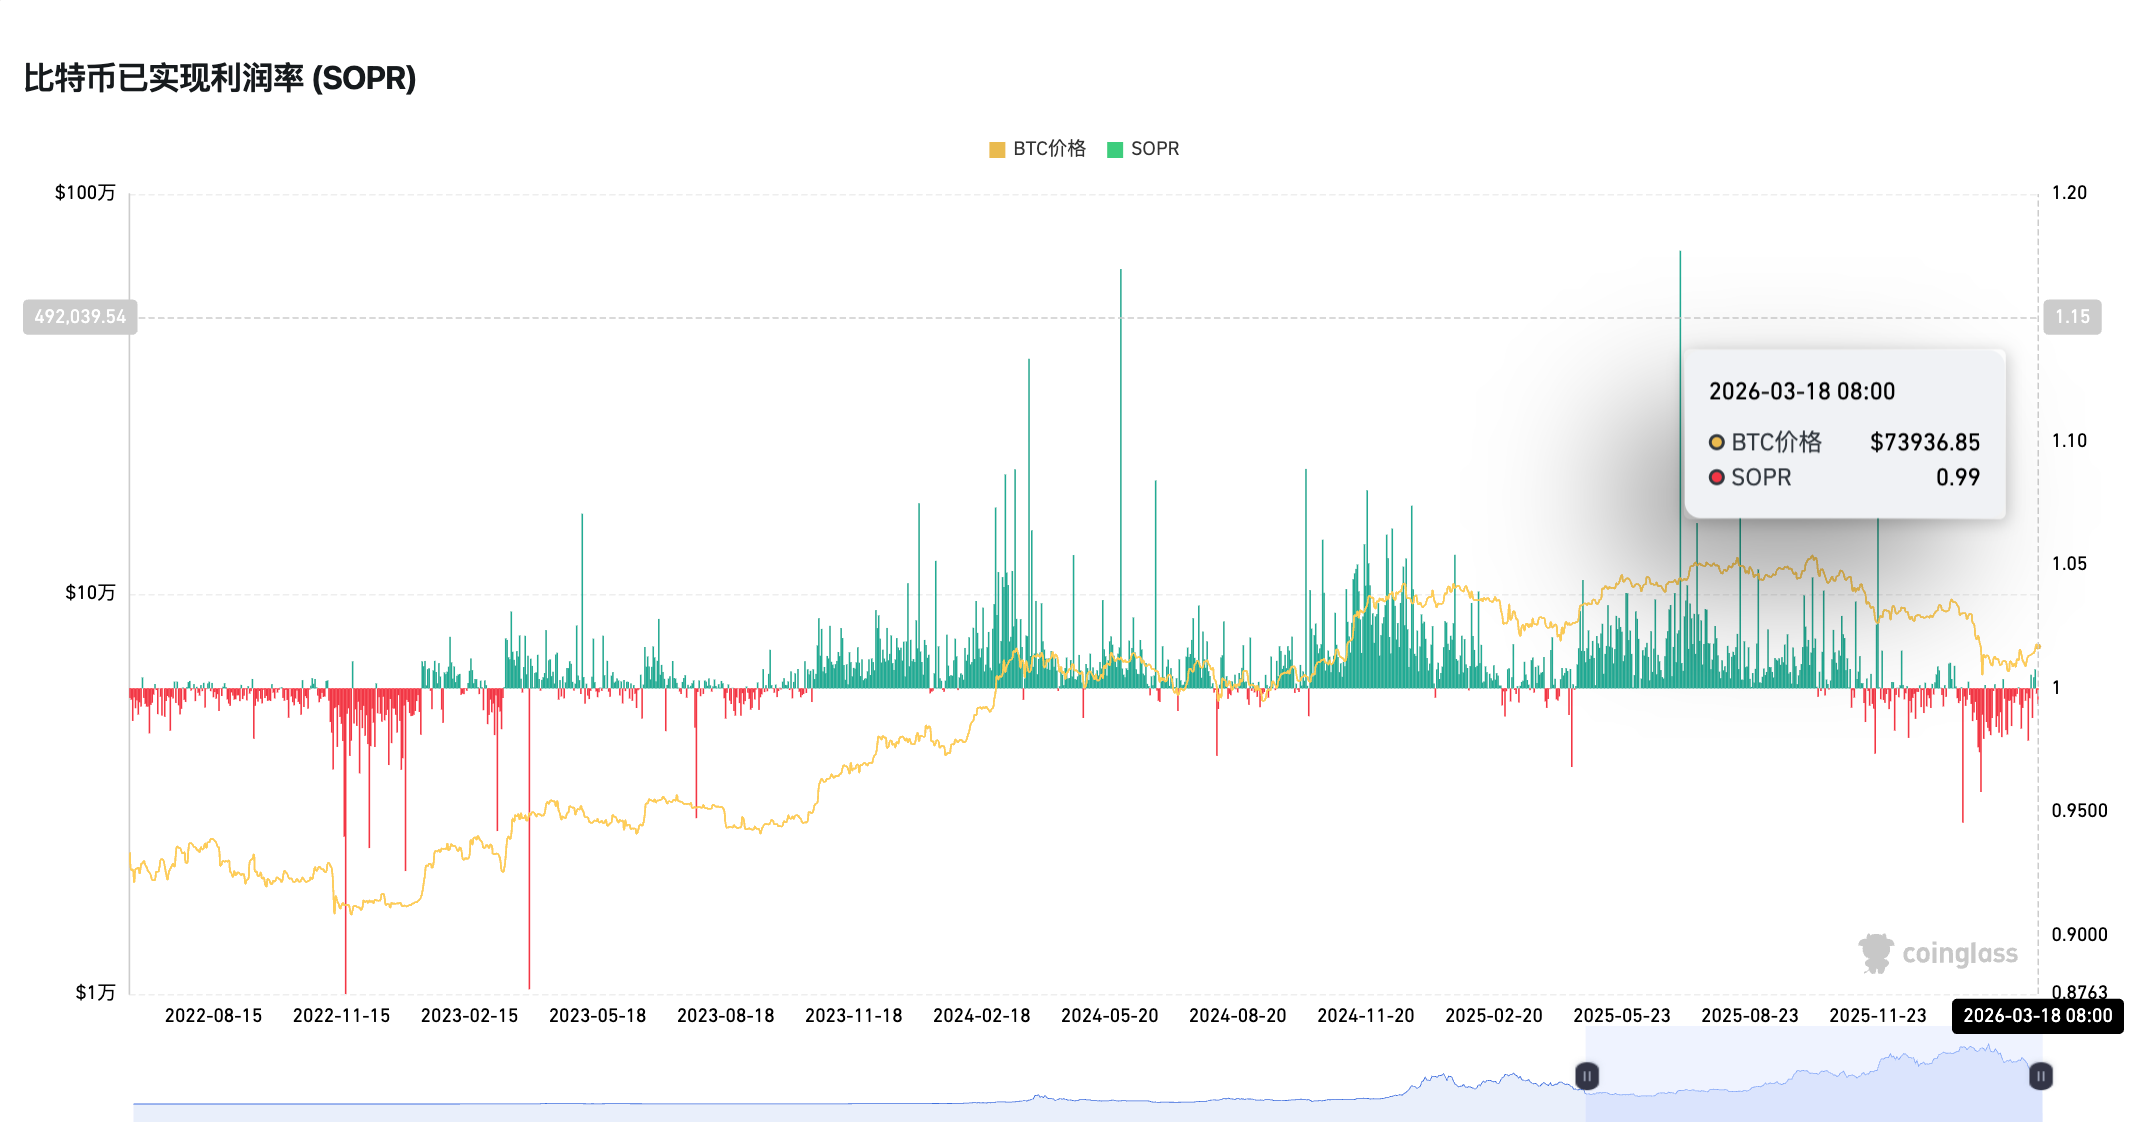
SOPR (Spent Output Profit Ratio) is typically used to measure the average profit/loss ratio of chips moved on-chain, with LTH-SOPR focusing on long-term holders who have held for more than 155 days. LTH-SOPR falling below 1 usually represents old chips starting to stop loss and sell, historically corresponding to the bottom of a deep bear market.

In February, Bitfinex published an analysis report pointing out that on-chain indicators showed the adjusted SOPR (Spent Output Profit Ratio) had fallen to the 0.92–0.94 range, reflecting that most coins were transferred at a loss, and structural pressure still existed.

On March 14, the Glassnode weekly report also pointed out that the 7-day moving average of STH-SOPR was at 0.985, having been continuously below 1 for a period exceeding that since October 2025—this is a typical bear market regime characteristic. This is a significant feature of the bear market cycle. At the same time, the net position change of LTH shows that old chips are still decreasing, but the speed has significantly slowed down, switching from aggressive distribution in Q3/Q4 2025 to a more moderate profit-taking mode.

Manifestation of failure: A decline without the surrender of old chips does not constitute a traditional cycle bottom. STH-SOPR consistently below 1 confirms a bear market, but the inflection point of LTH-SOPR is the true leading indicator of the bottom.

Indicator 4: BTC Mayer Multiple, Below 0.8 for nearly 50 days
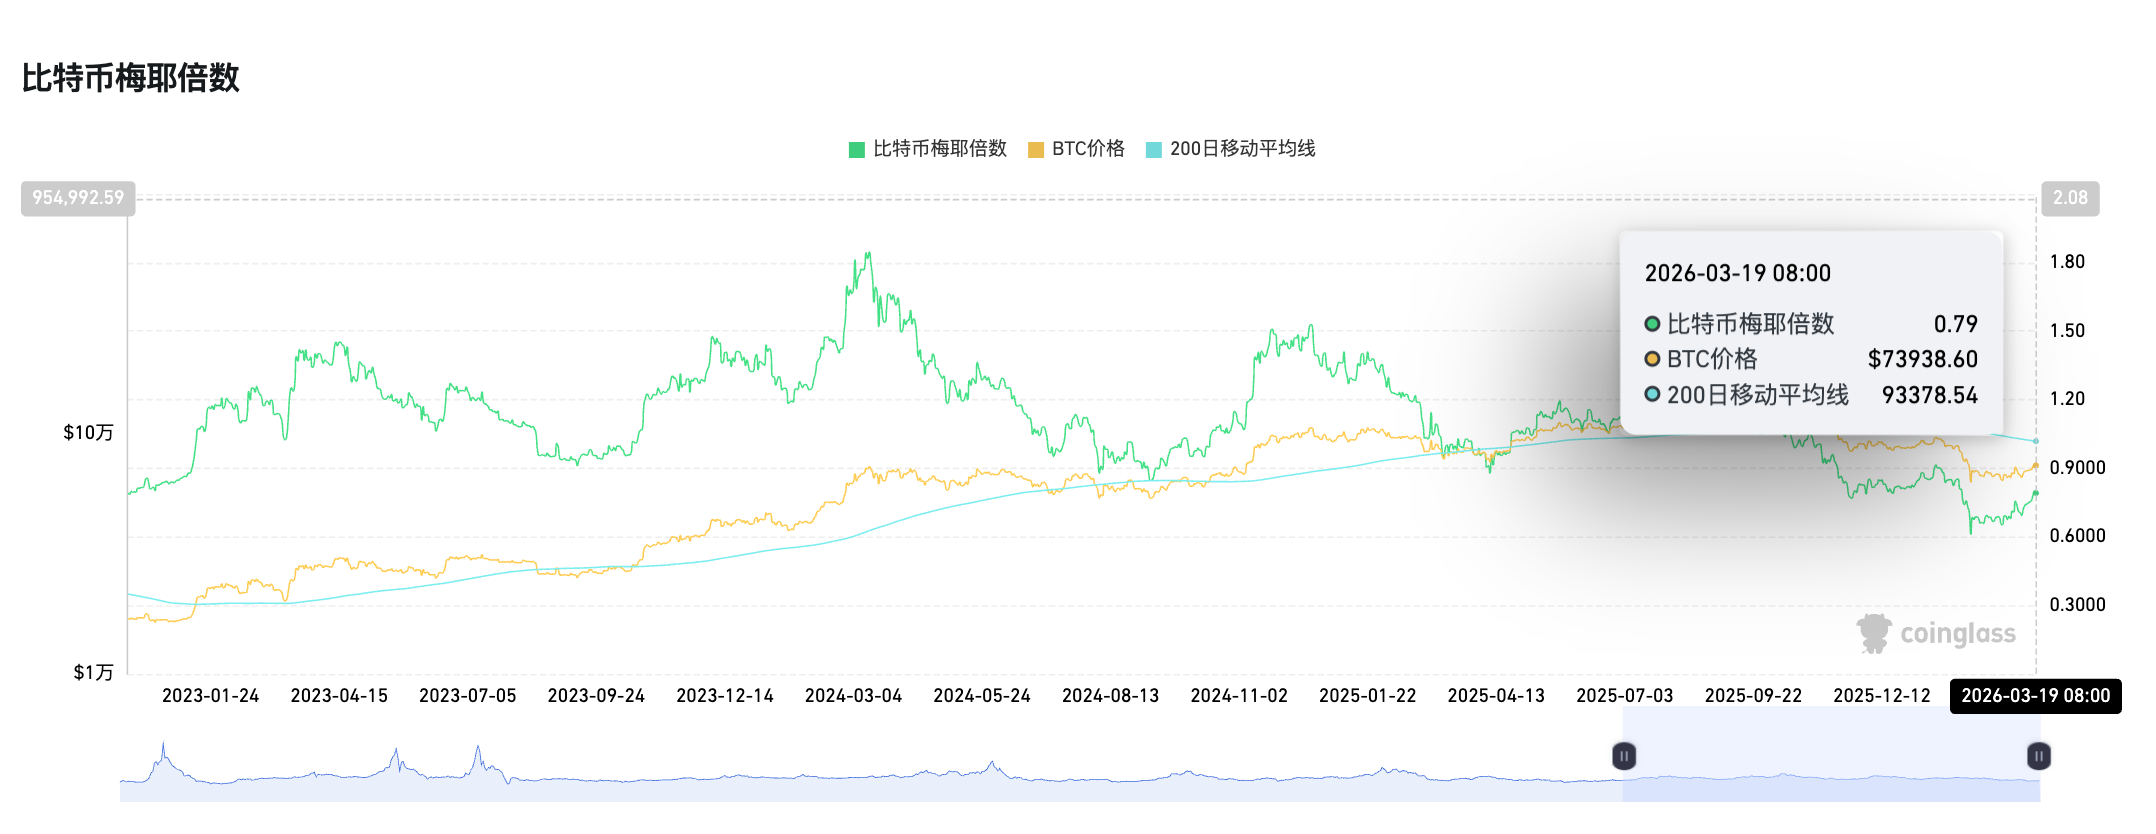
As an industry indicator derived simply by comparing BTC's current price to its 200-day moving average, the BTC Mayer Multiple, similar to the Nine God Index, has been below 0.8 for nearly 50 days. In the past, typically < 0.8 indicated a historically undervalued price range. Therefore, although this index is based only on simple price moving averages and does not rely on on-chain transaction data, being relatively less affected by institutionalization, it still struggles to constitute a sustained bottom-fishing indicator.

3 Indicators That May Reveal the Bear Market Bottom-Fishing Range: CVDD Iron Bottom, NUPL Negative Value, Stablecoin Exchange Inflow

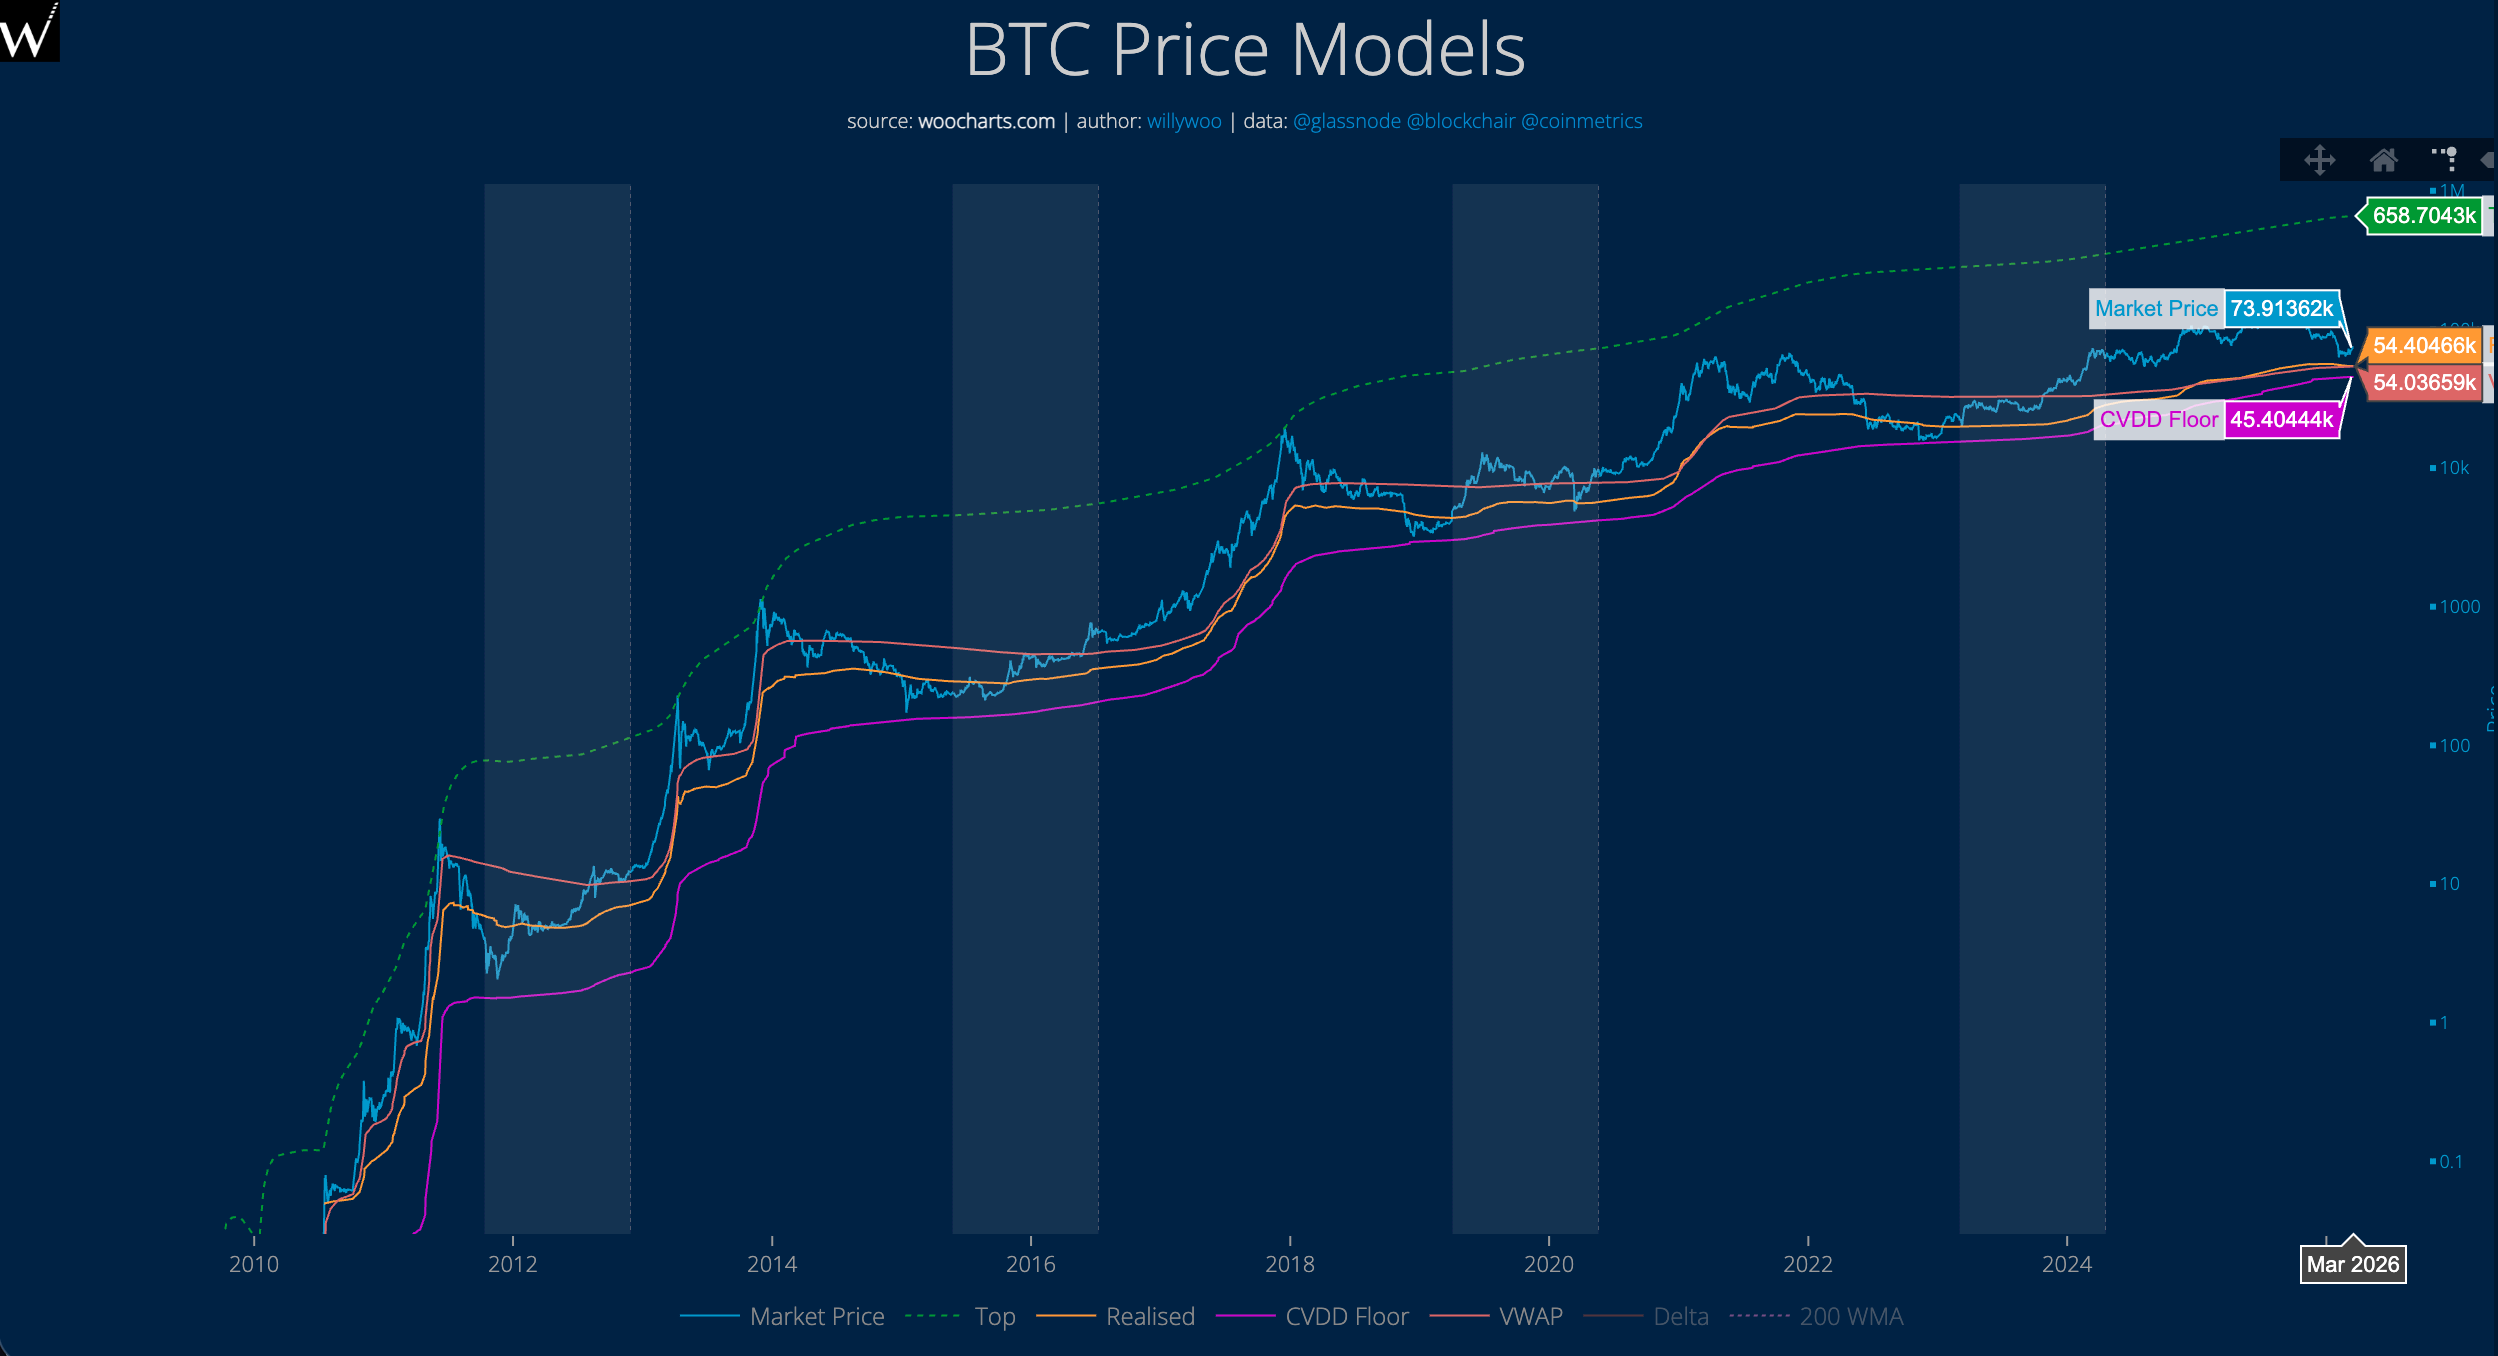
CVDD (Cumulative Value Days Destroyed): An Analyst's Personal Iron Bottom Model

This indicator was developed by crypto analyst Willy Woo to track the cumulative holding weight of BTC at different price ranges, constructing a "historical iron bottom" curve.

It is worth mentioning that this curve approached the BTC market price twice, in December 2018 and November 2022, but has never fallen below this curve to date.

Currently, the CVDD model shows the current BTC iron bottom is approximately $45,000.
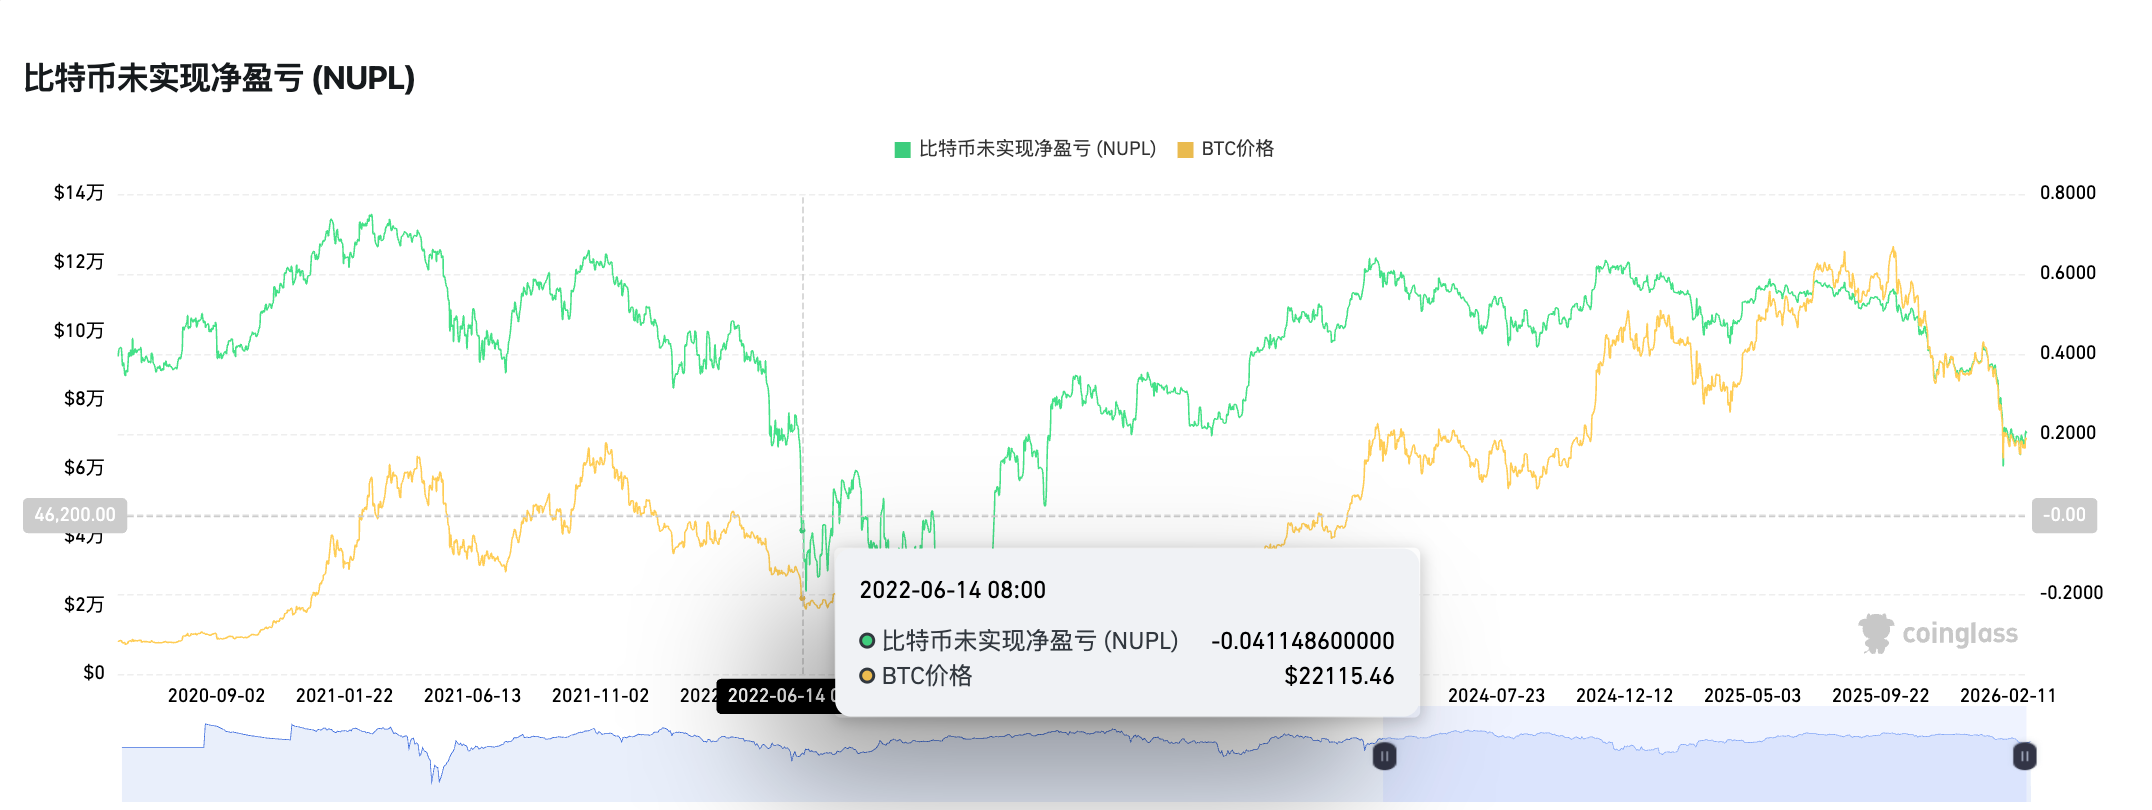
NUPL (Net Unrealized Profit/Loss): BTC Network Net Profit/Loss Value

This indicator is mainly used to measure the net value of unrealized profit and loss across the entire network. The general judgment criteria are as follows:

High NUPL (>50%): Peak driven by greed; ideal for profit-taking.

Low NUPL (<0%): Fear or capitulation; potential bottom.

It is worth mentioning that the NUPL indicator last fell into negative territory during the period from June 2022 to January 2023.

Currently, the NUPL indicator remains around 0.2.
Stablecoin Exchange Netflow: Stablecoin Net Inflow to Exchanges

This indicator is mainly used to judge whether stablecoins are flowing back to exchanges, which is a precursor signal for market buying pressure. Historically, a sustained回升 in stablecoin inflow often precedes a substantial rebound in BTC price by 2-4 weeks.

The logic behind this indicator's effectiveness is that a price rebound without stablecoin回流 is just a technically driven bounce with very low sustainability.

Currently, USDT and USDC, which account for about 80% of the stablecoin market share, are still experiencing continuous outflows, indicating that the BTC bottom is still quite some distance away.
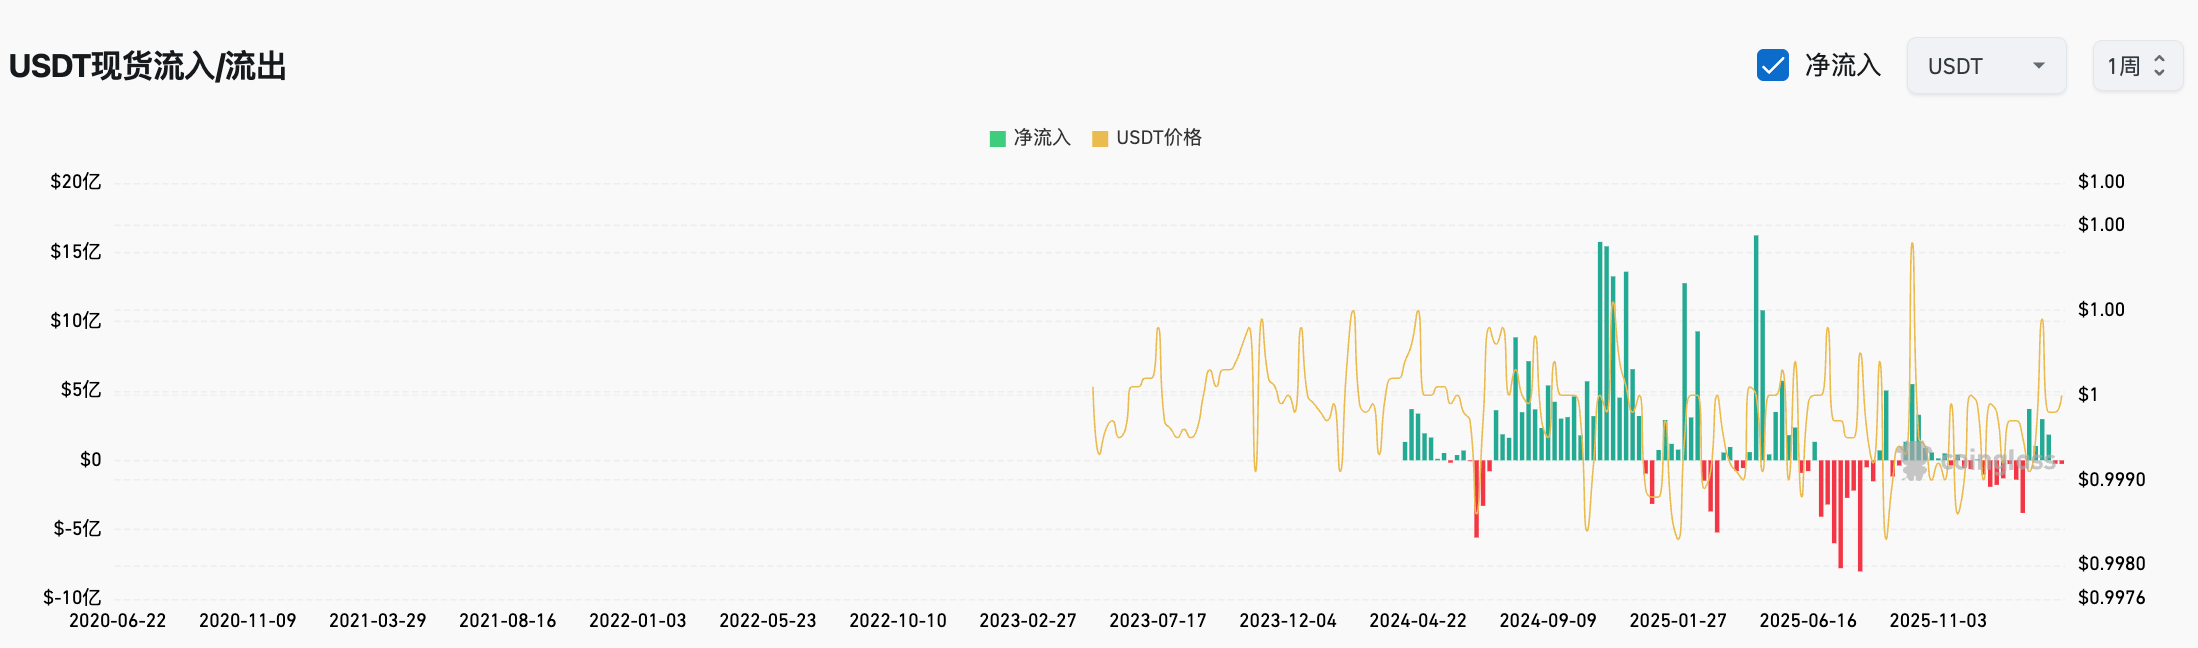
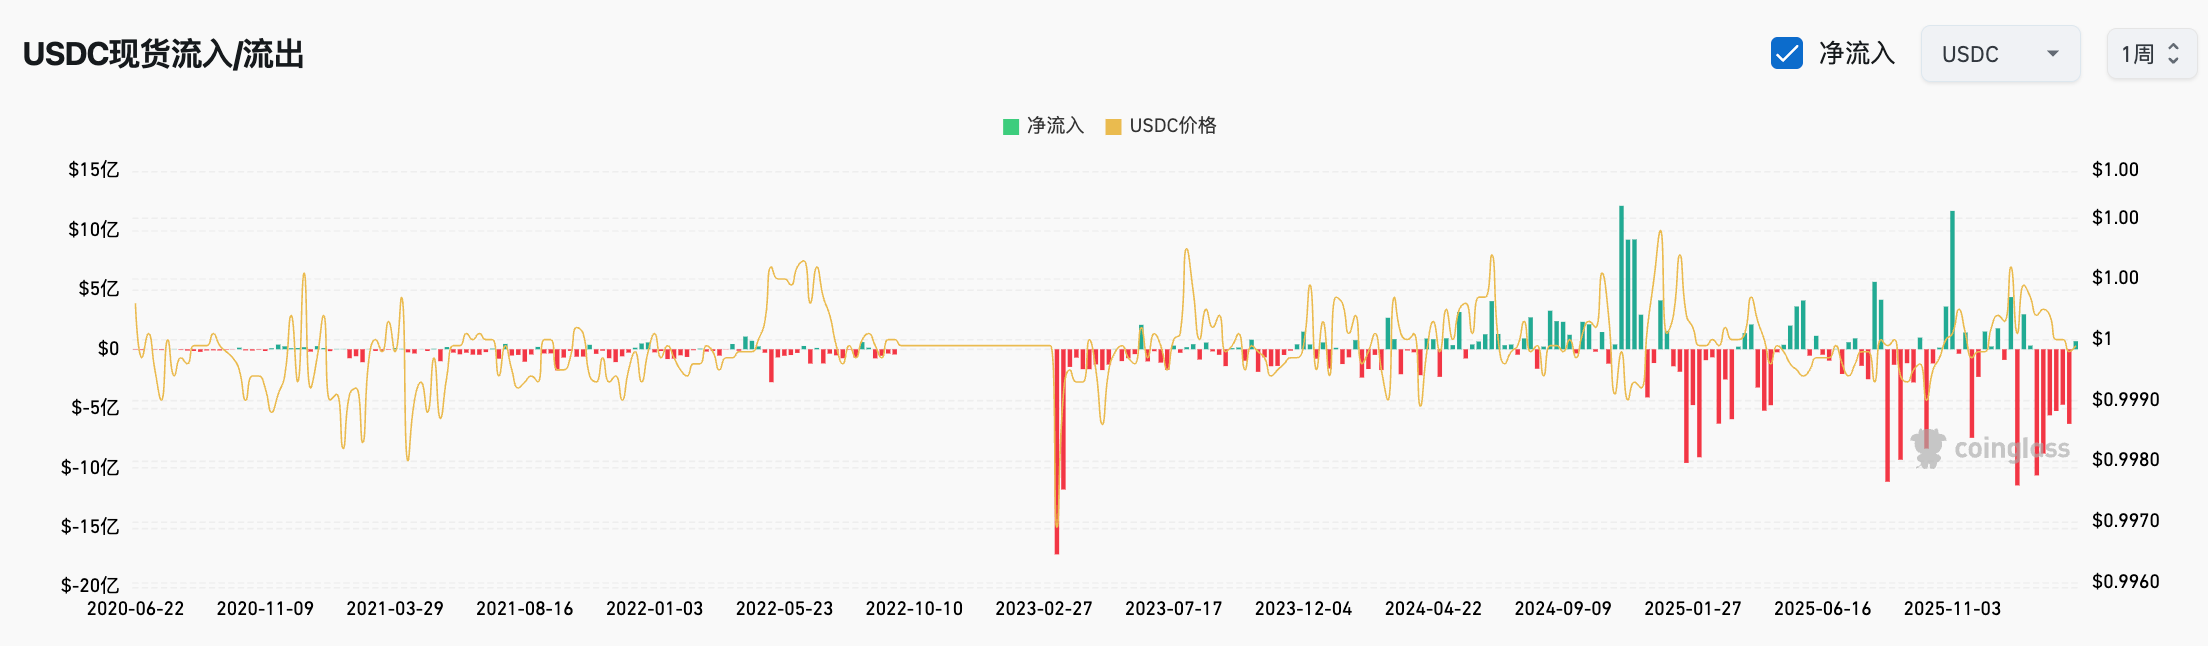
Conclusion: Buy When No One Cares, Sell When Everyone is Boisterous

At the end of the article, we must emphasize that the various indicators above are for reference only. Specific trading and investment strategies vary depending on each individual's or institution's different risk preferences, capital size, and even holding周期.

However, compared to bottom-fishing indicators, perhaps the escape indicators in the加密 industry are more flexible—just like the gold and silver that surged to everyone's attention some time ago. Once the discussion fever of BTC spreads to those around you, whether it's the grocery-shopping auntie on the subway or the hairdresser Tony, when they all start asking you about BTC, Crypto, cryptocurrency-related investments, perhaps timely selling will be the only best choice.

Hope each of us can wait for that day and start "a great retreat of our own".

Трендові криптовалюти

Пов'язані питання

QWhat are the four classic bottom-fishing indicators mentioned in the article that have become ineffective?

AThe four classic bottom-fishing indicators are MVRV Z-Score, Ahr999 Index (9 God Index), SOPR (including STH-SOPR and LTH-SOPR), and the BTC Mayer Multiple.

QAccording to the article, what is the 'iron bottom' price for BTC suggested by the CVDD model?

AThe CVDD model suggests the current 'iron bottom' for BTC is approximately $45,000.

QWhat does the NUPL indicator measure and what is its current value as stated in the article?

AThe NUPL (Net Unrealized Profit/Loss) indicator measures the net value of unrealized profit and loss across the entire Bitcoin network. Its current value is around 0.2.

QWhy has the MVRV Z-Score indicator become less effective, according to the article?

AThe MVRV Z-Score has become less effective because large-scale holdings by ETF custodians and DAT companies have systematically raised the realized value (RV), significantly increasing the denominator (standard deviation) of the Z-Score, making it extremely difficult to reproduce the historically 'extreme negative values' in the current market structure.

QWhat is the Stablecoin Exchange Netflow indicator, and what does its current trend suggest about the market bottom?

AThe Stablecoin Exchange Netflow indicator is used to judge whether stablecoins are flowing back into exchanges, which is a precursor signal for buying pressure. The article states that USDT and USDC, which account for about 80% of the stablecoin market, are still experiencing continuous outflow, suggesting the market is still some distance from the bottom.

Пов'язані матеріали

In Conversation with Ray Dalio: We Are Currently in an AI Bubble, with 1% of My Portfolio in Bitcoin

Ray Dalio, founder of Bridgewater Associates, warns in an interview that the current AI boom shows classic bubble characteristics, which could lead to significant economic downturns as seen in past cycles like 1929 or 2000. He explains that speculative enthusiasm, fueled by debt and overvaluation, often precedes a crash when rising rates or taxation force asset sales, causing widespread losses and recession. Dalio also outlines his "Big Cycle" theory, describing an approximate 80-year pattern where widening wealth gaps, massive government deficits, and shifting geopolitical power (like China's rise) create internal conflict and global instability. He emphasizes that we are in a late-cycle, transitional phase where traditional powers like the US and UK face decline. For personal wealth protection, Dalio advises diversification beyond cash into assets like stocks, bonds, real estate, and particularly gold, which he prefers over Bitcoin. While he holds about 1% of his portfolio in Bitcoin as a non-printable hard asset, he views gold as more secure from technological or governmental threats. Regarding AI's impact, Dalio believes it will disproportionately benefit capital owners, worsening inequality by replacing both physical and cognitive labor. He suggests that human intuition and emotional intelligence, combined with AI, will be key for future workers. On taxation, Dalio argues that wealth taxes are impractical and risk triggering asset sell-offs, reducing productive investment. He points to the UK as a cautionary example of debt, low productivity, and political strife. Geopolitically, Dalio foresees a more regionalized world, with the US showing weakness in prolonged conflicts like with Iran, akin to past imperial declines. The ideal outcome, he suggests, is coexisting powerful blocs (e.g., Americas, China-Asia Pacific) without major war.

marsbit1 год тому

In Conversation with Ray Dalio: We Are Currently in an AI Bubble, with 1% of My Portfolio in Bitcoin

marsbit1 год тому

Daily 7.2 Trillion KRW: Foreign Capital's Record Net Buying on Friday! Wall Street Says Headwinds for Korean Stock Fund Flows Have Subsided

South Korean stock market sees a dramatic shift in fund flows. On July 31, foreign investors made a record net purchase of approximately KRW 7.2 trillion in KOSPI stocks, marking a fundamental reversal from the persistent large-scale net outflows seen in previous months. This contributed to a significant narrowing of foreign net selling in July to KRW 9.8 trillion, down sharply from KRW 48.4 trillion in June and KRW 44.5 trillion in May. Simultaneously, domestic institutional pressure eased. South Korean pension funds and asset managers turned to a net buying position in July, purchasing KRW 1.0 trillion worth of KOSPI shares, contrasting with net sales in May and June. Market volatility is expected to be dampened by new financial regulations. Effective July 31, the Financial Services Commission tightened access for retail investors to single-stock leveraged ETFs by raising the minimum cash deposit requirement. Trading volumes for these products subsequently dropped to about 50% of their monthly average. Citigroup Research maintains its year-end KOSPI target of 10,000 points. The firm cites several supportive factors: the substantial easing of headwinds from capital outflows, a robust fundamental outlook for the semiconductor sector, historically low market valuations, strong economic fundamentals, and the potential for policy support from financial authorities if needed.

marsbit1 год тому

Daily 7.2 Trillion KRW: Foreign Capital's Record Net Buying on Friday! Wall Street Says Headwinds for Korean Stock Fund Flows Have Subsided

marsbit1 год тому

Thanks to Dice Rolls, Bitcoin Keys Are Stored Offline, But Not Everyone Will Do It

The article discusses using dice rolls to generate secure Bitcoin wallet seeds, providing entropy independent of potentially flawed hardware random number generators. It explains that each fair dice roll offers about 2.585 bits of entropy, with around 50 rolls needed for a standard 12-word seed phrase and 99+ recommended for higher security. This method gained attention after a vulnerability was revealed in some Coldcard hardware wallets, where a faulty firmware RNG (dating back to 2021) compromised generated keys. The analysis notes that while a dice-generated main seed was safe from this specific flaw, other Coldcard functions (like creating paper wallets, backup keys, or passwords) could still be vulnerable if they used the defective RNG. The piece argues that while dice-based entropy is technically robust, the manual process is error-prone, tedious, and unrealistic for most new users, who might make mistakes in recording or inputting rolls. It concludes that while manual entropy generation should remain an option for advanced users, the long-term goal is to develop reliable, user-friendly hardware and software that securely generates randomness without requiring specialized knowledge. Coldcard users are advised to check their firmware version and replace any secondary secrets (like paper wallet keys) created with vulnerable devices, while also considering multi-signature setups with devices from different manufacturers for added security.

cryptonews.ru6 год тому

Thanks to Dice Rolls, Bitcoin Keys Are Stored Offline, But Not Everyone Will Do It

cryptonews.ru6 год тому

Торгівля

Спот

Популярні статті

Як купити 4

Ласкаво просимо до HTX.com! Ми зробили покупку 4 (4) простою та зручною. Дотримуйтесь нашої покрокової інструкції, щоб розпочати свою криптовалютну подорож.Крок 1: Створіть обліковий запис на HTXВикористовуйте свою електронну пошту або номер телефону, щоб зареєструвати обліковий запис на HTX безплатно. Пройдіть безпроблемну реєстрацію й отримайте доступ до всіх функцій.ЗареєструватисьКрок 2: Перейдіть до розділу Купити крипту і виберіть спосіб оплатиКредитна/дебетова картка: використовуйте вашу картку Visa або Mastercard, щоб миттєво купити 4 (4).Баланс: використовуйте кошти з балансу вашого рахунку HTX для безперешкодної торгівлі.Треті особи: ми додали популярні способи оплати, такі як Google Pay та Apple Pay, щоб підвищити зручність.P2P: Торгуйте безпосередньо з іншими користувачами на HTX.Позабіржова торгівля (OTC): ми пропонуємо індивідуальні послуги та конкурентні обмінні курси для трейдерів.Крок 3: Зберігайте свої 4 (4)Після придбання 4 (4) збережіть його у своєму обліковому записі на HTX. Крім того, ви можете відправити його в інше місце за допомогою блокчейн-переказу або використовувати його для торгівлі іншими криптовалютами.Крок 4: Торгівля 4 (4)Легко торгуйте 4 (4) на спотовому ринку HTX. Просто увійдіть до свого облікового запису, виберіть торгову пару, укладайте угоди та спостерігайте за ними в режимі реального часу. Ми пропонуємо зручний досвід як для початківців, так і для досвідчених трейдерів.

519 переглядів усьогоОпубліковано 2025.10.20Оновлено 2026.06.02

Як купити 4

Обговорення

Ласкаво просимо до спільноти HTX. Тут ви можете бути в курсі останніх подій розвитку платформи та отримати доступ до професійної ринкової інформації. Нижче представлені думки користувачів щодо ціни 4 (4).

活动图片