Merlin Chain tăng mạnh – MERL có thể điều chỉnh giảm sau khi đạt đỉnh 75 triệu USD về OI?

ambcryptoОпубліковано о 2025-12-13Востаннє оновлено о 2025-12-13

Анотація

Merlin Chain (MERL) đã ghi nhận sự tăng trưởng mạnh với mức tăng 16% giá trị, một phần nhờ dòng thanh khoản lớn từ thị trường phái sinh, đưa Open Interest (OI) lên mức kỷ lục 75,79 triệu USD. Tỷ lệ mua/bán là 1,05 cho thấy áp lực mua ngắn hạn đang chiếm ưu thế. Số lượng holder tăng lên 173.800 và dòng tiền rút từ sàn ở mức khiêm tốn, khoảng 700.000 USD, cho thấy nhà đầu tư đang tích lũy. Tuy nhiên, chỉ báo accumulation/distribution vẫn trong vùng tiêu cực, phản ánh áp lực bán trước đó chưa được giải tỏa hoàn toàn. Bản đồ thanh khoản cho thấy các cụm thanh khoản chủ yếu nằm dưới mức giá hiện tại, cảnh báo khả năng điều chỉnh giảm ngắn hạn, trừ khi đàm tăng trưởng tiếp tục đủ mạnh để bứt phá.

Merlin Chain [MERL], giải pháp layer-2 của Bitcoin [BTC], đã ghi nhận sự gia tăng đáng kể trong hoạt động on-chain trong ngày qua, ngay cả khi giá Bitcoin phần lớn vẫn trong trạng thái đi ngang.

Tài sản này đã tăng mạnh, tăng 16% tại thời điểm biên tập, trong khi số lượng người nắm giữ token đã tăng lên 173.800. Mặc dù hiệu suất có vẻ tăng giá một cách rõ rệt, nhưng các dấu hiệu của một đợt điều chỉnh giảm giá tiềm năng vẫn lởn vởn trong cấu trúc thị trường rộng hơn.

Sự bùng nổ thanh khoản đẩy giá lên

Đợt tăng giá gần đây của MERL phần lớn có thể được cho là do dòng tiền thanh khoản chảy mạnh vào khắp thị trường phái sinh.

Open Interest (OI - Lãi mở) vĩnh viễn của MERL, một chỉ số phản ánh tổng giá trị của các hợp đồng phái sinh chưa thanh toán và thanh khoản tổng thể của thị trường, đã tăng lên mức cao kỷ lục mới là 75,79 triệu USD, tính đến thời điểm viết bài.

Đáng chú ý, mức tăng đột biến này làm nổi bật tâm lý tích cực (bullish) đang lưu hành trên thị trường. OI đã đạt đến mức này sau khi mở rộng khoảng 27 triệu USD chỉ trong một ngày.

Một dòng tiền lớn trong một ngày như vậy thường bao gồm các vị thế từ cả nhà giao dịch mua (long) và bán (short). Trong trường hợp này, dữ liệu giao dịch chỉ ra rằng các vị thế mua chi phối hoạt động thị trường.

Khối lượng giao dịch cũng đã chuyển biến tích cực rõ rệt, với Tỷ lệ Mua/Bán của Người chấp nhận (taker Buy/Sell Ratio) đạt 1,05. Chỉ số này cho thấy lệnh mua của người chấp nhận đang dẫn đầu về khối lượng tích lũy, củng cố thêm áp lực tăng giá trong ngắn hạn.

Nhà đầu tư giao ngay tham gia

Những người tham gia thị trường giao ngay (spot market) cũng tiếp tục tích lũy MERL, góp phần hạn chế nguồn cung sẵn có.

Trong bối cảnh này, dòng tiền ra khỏi các sàn giao dịch vẫn còn tương đối khiêm tốn, với khoảng 700.000 USD MERL được rút khỏi các nền tảng tập trung trong ngày qua.

Xét riêng, mức dòng ra này không xác nhận mạnh mẽ một cấu trúc thị trường tăng giá, vì số lượng vẫn còn tương đối nhỏ.

Tuy nhiên, việc tích lũy bền vững cùng với dòng ra ròng ổn định làm tăng khả năng MERL duy trì đà tăng, vì các nhà đầu tư kỳ vọng tăng giá xem các mức hiện tại là điểm vào lệnh hấp dẫn.

Đáng chú ý, chỉ báo tích lũy/phân phối (accumulation/distribution) đã nhích cao hơn, cho thấy áp lực mua mạnh hơn so với bán. Tuy nhiên, chỉ báo này vẫn ở trong vùng âm.

Chỉ số âm này cho thấy áp lực mua gần đây vẫn chưa hoàn toàn bù đắp được áp lực bán nặng nề hơn được quan sát thấy trong tuần qua, vốn đã góp phần vào đợt giảm trước đó.

Rủi ro điều chỉnh giảm?

Bất chấp những khoản lãi gần đây, MERL vẫn cho thấy rủi ro giảm giá, như được chỉ ra bởi bản đồ nhiệt thanh khoản (liquidation heatmap).

Công cụ này làm nổi bật các nồng độ thanh khoản ở trên và dưới mức giá hiện tại để báo hiệu các biến động tiềm năng. Thanh khoản được đặt ở phía trên thường kéo giá lên, trong khi các cụm ở bên dưới gợi ý khả năng giảm khi thị trường di chuyển để lấp đầy những mức đó.

Hiện tại, đợt tăng của MERL đã đẩy giá lên cao hơn, xóa bỏ các vùng thanh khoản chính ở bên trên. Do đó, hầu hết các cụm thanh khoản hiện nằm bên dưới phạm vi giao dịch hiện tại.

Dựa trên hành vi thị trường cổ điển, thiết lập này làm tăng khả năng điều chỉnh giảm trong ngắn hạn. Tuy nhiên, những kết quả như vậy không được đảm bảo.

Một ngoại lệ quan trọng nảy sinh khi đà tăng giá tiếp tục mạnh lên, cho phép giá bất chấp các đợt hồi lại điển hình được thúc đẩy bởi thanh khoản.


Suy nghĩ cuối cùng

  • MERL đã ghi nhận dòng tiền thanh khoản khổng lồ từ thị trường phái sinh, trong khi các nhà đầu tư giao ngay tiếp tục tích lũy.
  • Bản đồ nhiệt thanh khoản cho thấy khả năng biến động giá, với các cụm thanh khoản chưa được lấp đầy nằm dưới các mức hiện tại.


Трендові криптовалюти

Пов'язані питання

QTại sao giá của Merlin Chain (MERL) lại tăng mạnh gần đây?

AGiá MERL tăng 16% chủ yếu do dòng tiền mạnh đổ vào thị trường phái sinh, với Open Interest (OI) đạt mức kỷ lục 75,79 triệu USD, phản ánh thanh khoản cao và tâm lý tích cực từ các nhà giao dịch.

QChỉ số Taker Buy/Sell Ratio của MERL cho thấy điều gì về áp lực thị trường?

ATỷ lệ Taker Buy/Sell đạt 1,05 cho thấy lệnh mua đang chiếm ưu thế, áp lực mua trong ngắn hạn mạnh hơn và củng cố xu hướng tăng giá.

QNhà đầu tư trên thị trường giao ngay (spot) đang hành động thế nào với MERL?

ANhà đầu tư spot tiếp tục tích lũy MERL, hạn chế nguồn cung sẵn có. Dòng tiền rút khỏi sàn tuy không lớn (khoảng 700.000 USD) nhưng duy trì cùng áp lực mua, hỗ trợ đà tăng.

QTại sao MERL vẫn có nguy cơ điều chỉnh giảm dù đang tăng giá?

ABản đồ thanh khoản (liquidation heatmap) cho thấy các cụm thanh khoản chưa được lấp đầy nằm dưới mức giá hiện tại, theo hành vi thị trường thông thường, điều này có thể thu hút giá giảm xuống để test các vùng đó.

QChỉ báo Accumulation/Distribution của MERL đang ở trạng thái nào?

AChỉ báo Accumulation/Distribution tăng nhẹ nhưng vẫn trong vùng âm, cho thấy áp lực mua gần đây chưa đủ để bù đắp hoàn toàn áp lực bán mạnh từ tuần trước.

Пов'язані матеріали

Playing the "Decoupling" Card Again? Domestic Optical Modules Face a Stress Test

The U.S. Federal Communications Commission (FCC) is reportedly drafting a ban on importing new models of Chinese-made optical transceiver modules, with a potential implementation target of 2026. This "decoupling" move comes as Chinese firms, led by industry leaders like Zhongji Innolight and Eoptolink, dominate the global optical module market with over 60% share, and hold an even larger position in the high-speed 800G and 1.6T segments critical for AI data centers. Market reactions were mixed: U.S. optical module stocks initially rose, while Chinese A-shares opened lower but largely recovered by the close. Analysis suggests a complete U.S. decoupling from Chinese modules faces significant hurdles. North American cloud giants (Meta, Google, Microsoft, Amazon) and NVIDIA have massive demand for high-speed modules, estimated at around 40 million units in 2026. U.S. manufacturers' combined monthly production capacity for these modules is less than one-fifth that of a single major Chinese player like Zhongji Innolight, which reported production of 23.76 million units in 2025. Chinese companies are heavily reliant on the U.S. market, with over 90% of revenue for top firms coming from overseas, primarily the U.S. However, they have begun mitigating risks by establishing assembly plants in Southeast Asia and Mexico. Industry observers note the final impact depends on whether any potential U.S. restrictions target specific companies or products based on origin. Past U.S. sanctions on Chinese tech firms have often spurred increased domestic R&D and market diversification. Despite initial stock volatility, shares of major Chinese optical module companies pared losses, indicating market belief in the sector's resilience and the practical difficulties of abruptly replacing Chinese supply.

marsbit18 хв тому

Playing the "Decoupling" Card Again? Domestic Optical Modules Face a Stress Test

marsbit18 хв тому

When the Competition in Chip Manufacturing Equipment Stops Being Just About Who Is More Advanced

The competition in chip manufacturing equipment is no longer solely about who has the most advanced technology. While performance, yield, and cost remain key, U.S. export controls are adding a critical new dimension: long-term supply chain reliability. Major chipmakers like Samsung and SK Hynix, despite having mature supply chains with leading American and European vendors, are reportedly evaluating etching equipment from China's AMEC for their Chinese factories. This move is not primarily about immediate replacement or AMEC's current capabilities. Instead, it's a risk mitigation strategy. Companies are concerned that future U.S. policies could disrupt their access to spare parts, software updates, and maintenance for existing equipment over its decade-long lifespan. For chipmakers investing billions in fabs with long planning cycles, this policy-induced uncertainty is a significant new risk. The U.S., through its controls, is inadvertently eroding the very reliability and certainty that were foundational strengths of its equipment suppliers. This creates a pivotal shift for Chinese semiconductor equipment. Previously seen largely as a "domestic replacement" option when foreign gear was unavailable, they are now being assessed as potential "contingency suppliers" by global players—even before a supply disruption occurs. This provides a crucial entry point for validation in real production lines, which is essential for iterative improvement. Chinese equipment, particularly in areas like etching, has progressed from prototypes to participating in mass production within China, gaining valuable experience. However, this does not signify full global competitiveness. Gaps remain in advanced lithography, metrology, and other key tools. The current evaluations are largely confined to foreign firms' China-based fabs, not their global procurement networks. The core change is in the decision-making framework. Efficiency-driven globalization favored single, optimal suppliers. An era of heightened geopolitical risk is forcing companies to value "replaceability." While technical prowess remains paramount, supply chain certainty is now being factored into a device's competitive equation. Ultimately, U.S. policies have not made Chinese equipment more advanced, but they have given global customers a compelling reason to start testing it. The competition has expanded: it's no longer just about who is more advanced, but also about who can be relied upon to stay.

marsbit19 хв тому

When the Competition in Chip Manufacturing Equipment Stops Being Just About Who Is More Advanced

marsbit19 хв тому

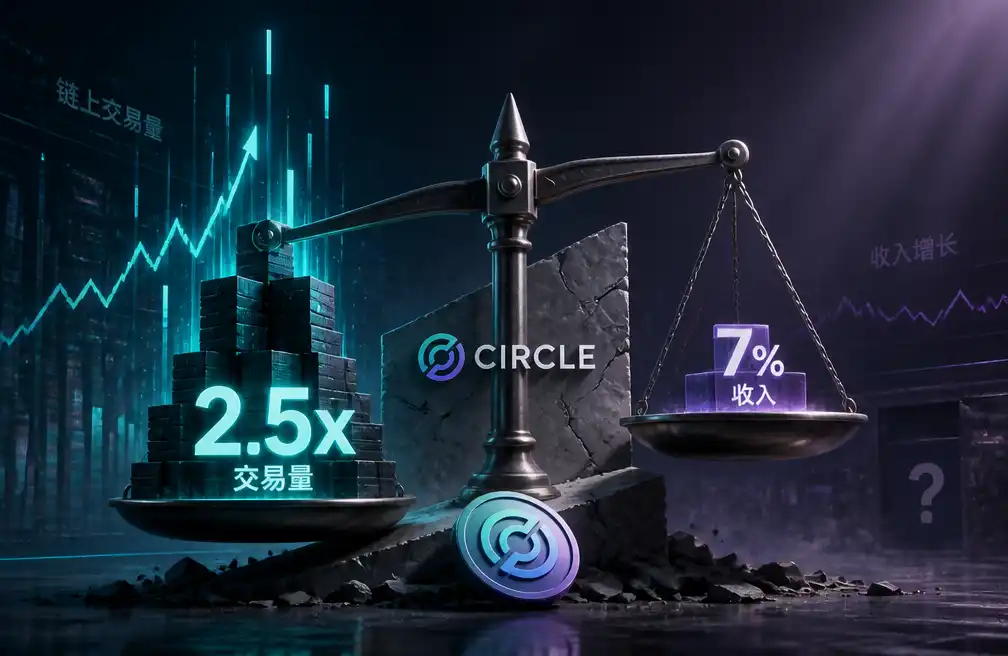
Trading Volume Increased by 2.5x, Why Did Circle's Revenue Only Grow by 7%?

Circle's Q2 performance presents a seemingly contradictory picture: the transaction volume of its stablecoin USDC surged 151% year-over-year to $14.8 trillion, while its "Total Revenue & Reserve Revenue" grew by only 7% to $701 million. This discrepancy highlights the core of Circle's business model. Revenue is primarily driven not by transaction volume, but by the average amount of USDC in circulation and the yield generated from its reserves. Key points: 1. **Revenue Drivers:** Over 90% of revenue comes from "reserve income," which is a function of average USDC circulation (up 25% YoY) and the reserve yield (which fell by 66 basis points). The net effect was a mere ~5% increase in reserve income. 2. **Transaction vs. Revenue:** High transaction volume indicates robust usage of USDC for payments and settlements, but does not translate directly to revenue. It must first convert into a sustained, average circulating balance. 3. **Cost Structure:** After accounting for distribution and other costs, the metric "Revenue Less Direct Costs" (RLDC) grew faster than total revenue, with its margin improving. However, rising operating expenses (up 23% YoY) meant that Adjusted EBITDA growth was limited to 8%. 4. **New Initiatives:** Circle reported progress on new networks like the Circle Payments Network and upcoming products (Arc, Agent Stack), but these are currently measured by adoption metrics (e.g., transaction run-rate, number of services) rather than material revenue contribution this quarter. In summary, the financial results are determined by the interplay of USDC circulation, reserve yields, and cost structures, while high transaction volume signals underlying network strength that has not yet fully flowed through to the income statement.

marsbit36 хв тому

Trading Volume Increased by 2.5x, Why Did Circle's Revenue Only Grow by 7%?

marsbit36 хв тому

Samsung China, Another Step Back

Samsung China Takes Another Step Back Samsung Electronics is further retreating from the Chinese consumer market. Following the exit of its home appliance business in May, its mobile phone division is now reportedly scaling down. Stores with monthly sales below 300,000 RMB are being closed in several cities. Data shows Samsung's smartphone market share in China has plummeted to 0.1% in Q2 2026, a stark contrast to its 22% global leadership. The decline is attributed to intense competition from domestic brands offering better value, higher specs (like faster charging), and superior localization in software and services. Samsung's premium pricing and less adapted One UI system have struggled against rivals like Huawei, Xiaomi, and Honor. This consumer electronics retreat coincides with Samsung's record-breaking semiconductor profits, driven by the AI boom. In Q2 2026, the chip division contributed nearly all operating profit, while the mobile and home appliance unit posted its first-ever operating loss. Internal dynamics, like the chip division charging market prices to the mobile unit, have increased cost pressures. Samsung's strategy now appears to be a focused retreat towards the ultra-premium segment in China, similar to its global push in high-end foldables like the Galaxy Z Fold8. The company is likely to retain only key stores in major cities to serve a niche, high-end clientele. While its deep semiconductor reserves offer a cushion, this shift away from mass-market consumer electronics reduces business diversification. The move is pragmatic but signifies a fundamental transformation; Samsung is ceding mass-market influence and betting heavily on its semiconductor strength and a narrowed premium product focus.

marsbit40 хв тому

Samsung China, Another Step Back

marsbit40 хв тому

Торгівля

Спот

Популярні статті

Як купити MERL

Ласкаво просимо до HTX.com! Ми зробили покупку Merlin chain (MERL) простою та зручною. Дотримуйтесь нашої покрокової інструкції, щоб розпочати свою криптовалютну подорож.Крок 1: Створіть обліковий запис на HTXВикористовуйте свою електронну пошту або номер телефону, щоб зареєструвати обліковий запис на HTX безплатно. Пройдіть безпроблемну реєстрацію й отримайте доступ до всіх функцій.ЗареєструватисьКрок 2: Перейдіть до розділу Купити крипту і виберіть спосіб оплатиКредитна/дебетова картка: використовуйте вашу картку Visa або Mastercard, щоб миттєво купити Merlin chain (MERL).Баланс: використовуйте кошти з балансу вашого рахунку HTX для безперешкодної торгівлі.Треті особи: ми додали популярні способи оплати, такі як Google Pay та Apple Pay, щоб підвищити зручність.P2P: Торгуйте безпосередньо з іншими користувачами на HTX.Позабіржова торгівля (OTC): ми пропонуємо індивідуальні послуги та конкурентні обмінні курси для трейдерів.Крок 3: Зберігайте свої Merlin chain (MERL)Після придбання Merlin chain (MERL) збережіть його у своєму обліковому записі на HTX. Крім того, ви можете відправити його в інше місце за допомогою блокчейн-переказу або використовувати його для торгівлі іншими криптовалютами.Крок 4: Торгівля Merlin chain (MERL)Легко торгуйте Merlin chain (MERL) на спотовому ринку HTX. Просто увійдіть до свого облікового запису, виберіть торгову пару, укладайте угоди та спостерігайте за ними в режимі реального часу. Ми пропонуємо зручний досвід як для початківців, так і для досвідчених трейдерів.

388 переглядів усьогоОпубліковано 2024.12.12Оновлено 2026.06.02

Як купити MERL

Обговорення

Ласкаво просимо до спільноти HTX. Тут ви можете бути в курсі останніх подій розвитку платформи та отримати доступ до професійної ринкової інформації. Нижче представлені думки користувачів щодо ціни MERL (MERL).

活动图片