Executive Summary
- Bitcoin has successfully broken new ATH, and is above two key accumulation zones, signalling strong bullish momentum and renewed investor confidence.
- Short-term holders are now sitting on significant unrealized profits, pushing several metrics describing this investor cohort towards overheated territory.
- We have observed the first wave of coins being spent at high profit following the ATH break-out, a behaviour which is typical during market euphoria phases.
- The Realized Profit to Loss Ratio spiked sharply, well above the 2 standard deviation threshold, before cooling off to more moderate levels later in the week.
- Historically, major market tops tend to form after multiple waves of sustained profit-taking by investors. If demand for Bitcoin remains resilient, and the market has another rally higher, the ~$130k price is the next major statistically significant resistance level.
- While bullish momentum continues, signs of demand-side stress suggest rising caution is warranted in the near term.
Above Accumulation Zones
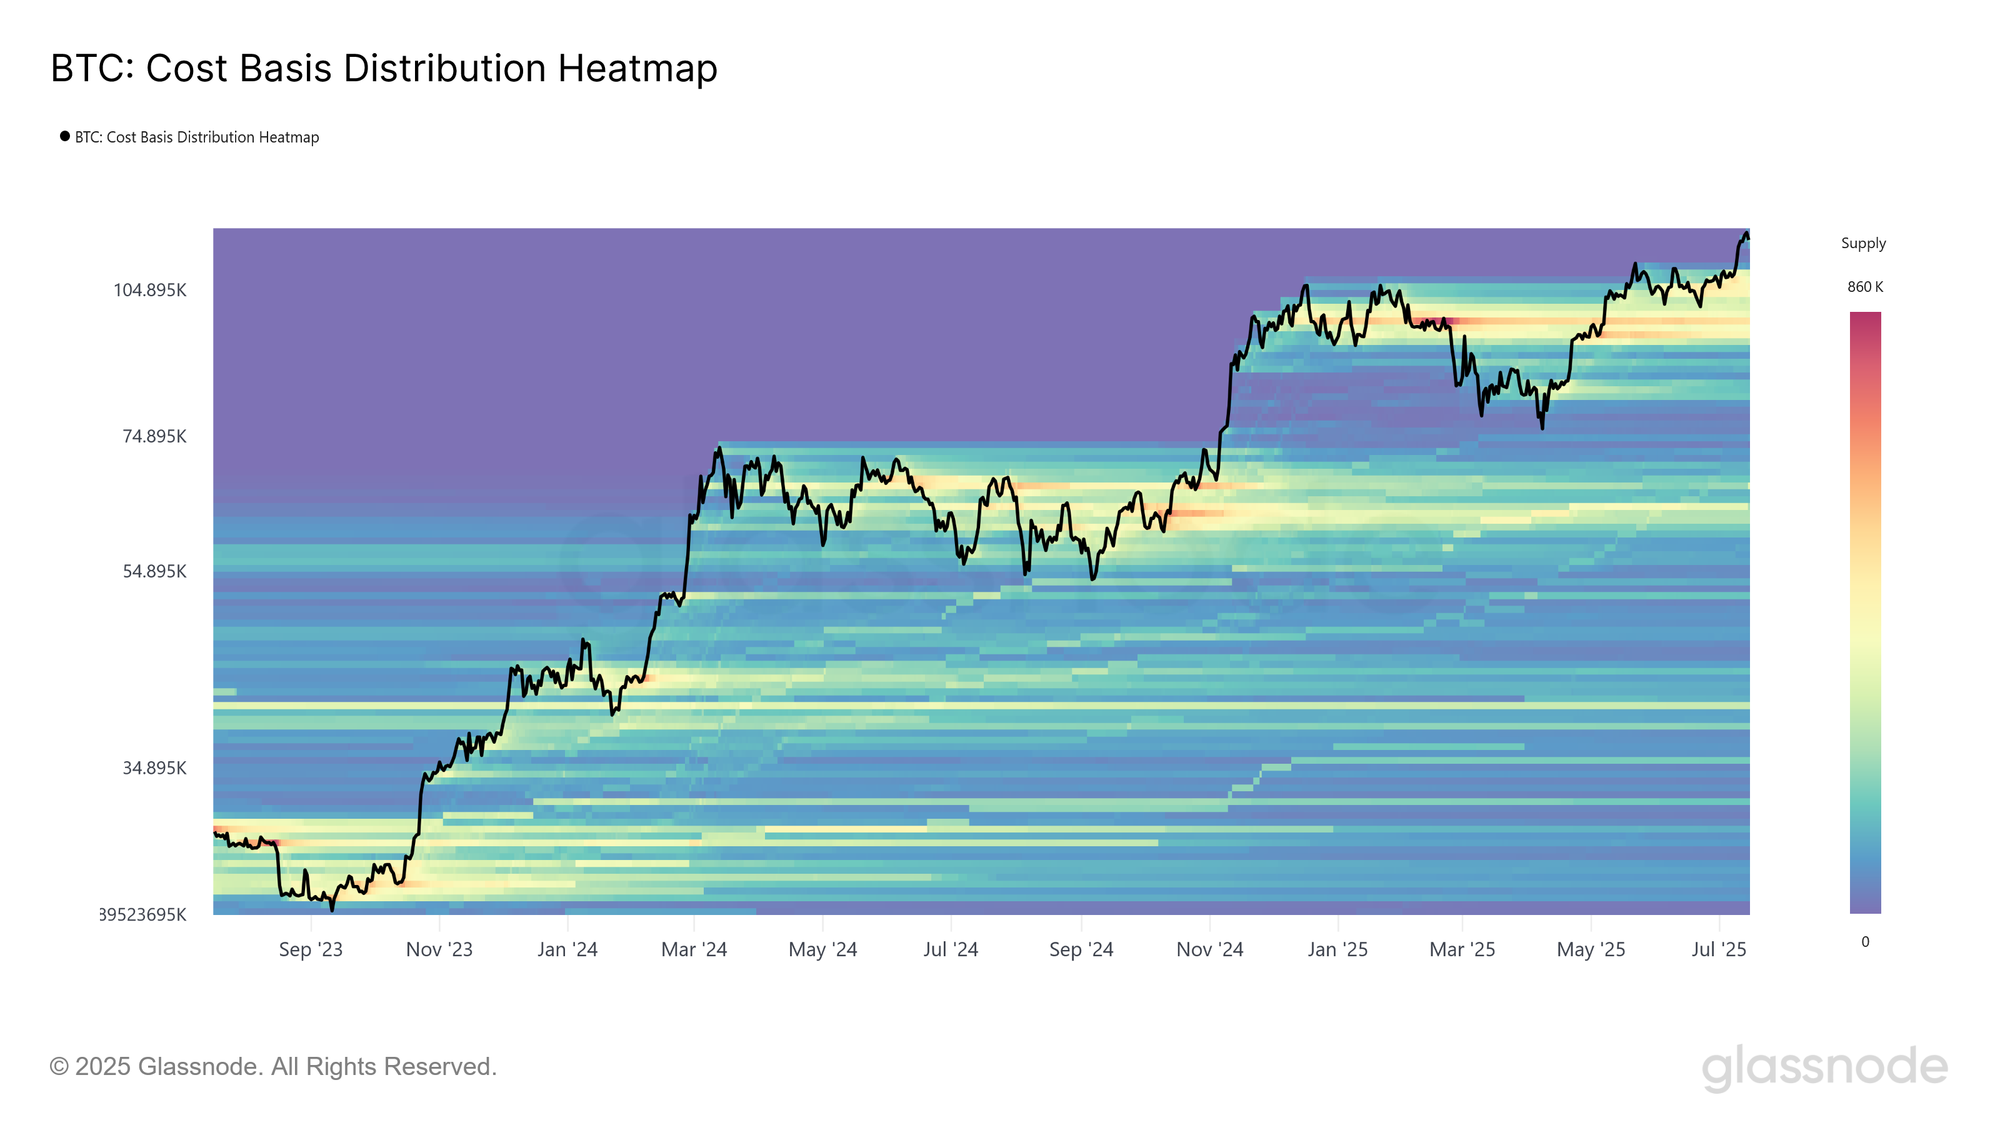
After weeks of sideways chop between $100k–$110k, Bitcoin has regained upside momentum and broken to a new ATH of $122k. According to the Cost Basis Distribution (CBD) Heatmap, this consolidation phase saw heavy accumulation in both the $93k–$97k and $104k–$110k zones.
Breaking above these dense supply clusters may now establish strong support, forming a potential foundation for future market pullbacks.
Back In Price Discovery
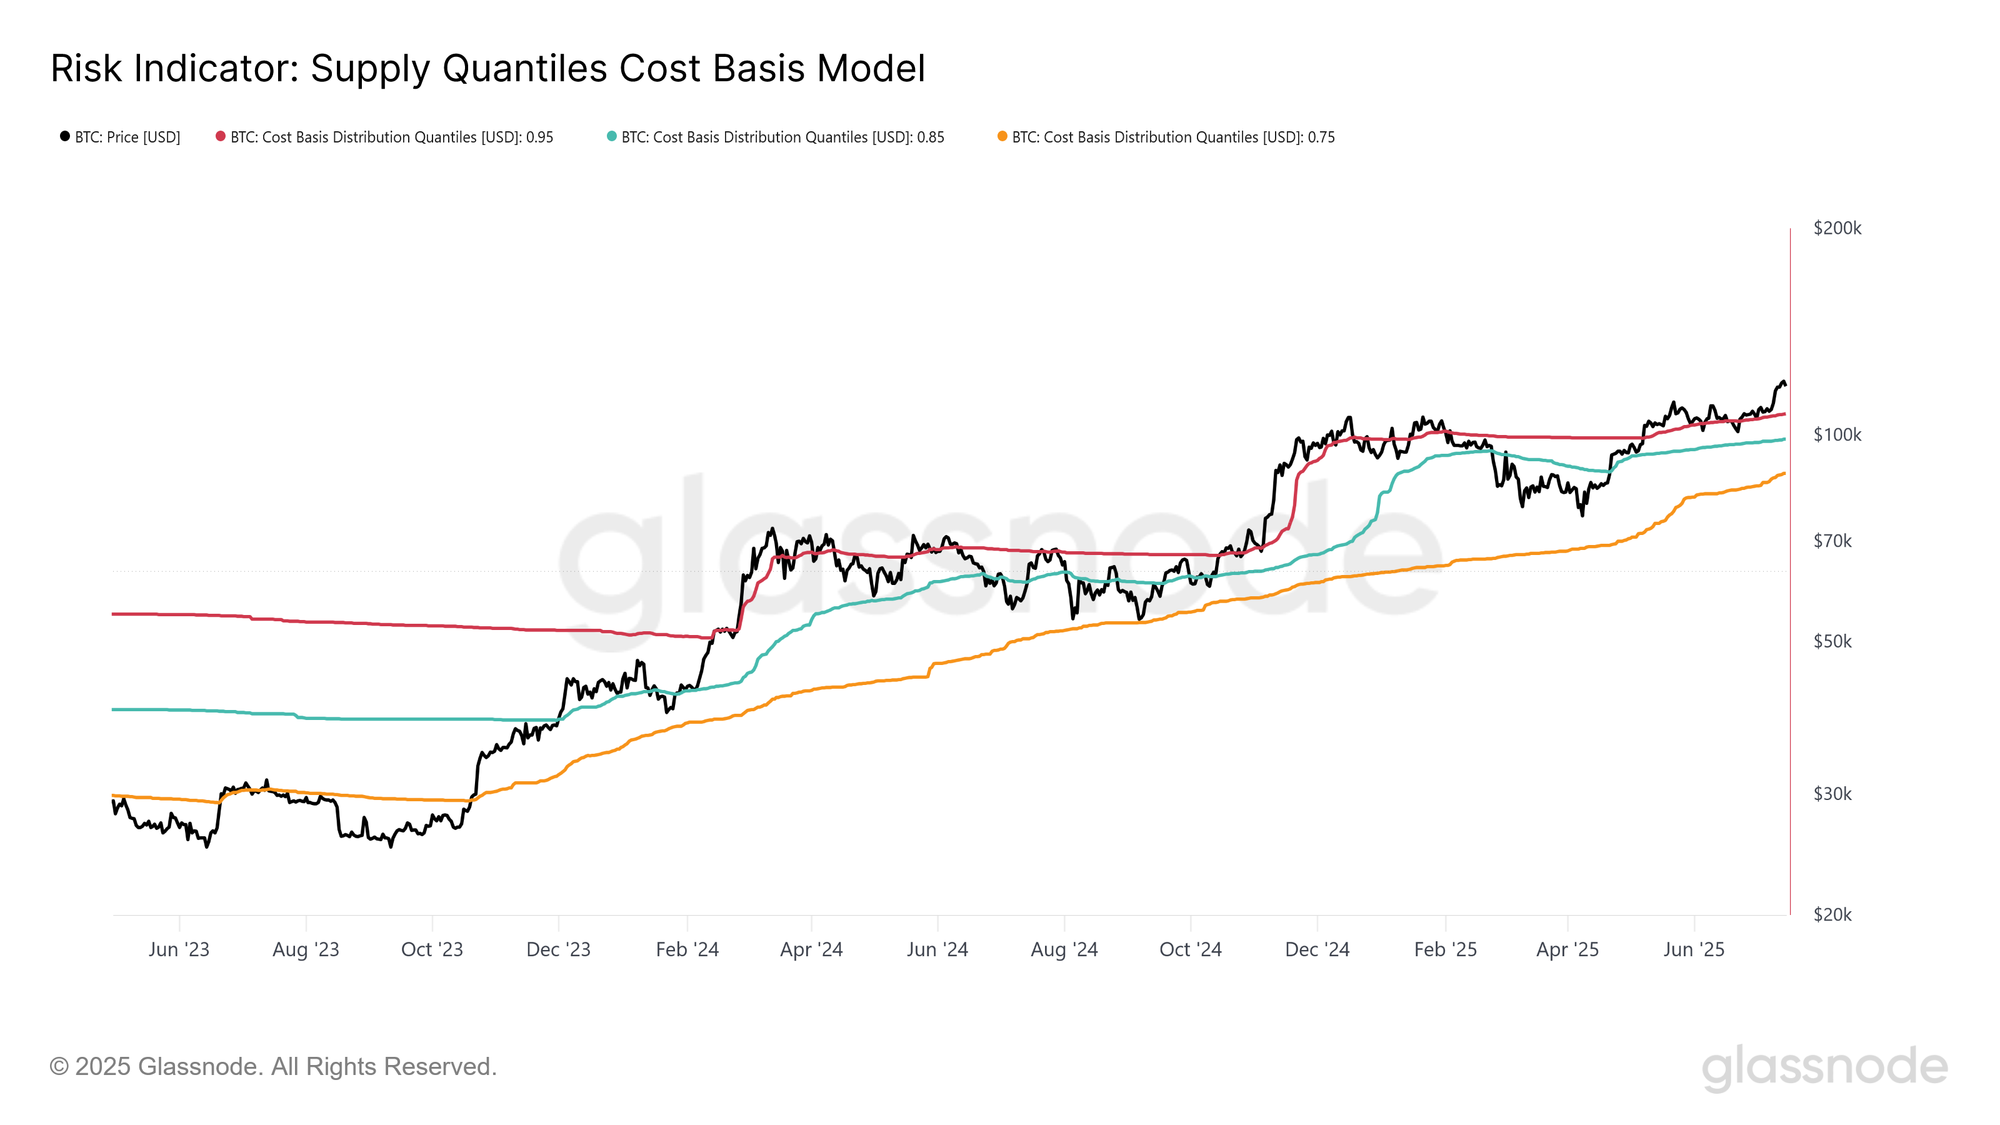
As Bitcoin enters a new phase of price discovery, the majority of the supply is now held in profit. According to the Cost Basis Distribution Quantiles, the spot price is now above the 95th percentile level at $107.4k.
This model is particularly useful for identifying potential market top formation periods. A sharp upward move above the 95th quantile often triggers heightened profit realization by an increasingly larger base of holders, which eventually leads to a redistribution of supply up to higher acquisition prices. Given enough of this sell-side activity, it can create a top-heavy structure, with many investors having an elevated cost basis, which makes for an increasingly price-sensitive investor base.
Transitioning Towards Overheated Conditions
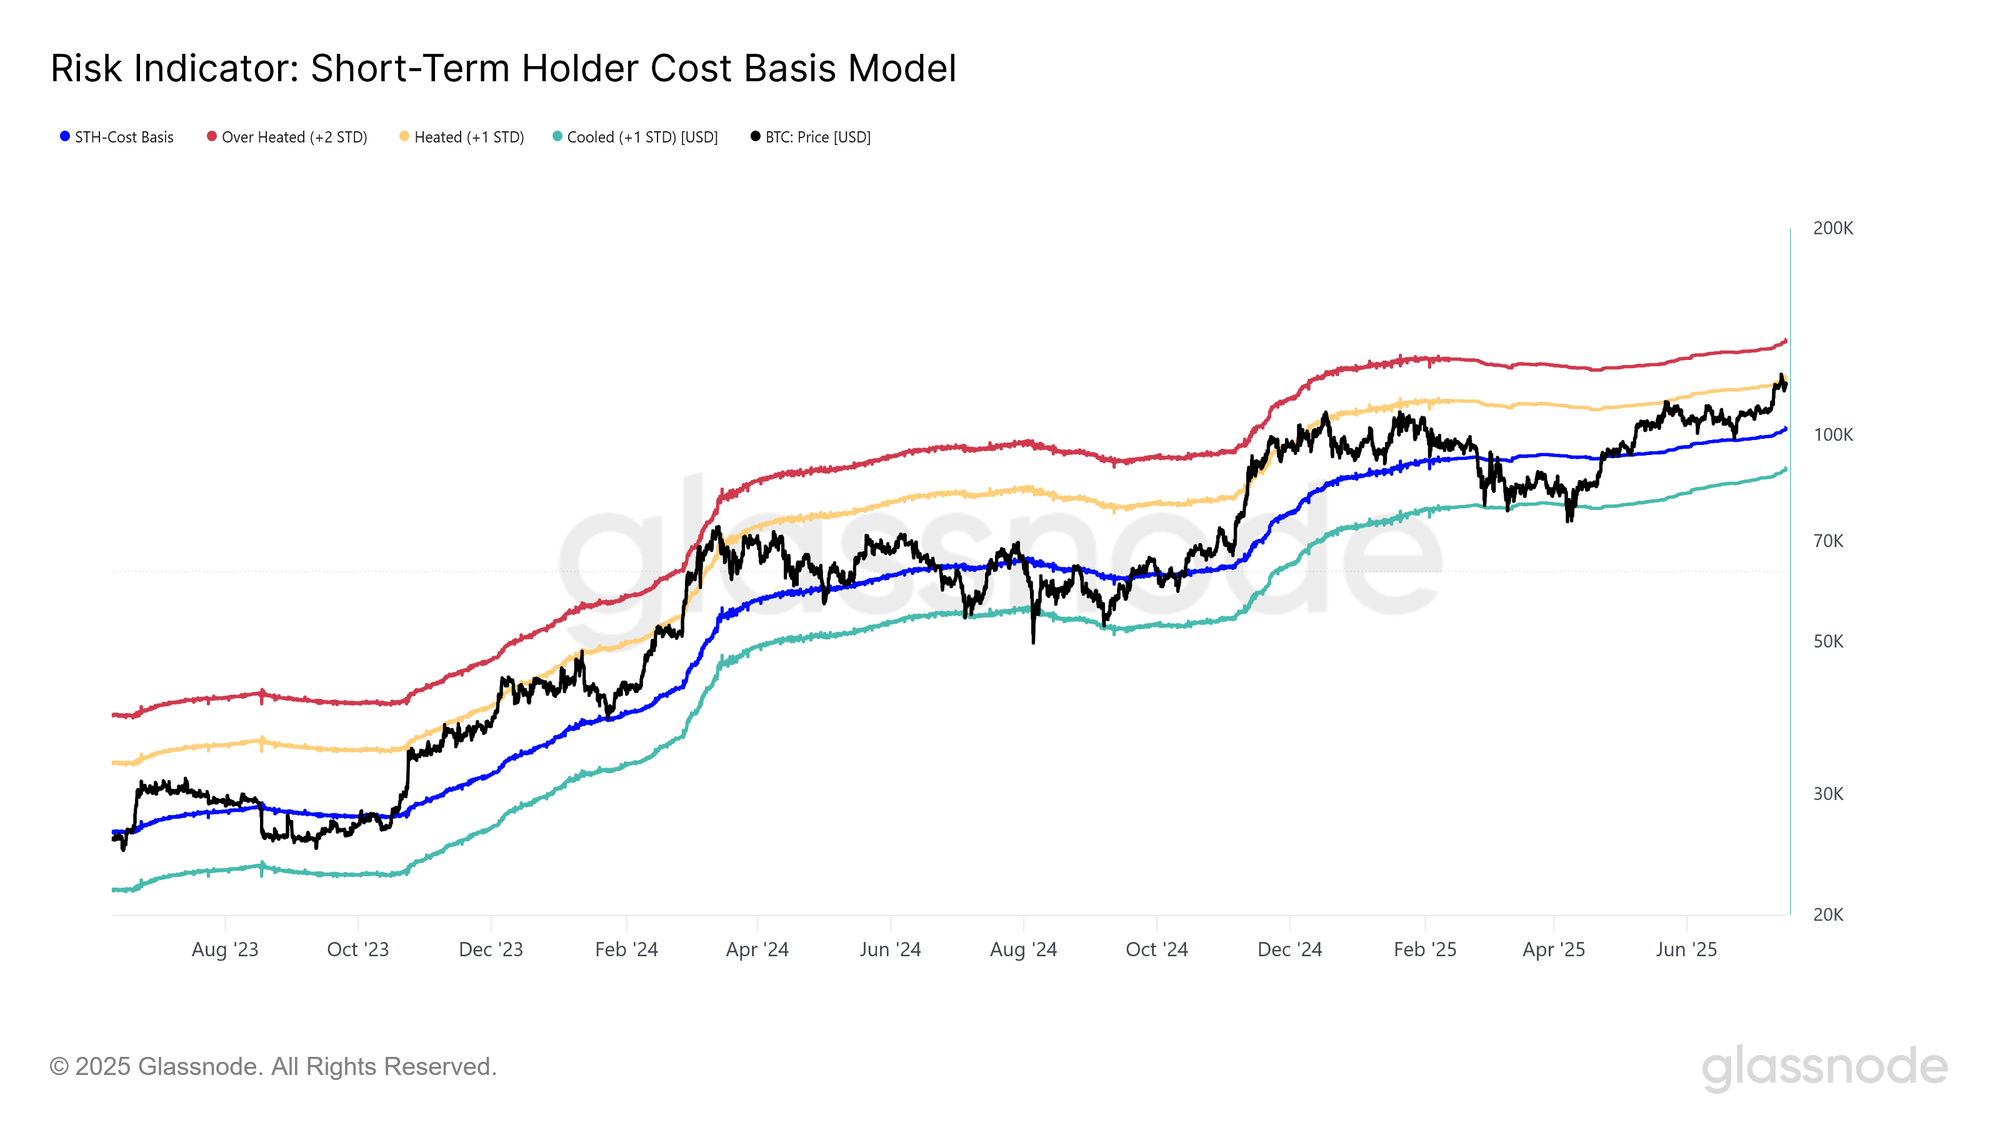
After reaching a new all-time high of $122.6k, Bitcoin prices then pulled back to $115.9k, a move that aligns with growing investor sell-side pressure into market strength. This reaction came after the market briefly rallied above $120k, which corresponds with a +1 standard deviation move above the Short-Term Holder (STH) cost basis.
Historically, this level often acts as a natural resistance, especially during periods of heightened speculative momentum. Assuming current momentum remains strong, the next key resistance lies at the +2 standard deviation band, which is currently trading around $136k.
A Compass For A Bull
Having established that the market has just entered into a near-term overheated condition, the remainder of this report will focus on key indicators that can help identify extremely high-risk market structures. Employing these metrics, we aim to outline the conditions that typically precede major tops or sharp corrections.
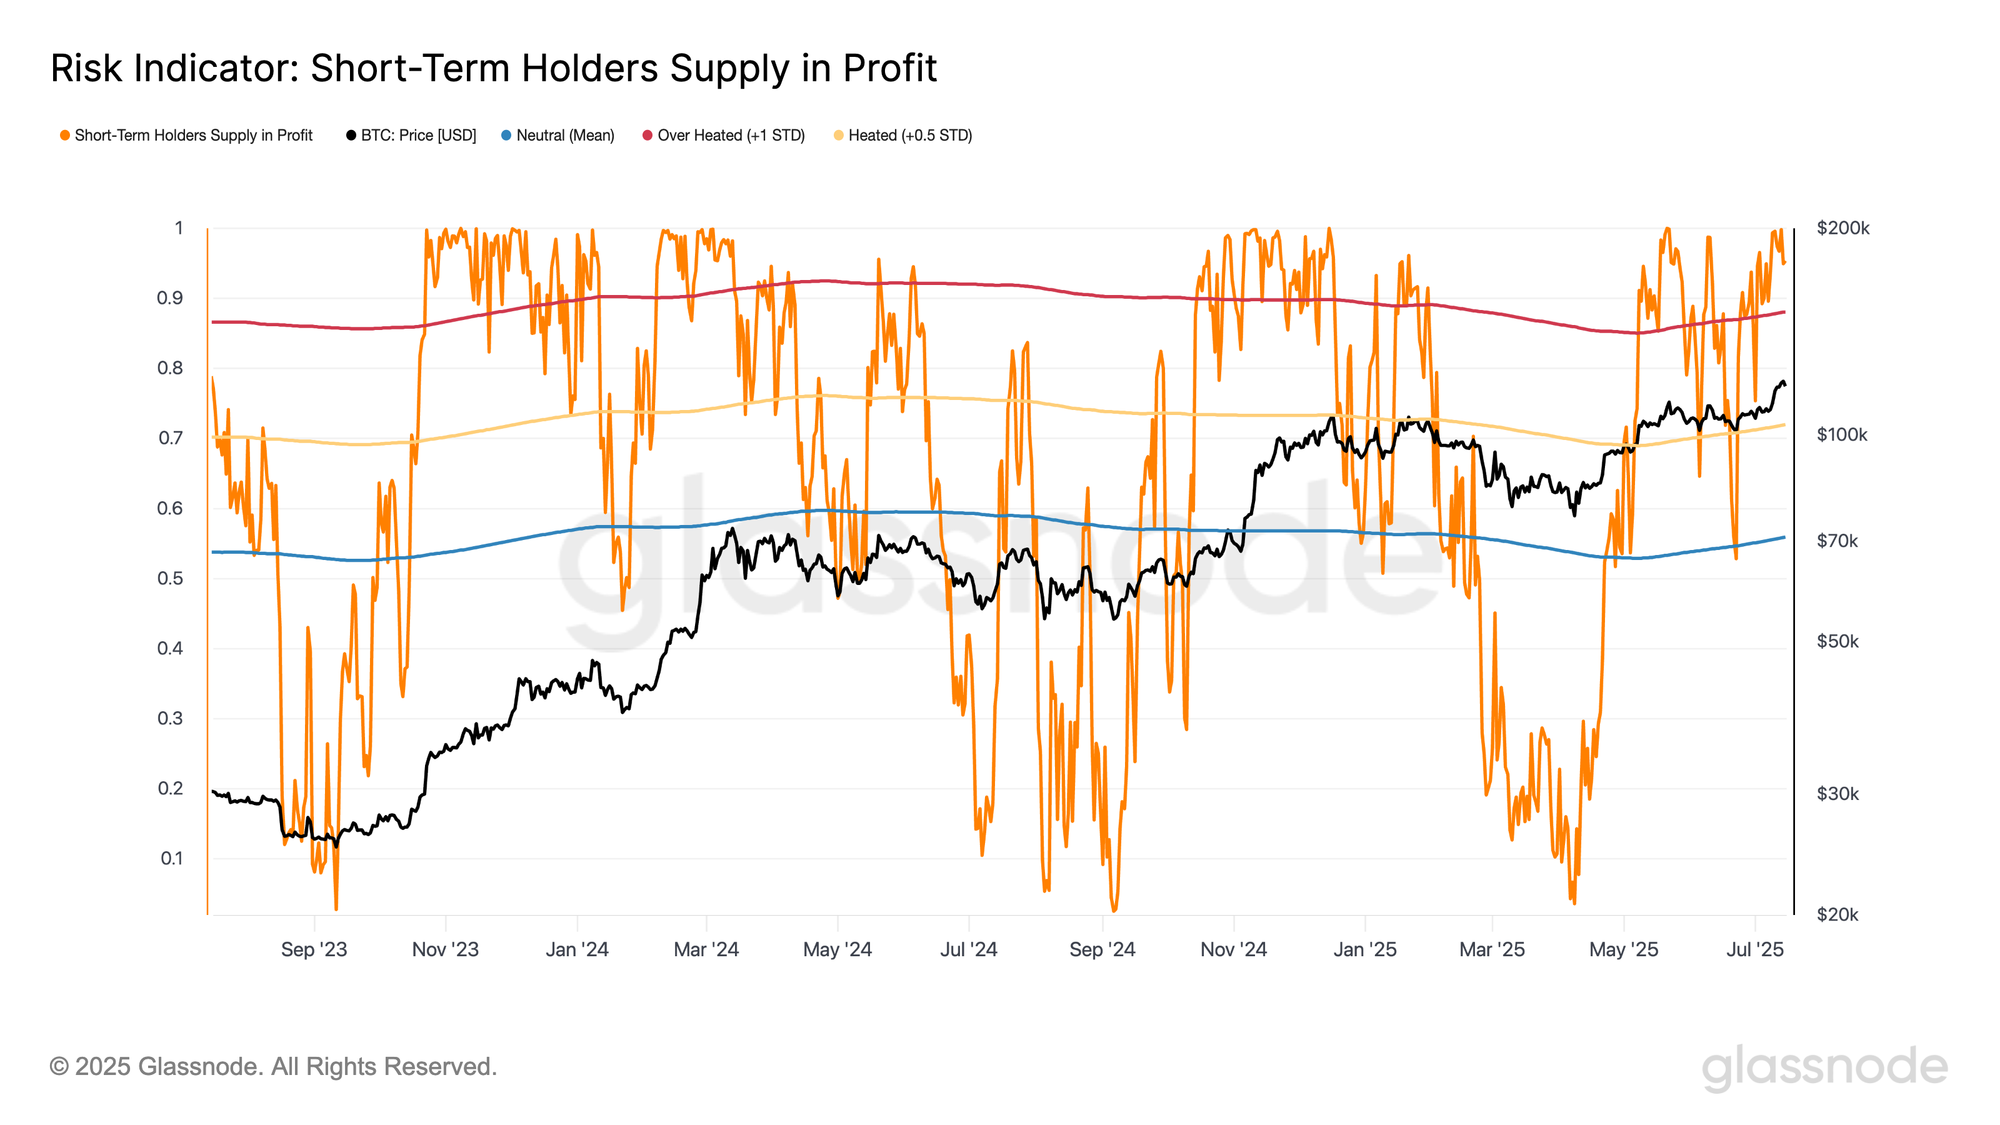
To gauge the profit dominance among recent investors, we turn to the Percent of Short-Term Holder Supply in Profit. This metric currently sits at 95%, which is more than 1 standard deviation above its long-term mean of 88%, and signals that newer market participants are enjoying a meaningful surge in unrealized profits.
This is the third breakout above this threshold since early May 2025, reinforcing the view that the market is entering a more euphoric state. If this metric begins to stabilize or decline below the 88% level, it could be an early signal of weakening demand or distribution taking hold.
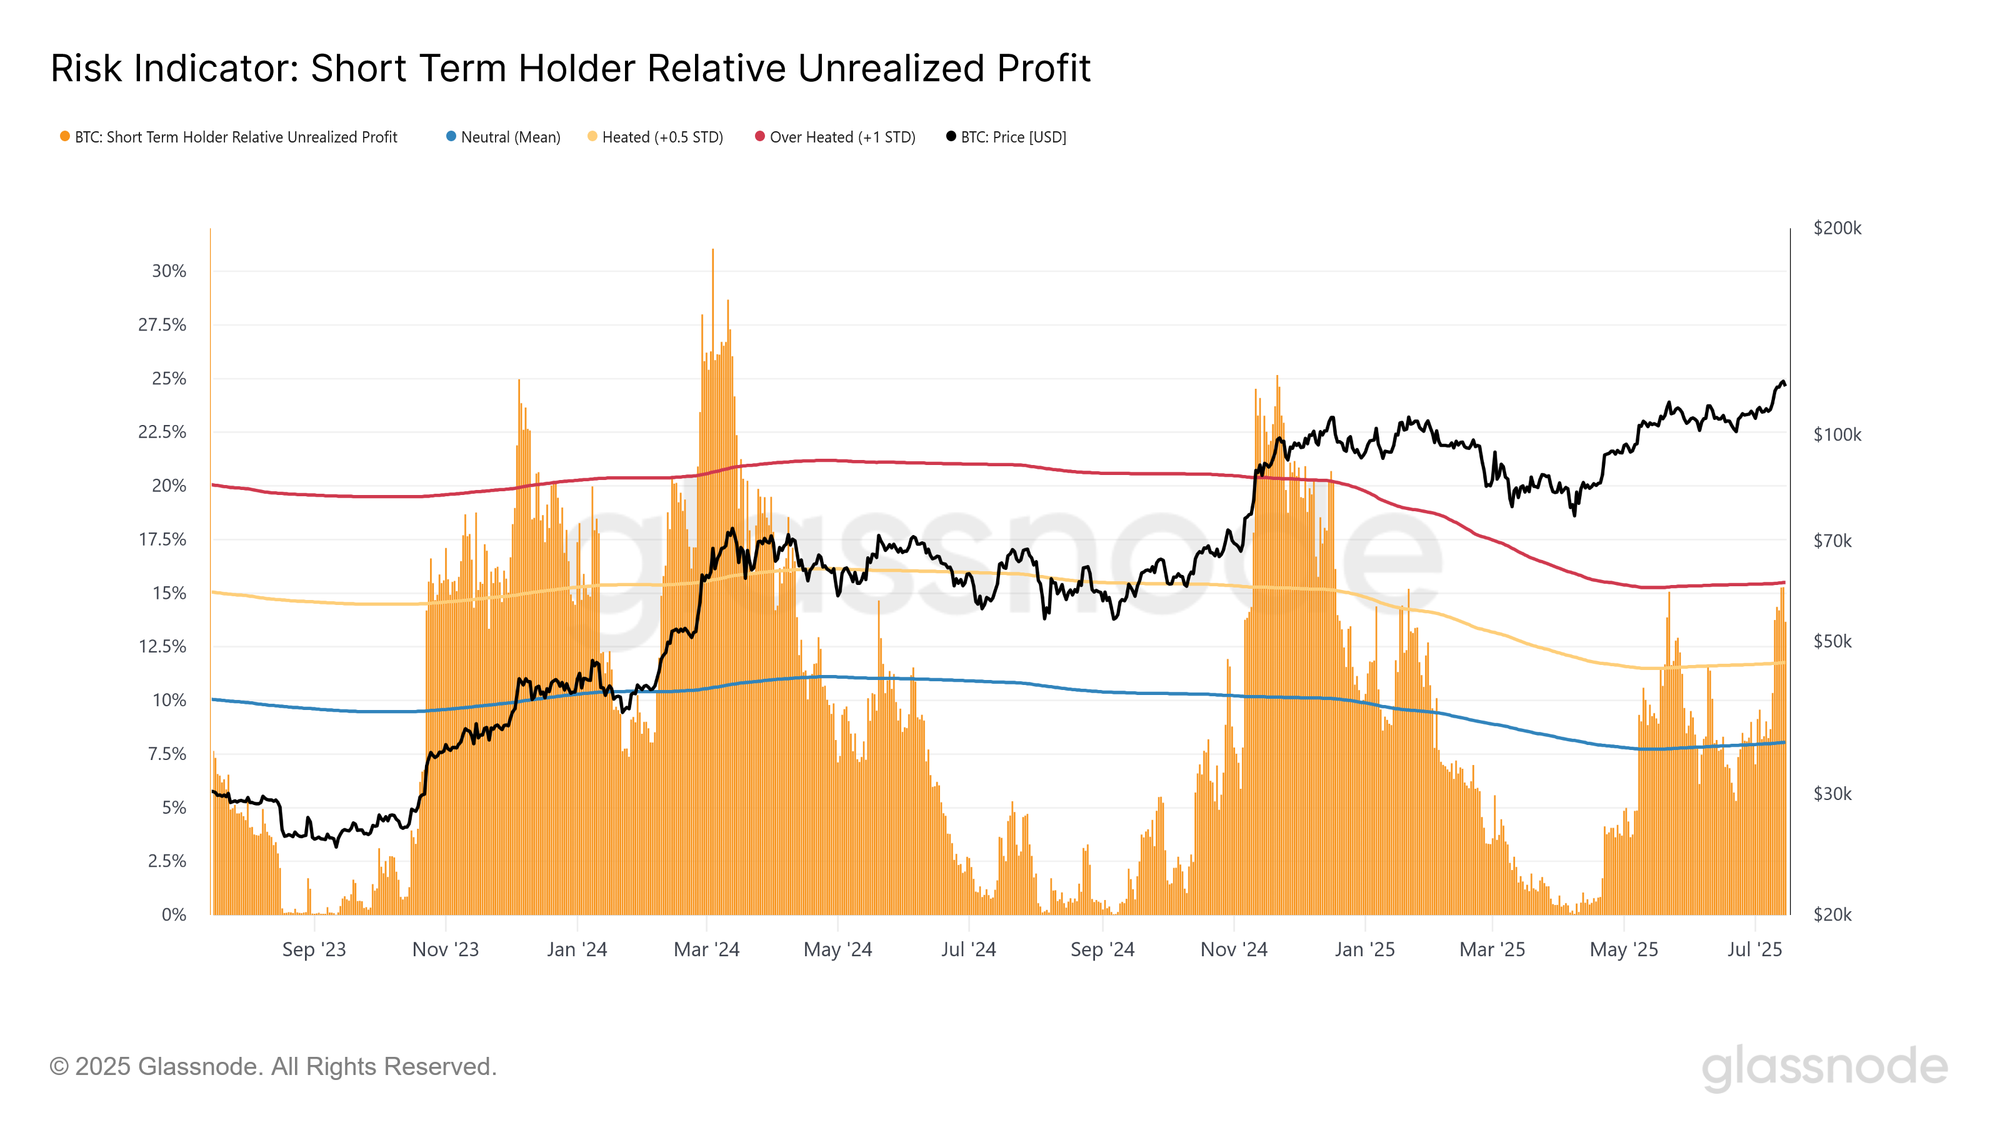
To assess the degree of unrealized profit held by these investors, we turn to the Short-Term Holder Relative Unrealized Profit metric. This indicator just touched the overheated threshold at 15.4% (+1 standard deviation above the mean), before contracting to 13.6%, reflecting an easing of unrealized gains during the price pull-back.
Historically, this zone often marks the beginning of top formation, which tends to unfold with a lag due to prolonged profit-taking by short-term holders. Since these investors tend to react quickly to price shifts, this metric is key for spotting early signs of demand exhaustion.
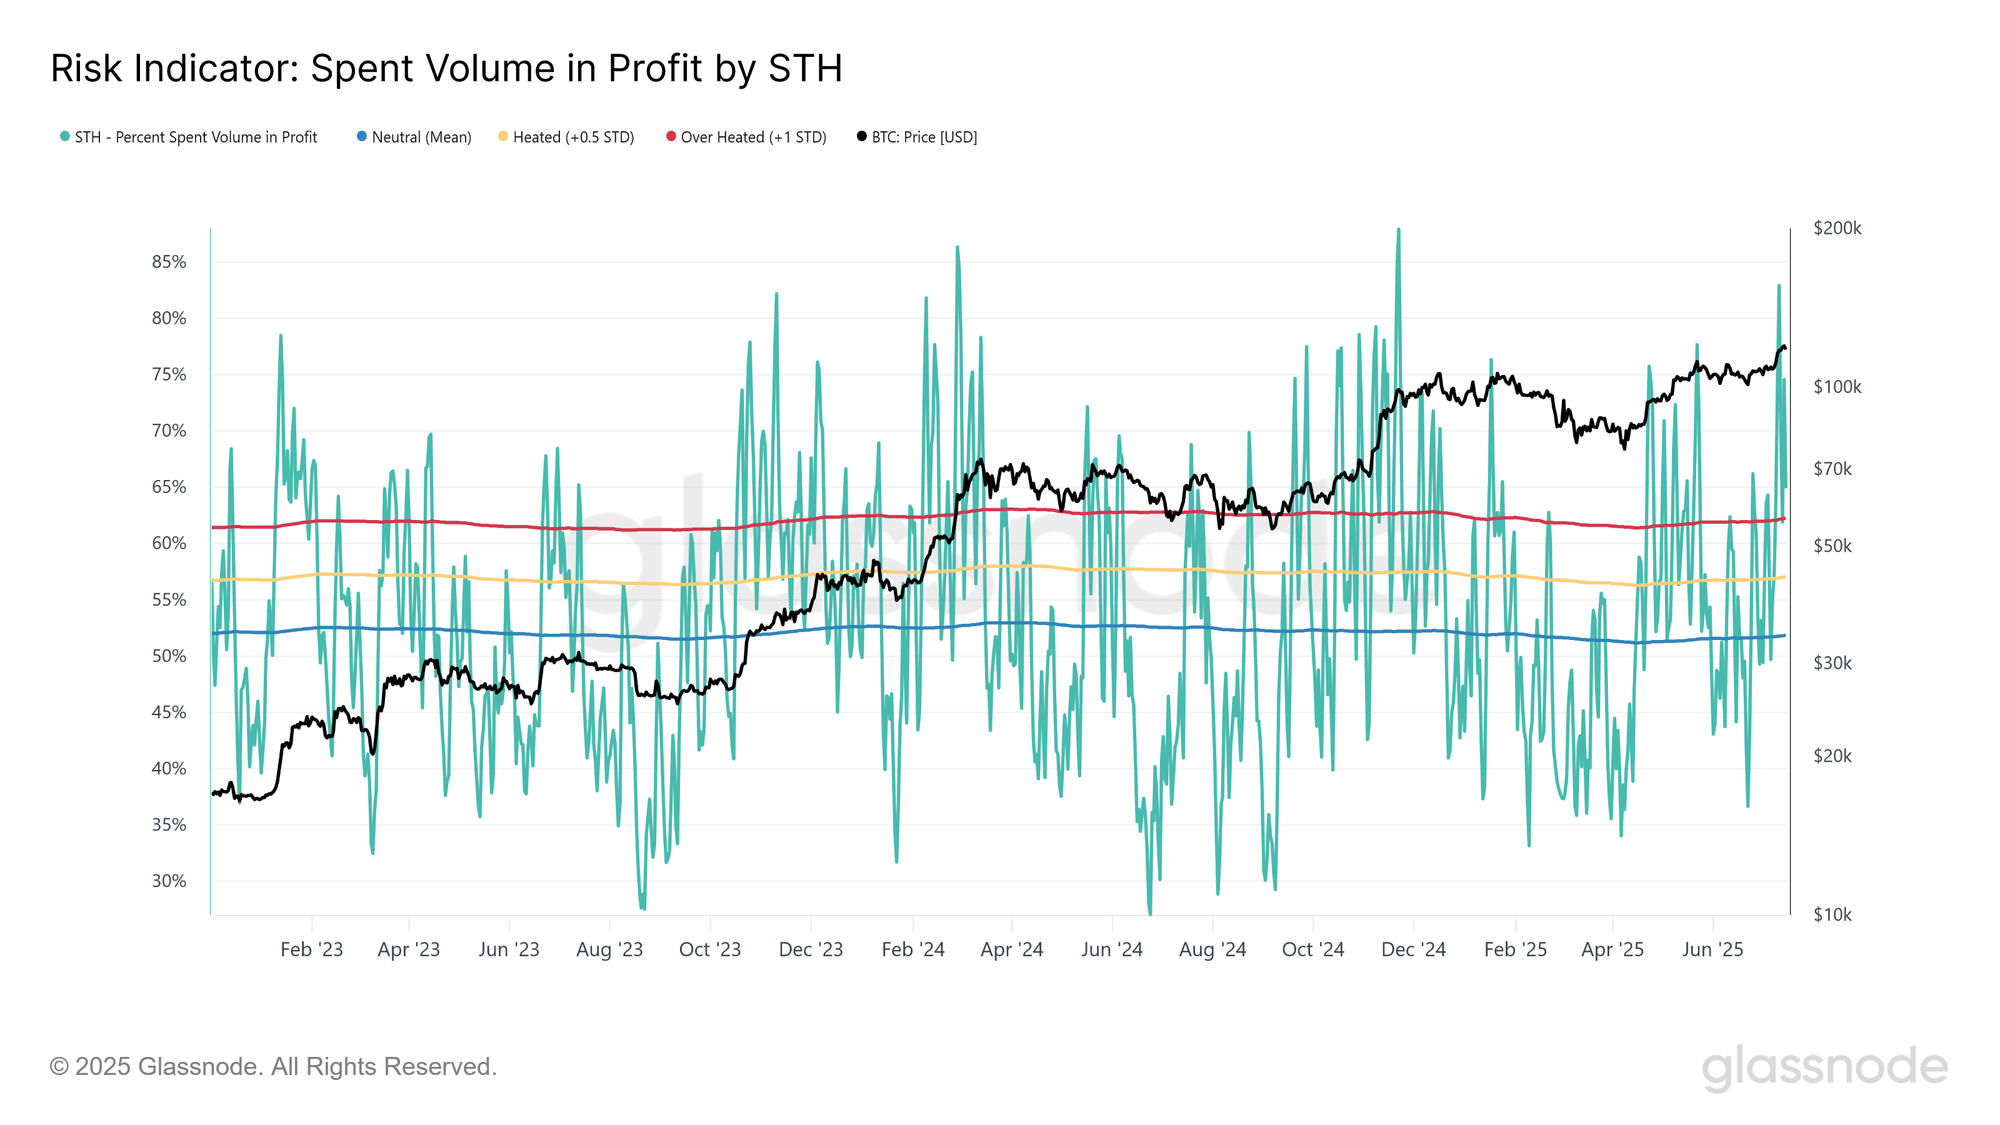
With unrealized profits already reaching overheated territory, it is reasonable to expect short-term holders to begin spending coins in profit at an accelerated pace. These events can be identified when the Percent of Spent Volume in Profit by short-term holders rises above the 1 standard deviation band.
This is a pattern which has historically preceded demand-side exhaustion. So far, we have experienced the first major wave of high-volume profit taking since the peak in late 2024.
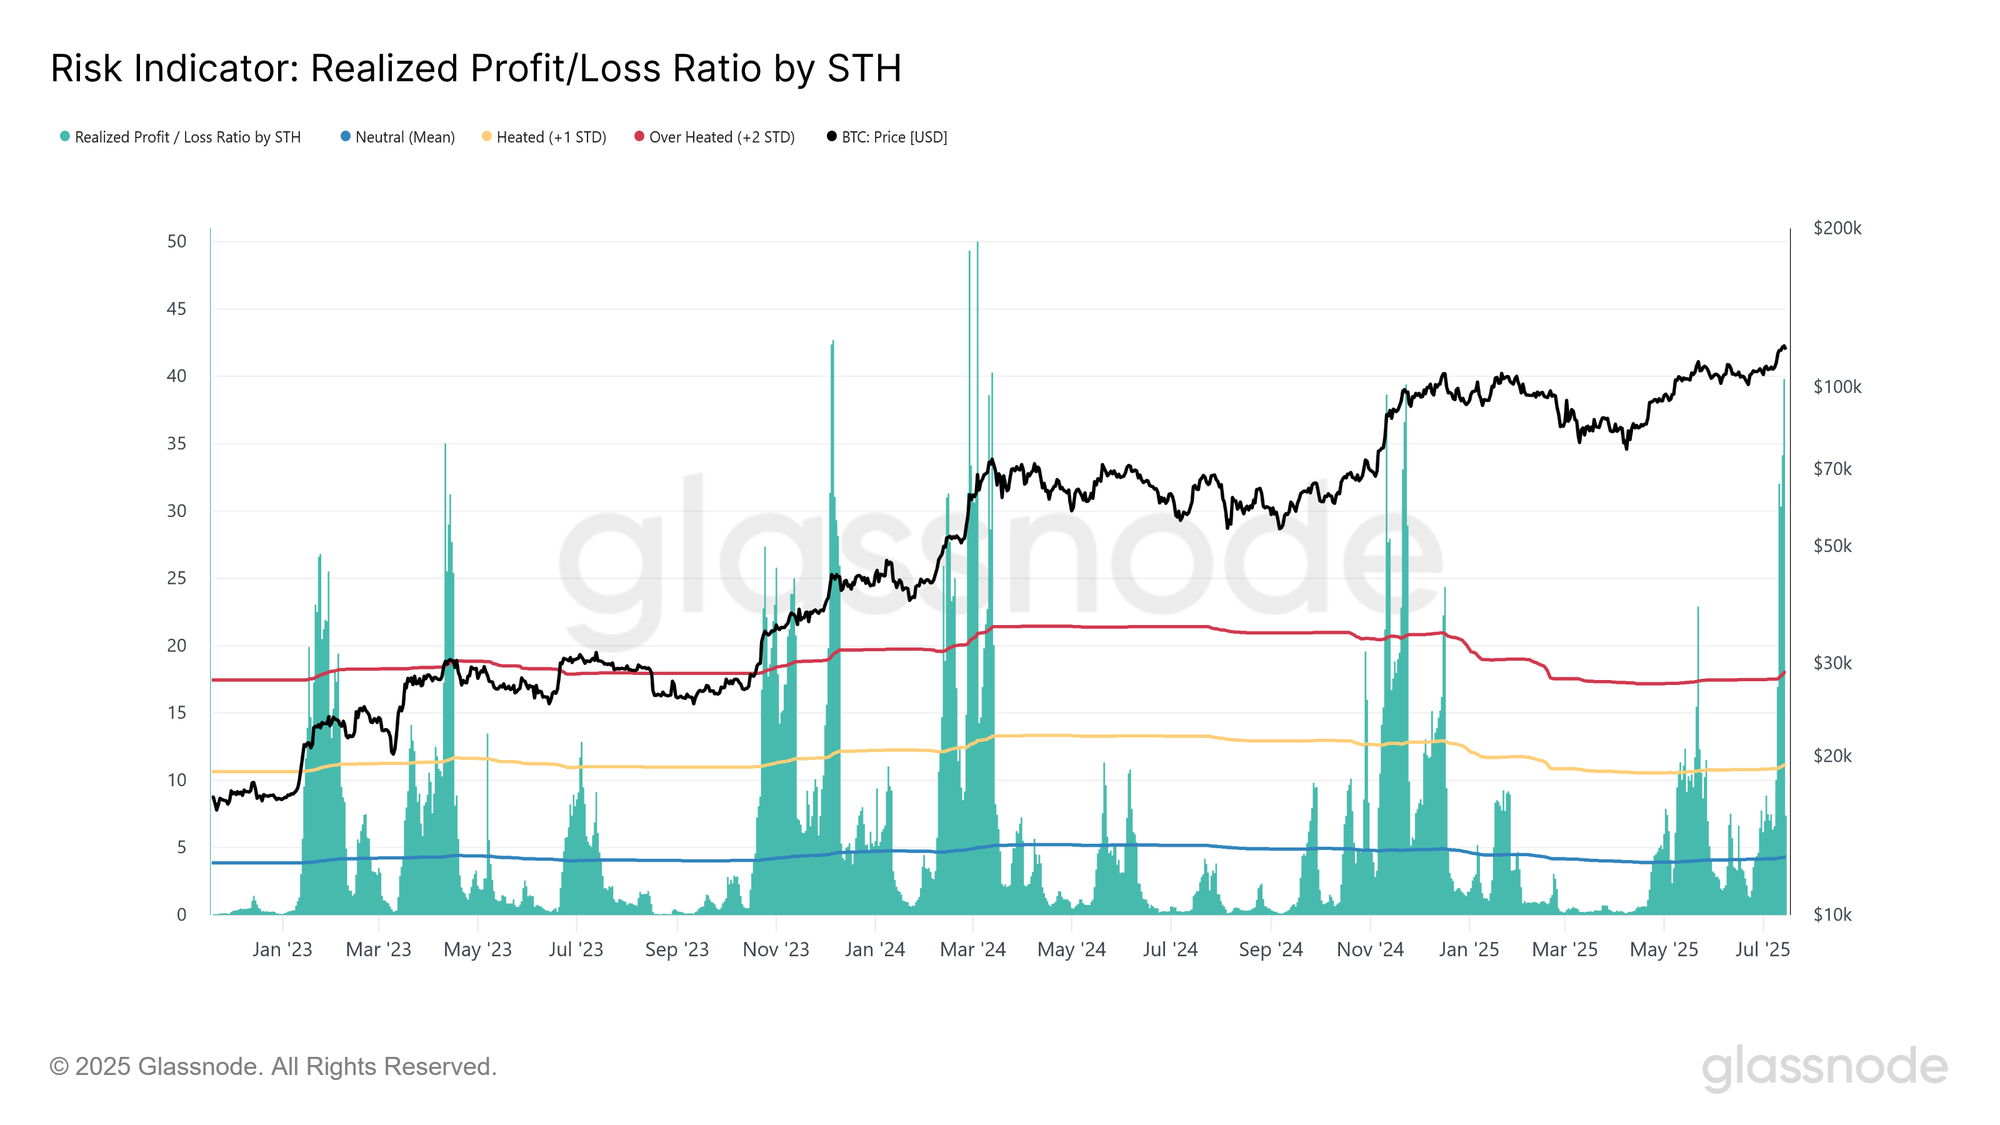
In addition to the spent volume in profit, we can assess the intensity of realized gains using the Realized Profit to Loss Ratio. This metric recently spiked to 39.8, which is well above the +2 standard deviation threshold. It has since cooled down to 7.3, which is still elevated, but a far more modest level for bull market conditions.
Repeated breaches into the overheated zone can serve as a strong signal of extreme profit-taking activity, which ultimately acts to exhaust inflowing demand across the market.
Conclusion
Bitcoin has broken above two major compact accumulation zones, a significant structural shift that often precedes strong continuation. However, short-term holders, being the more sensitive cohort, are now residing in the overheated unrealized profit zone, making a higher regime of profit realization highly likely.
So far, both the Percent of Spent Volume in Profit and the Realized Profit to Loss Ratio have signalled the first wave of excessive profit-taking. Historically, such top formations tend to unfold across multiple waves, suggesting there is still potential for another leg higher, possibly toward the 2 standard deviation level above the short-term holder cost basis, around ~$130K.
Disclaimer: This report does not provide any investment advice. All data is provided for informational, and educational purposes only. No investment decision shall be based on the information provided here and you are solely responsible for your own investment decisions.
Exchange balances presented are derived from Glassnode’s comprehensive database of address labels, which are amassed through both officially published exchange information and proprietary clustering algorithms. While we strive to ensure the utmost accuracy in representing exchange balances, it is important to note that these figures might not always encapsulate the entirety of an exchange’s reserves, particularly when exchanges refrain from disclosing their official addresses. We urge users to exercise caution and discretion when utilizing these metrics. Glassnode shall not be held responsible for any discrepancies or potential inaccuracies.
Please read our Transparency Notice when using exchange data.
- Join our Telegram channel.
- For on-chain metrics, dashboards, and alerts, visit Glassnode Studio.