Bitcoin Whales Are Increasingly Preferring OTC Deals Over Exchanges

BitcoinistОпубліковано о 2022-04-15Востаннє оновлено о 2022-04-15

Анотація

Data shows the Bitcoin fund flow ratio has been going down in the last couple of years, suggesting that whales...

Data shows the Bitcoin fund flow ratio has been going down in the last couple of years, suggesting that whales have started to prefer selling through OTC deals over centralized exchanges.
Bitcoin Fund Flow Ratio Reaches Lowest Level Since 2015
As explained by an analyst in a CryptoQuant post, BTC whales seem to have increasingly been trading outside exchanges in recent times.
The “fund flow ratio” is an indicator that’s defined as the the total Bitcoin amount entering or exiting centralized exchanges divided by the total amount of coins involved in trading on the entire network.
In simpler terms, this metric tells us what part of the total transactions on the network involve the usage of exchanges.
When the value of this indicator is high, it means investors are heavily using exchanges right now as a significant portion of the daily transactions are happening on exchanges.
On the other hand, low values of the ratio imply exchange activity is low at the moment. Such a trend suggests investors are currently preferring to trade through OTC deals.
Now, here is a chart that shows the trend in the Bitcoin fund flow ratio (90DMA) over the last several years:

Bitcoin Fund Flow Ratio

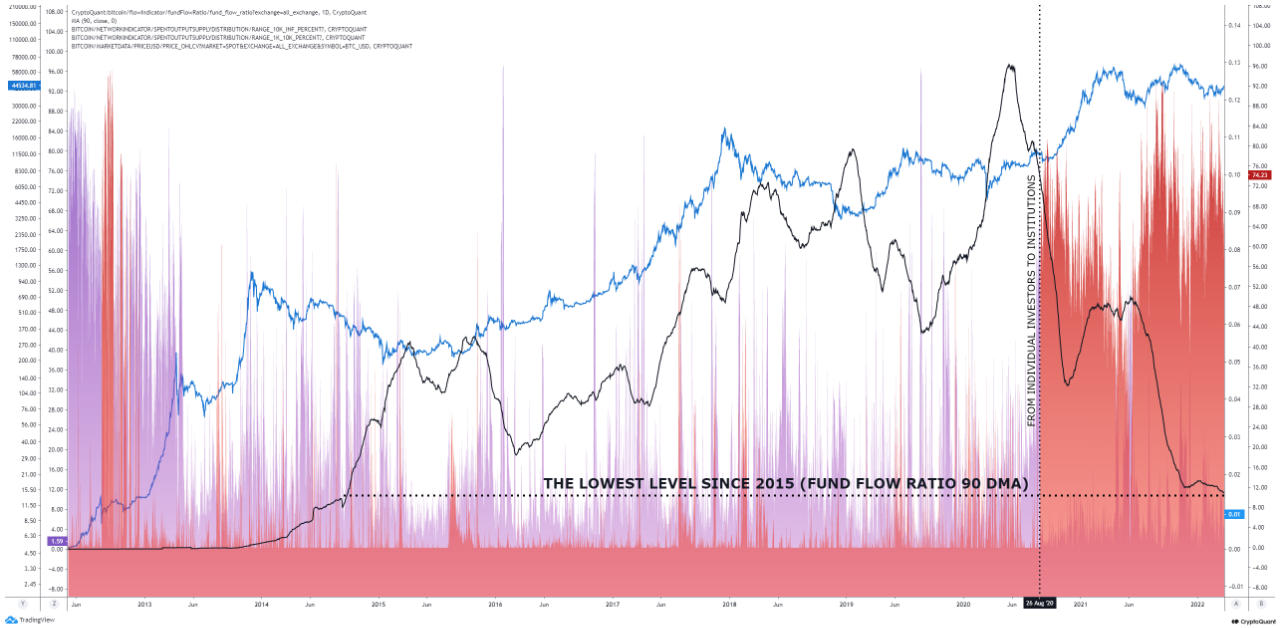
Looks like the value of the indicator has declined recently | Source: CryptoQuant
As you can see in the above graph, the Bitcoin fund flow ratio was at a high just before the 2021 bull run kicked off.
However, soon after that the indicator’s value started sharply dropping off. The decline has slowed down a bit recently, but it hasn’t stopped. As a result, the value of the ratio is now at a low not seen since 2015.
The quant has also included data from two other indicators in the chart, the purple lines track coin movement from investors holding coins between 1k to 10k, while the red lines follow whales with more than 10k Bitcoin.
It looks like whales have been very active since August 2020, which coincides with the declining fund flow ratio. This suggests that much of these movements by the whales have been off exchanges.
So, it seems like these humongous Bitcoin holders have increasingly preferred using OTC deals in the past couple of years.
BTC Price
At the time of writing, Bitcoin’s price floats around $40.9k, down 6% in the last seven days. Over the past month, the crypto has gained 8% in value.
The below chart shows the trend in the price of the coin over the last five days.

Bitcoin Price Chart

The price of Bitcoin seems to have shown a bit of recovery over the past day

Пов'язані матеріали

Bitcoin's 'Rally Ends,' Officially Entering the Later Stage of a Bear Market?

Bitcoin prices declined 13% this week, reversing the recent rebound and signaling a likely transition into the later stages of a bear market. Key on-chain metrics deteriorated, with the short-term holder cost basis falling below the Realized Price—a pattern last seen in early 2022, characteristic of bear market maturity. The rally to ~$82k proved to be a bear market bounce, as evidenced by the 90-day realized profit/loss ratio failing to sustain above the bullish threshold of 2. Daily realized losses surged to $1.35B, including significant selling from long-term holders who accumulated near cycle tops, indicating ongoing supply redistribution. Price was rejected almost precisely at the aggregate US spot ETF cost basis of ~$83k, turning that level into resistance and leaving the average ETF investor underwater again. Spot market selling pressure intensified, with the 7-day volume delta turning significantly negative to its weakest level since February. While a major long liquidation event cleared over $400M in leverage, spot demand has not yet stepped in to absorb the resulting supply. Options markets continue pricing in higher future volatility (elevated volatility risk premium) and maintain a skew toward put options, reflecting persistent demand for downside protection, though not yet panic. Overall, market structure remains fragile. Sustained recovery likely requires a reclaim of the ETF cost basis, a shift back to positive spot demand, and a slowdown in realized loss-taking. Until then, the market risks further downside or extended consolidation within the broader bear trend.

Foresight News1 год тому

Bitcoin's 'Rally Ends,' Officially Entering the Later Stage of a Bear Market?

Foresight News1 год тому

How Risky is the "Death Spiral" of MSTR and STRC?

Summary: This article explores the perceived "death spiral" risk between MicroStrategy (MSTR), its Bitcoin holdings, and its perpetual preferred stock (STRC), drawing comparisons to the LUNA-UST collapse. While both systems feature price anchors, high yields for holders, and potential feedback loops, their core mechanisms differ fundamentally. The MSTR-STRC structure relies on continuous financing to sustain its high dividend payouts, primarily through stock ATM offerings. A negative feedback cycle could occur: falling MSTR stock price makes raising equity capital harder, increasing pressure to sell Bitcoin, which undermines STRC confidence and further depresses MSTR. However, unlike LUNA-UST's automated, direct linkage, the MSTR-STRC loop is weaker and has brakes: STRC dividends can be deferred or rates lowered, and STRC holders have a $100/share liquidation preference in bankruptcy, providing a price floor. The company's sustainability hinges on its ability to continue financing. Its current ~$900 million USD reserves cover only about 6.3 months of its ~$1.71 billion annual interest/dividend burden. The next six months are critical, aligning with both the potential bottom in Bitcoin's four-year cycle and the depletion timeline of its reserves. While a LUNA-style catastrophic collapse is deemed highly unlikely due to structural differences, the key question is whether MicroStrategy can navigate this period through healthy deleveraging to restart its capital engine.

Foresight News1 год тому

How Risky is the "Death Spiral" of MSTR and STRC?

Foresight News1 год тому

Торгівля

Спот
Ф'ючерси
活动图片