ETH price outperforms BTC price, what does this mean?

Tap Chi BitcoinОпубліковано о 2023-05-26Востаннє оновлено о 2023-05-26

Анотація

Ethereum (ETH) price has outperformed Bitcoin (BTC) for the past four weeks, although ETH/USD price has dropped.

Ethereum (ETH) price has outperformed Bitcoin (BTC) for the past four weeks, although ETH/USD price has dropped.

Wave counts and technical indicators from the daily timeframe suggest that it will continue to outperform BTC, reaching highs not seen since 2018.

Technical analysis from the weekly timeframe in the ETH/ BTC pair is mixed. The price has been trading in a range of ₿0.055 to ₿0.078 since May 2021.

A trading range is a neutral sign as price often fluctuates between support and resistance lines before making a final move out of its bounds.

It is possible that the price is trading inside a descending parallel channel. Even so, the support line of the pattern has not been fully validated.

However, unlike the support line, the midline has been validated multiple times (green icon). Therefore, if the price continues to sustain in the upper part of the channel, the possibility of a breakout is very high.

Furthermore, the weekly RSI has mixed results. By using the RSI as a momentum indicator, traders can XEM the market is overbought or oversold to decide whether to accumulate or sell an asset.

If the RSI is above 50 and it is trending up, the bulls have the advantage, but if the indicator is below 50, the opposite is true. The indicator is bullish but still below 50, providing no clue as to the direction of the trend.

Weekly ETH/ BTC Chart | Source: TradingView

The daily timeframe outlook provides a bullish outlook for several reasons.

First, the number of waves shows that the price has bottomed out. Using Elliott Wave theory, technical analysts examine long-term price patterns and investor sentiment to determine the direction of a trend.

According to the number of waves, the price completed the ABC correction structure (white), where wave B has the shape of a triangle.

The fact that the correction ended right at the 0.618 Fib retracement level further supports this possibility.

Next, the daily RSI created a bullish divergence and stayed above the 50 level, another bullish sign.

Therefore, the pair is likely to have bottomed out and a strong rally is imminent.

Since ETH is the largest Altcoin in the crypto market, its rise will cause Bitcoin Dominance Rate (BTC.D) to drop. This could trigger a wave of FOMO into Altcoin in the near term.
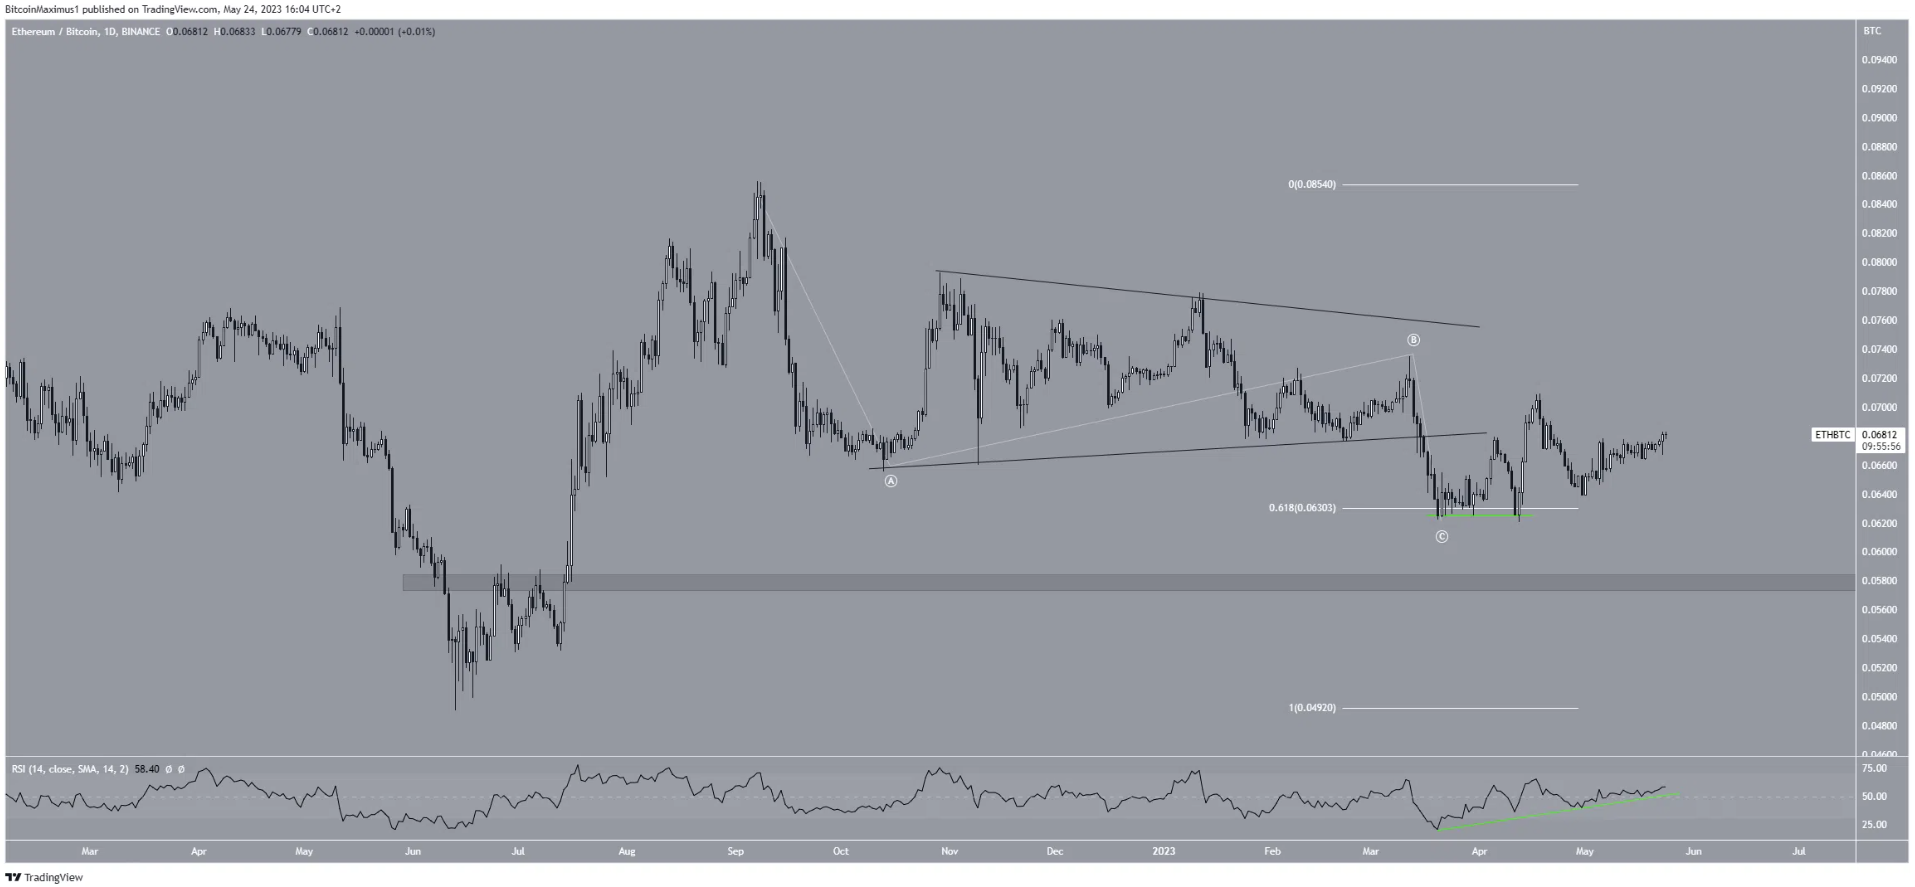
ETH/ BTC Daily Chart | Source: TradingView

Despite this bullish prediction, a drop below the low of wave C at ₿0.062 will mean the trend remains bearish.

In that case, a drop to the ₿0.058 support area would be the most likely scenario.
Пов'язані матеріали

Solana Proposals Could Lead to Reduction in Staking Yields to 2.25% and Cut Emissions by $1.5 Billion

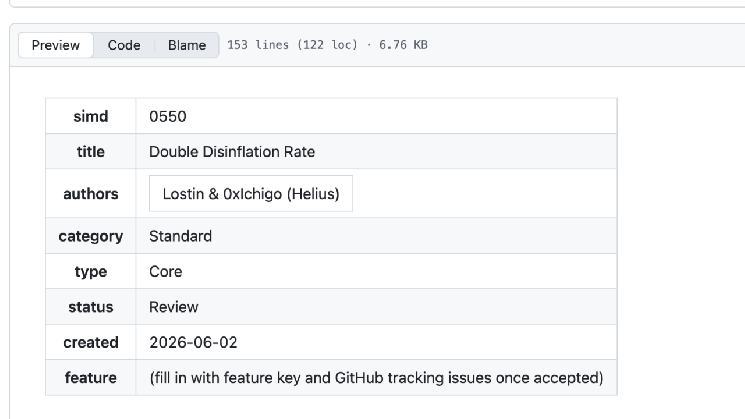
Solana is moving towards a stricter monetary model that could lead to a SOL deficit and significantly reduce staking rewards for holders. Two governance proposals drive these changes. SIMD-550, currently under vote, would double Solana's annual disinflation rate from 15% to 30%, accelerating the timeline to reach a final inflation rate of ~1.5% to the first half of 2029. The second, SIMD-553 (already approved), introduces additional token burning tied to computational units used on the network. Together, these measures could reduce SOL emission by an estimated $1.4-$1.5 billion over six years. The immediate impact would be lower staking yields, potentially falling from the current ~5.25% to approximately 4.34% in year one, 3% in year two, and 2.25% by year three. Analyst Matt Mena from 21Shares suggests inflation should be tied to economic metrics to help offset this decline. The changes also raise concerns for validator economics, with some potentially becoming unprofitable as inflation rewards decrease and voting costs may rise. However, the lower passive yield might push a significant portion of the 67.9% staked SOL into Solana's DeFi ecosystem for activities like lending and trading. This shift could boost network fee revenue to compensate for lower inflation rewards. The proposals aim to trade lower yield today for less dilution tomorrow, betting that network growth and usage will make this a worthwhile trade-off for SOL holders.

cryptonews.ru27 хв тому

Solana Proposals Could Lead to Reduction in Staking Yields to 2.25% and Cut Emissions by $1.5 Billion

cryptonews.ru27 хв тому

Chairman of Olympic Committee detained in Poland over crypto scandal

The Chairman of the Polish Olympic Committee, Radosław Piesiewicz, was detained in Warsaw in connection with a case involving the cryptocurrency exchange Zondacrypto. The detention was carried out on the order of the Katowice National Prosecutor's Office and the Central Bureau for Combating Cybercrime. Piesiewicz denies the allegations, claiming he never had accounts on the exchange or dealt in cryptocurrency, and links the detention to political persecution. He has led the Olympic Committee since 2023 and is also a parliamentarian for the Law and Justice party. The prosecutor's office initiated the case in April 2026 on grounds of fraud and money laundering amounting to approximately 350 million PLN (around €80 million). The investigation found the exchange was used to transfer funds abroad and cash out criminal proceeds, with clients unable to withdraw their assets. A total of 13 people are implicated, including the exchange's founder. Zondacrypto became the general sponsor of the Polish Olympic Committee and team in October 2025, with a contract lasting until 2028. In April 2026, Piesiewicz stated the committee could not terminate the agreement without incurring unaffordable penalties. The investigation revealed Piesiewicz received expensive gifts from exchange representatives, including a €40,000 watch, as well as paid trips to Monaco and Bergamo.

cryptonews.ru27 хв тому

Chairman of Olympic Committee detained in Poland over crypto scandal

cryptonews.ru27 хв тому

Bitcoin 'Basically Hopped' to $80K. What Will Happen to the Price in Autumn?

Bitcoin surged close to $80,000 in August, marking its fastest growth since 2024. Experts anticipate continued volatility for the autumn season, with price forecasts heavily dependent on macroeconomic conditions and regulatory developments in the US. Key drivers for the recent rise include a weakening US dollar, renewed capital inflows into spot Bitcoin ETFs, and liquidations of trading positions. The US Treasury's decision to increase long-term bond purchases has helped stabilize debt markets but pressured the dollar, leading investors to seek assets like Bitcoin as a hedge. Looking ahead, experts outline two primary scenarios for Bitcoin's price. A positive outcome, supported by favorable macroeconomics and the potential passage of the CLARITY Act regulating crypto in the US, could push Bitcoin toward $85,000-$100,000. Conversely, a negative scenario involving hawkish signals from the US Federal Reserve or regulatory setbacks could trigger a correction, potentially driving the price back down to the $62,000-$75,000 range. Institutional demand, reflected in consistent ETF inflows, is seen as a crucial stabilizing factor, gradually outweighing the influence of Bitcoin's traditional four-year cycles. Meanwhile, a broad rally in altcoins is not widely expected, as capital is likely to flow selectively into the most liquid projects. The central question for autumn is whether institutional buying can transform August's rapid surge into a sustainable upward trend.

cryptonews.ru31 хв тому

Bitcoin 'Basically Hopped' to $80K. What Will Happen to the Price in Autumn?

cryptonews.ru31 хв тому

Торгівля

Спот
活动图片