Tron Inc. buys 157K TRX: But price can still fall below $0.30, here’s how

ambcrypto2026-04-08 tarihinde yayınlandı2026-04-08 tarihinde güncellendi

Özet

Tron Inc. has acquired 157,515 TRX tokens at an average price of $0.3174, increasing its total holdings to over 690.3 million tokens. Despite this purchase, TRX continued to decline, trading at $0.3151. Technical analysis indicates a bearish outlook, with the token facing strong resistance at $0.3235 and having broken a key ascending trendline support. If the price remains below $0.32, a 13% drop to $0.2705 is possible. While market data shows recent buyer dominance, leveraged positions suggest bears are currently in control.

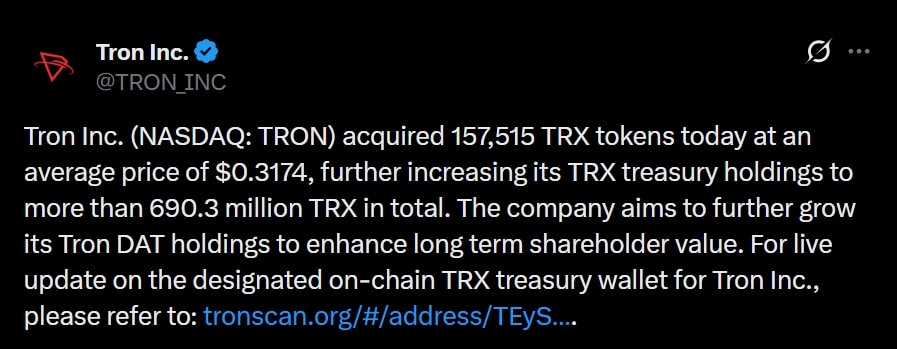
As per a post shared by Tron Inc. [NASDAQ: TRON] on the 7th of April, the company acquired a substantial 157,515 Tron [TRX] tokens at an average price of $0.3174. This acquisition has increased the firm’s treasury holdings to over 690.3 million in total.

The company further noted that its aim is to grow Tron DAO holdings to enhance long-term shareholder value.

Source: X/Tron Inc.

However, at press time, TRX appeared to be extending its downward move. With a 0.98% decline on the 7th of April, TRX was trading at $0.3151.

Tron: What are some levels to watch?

One factor that appeared to be a red flag for TRX was its current level, which was acting as a key resistance level.

On the daily chart, TRX was experiencing strong selling pressure from the $0.3235 level, which has a history of reversals and has acted as resistance multiple times since October 2025. TRX has also broken a key support level that it had been maintaining along an ascending trendline.

Source: TradingView

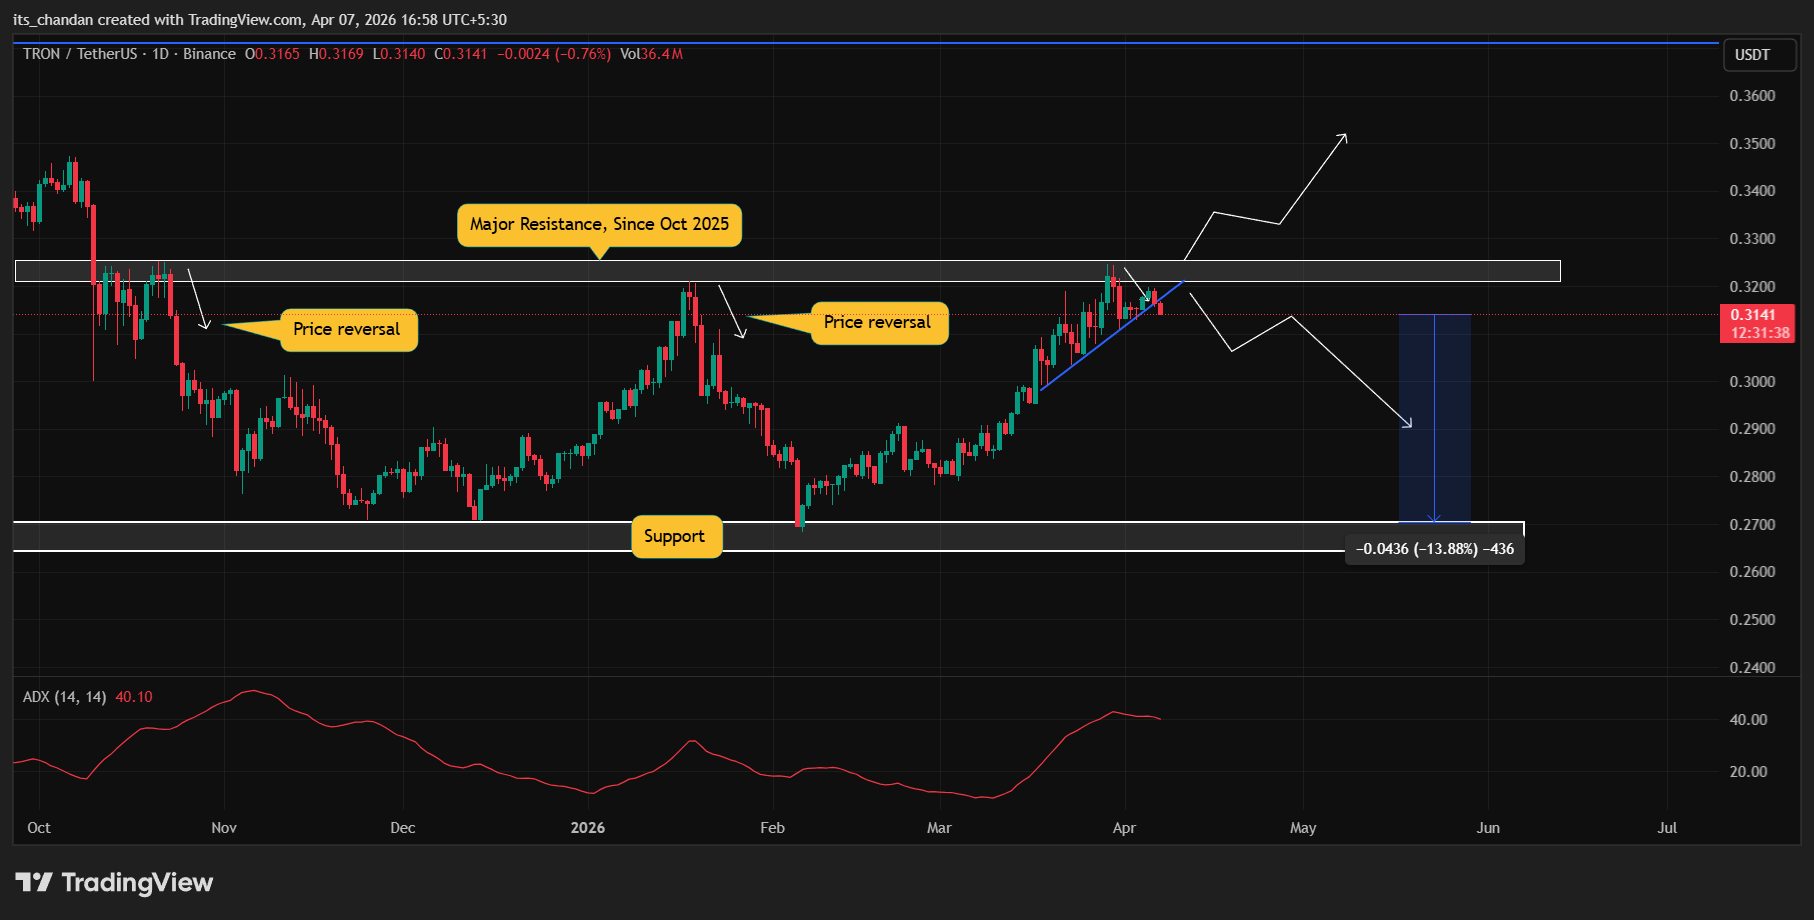
This breakdown of support, combined with the rejection at key resistance, suggests that TRX may be poised for a significant decline. Based on the current price action, if the price remains below the $0.32 level, there is a strong possibility it could drop by 13%, reaching the $0.2705 level in the coming days.

However, an upside move will only remain intact if the price clears the key resistance level of $0.3235.

At press time, the Average Directional Index (ADX), which measures trend strength, has risen to 40.23, indicating that TRX is currently experiencing a strong directional trend.

Mixed signals from market data

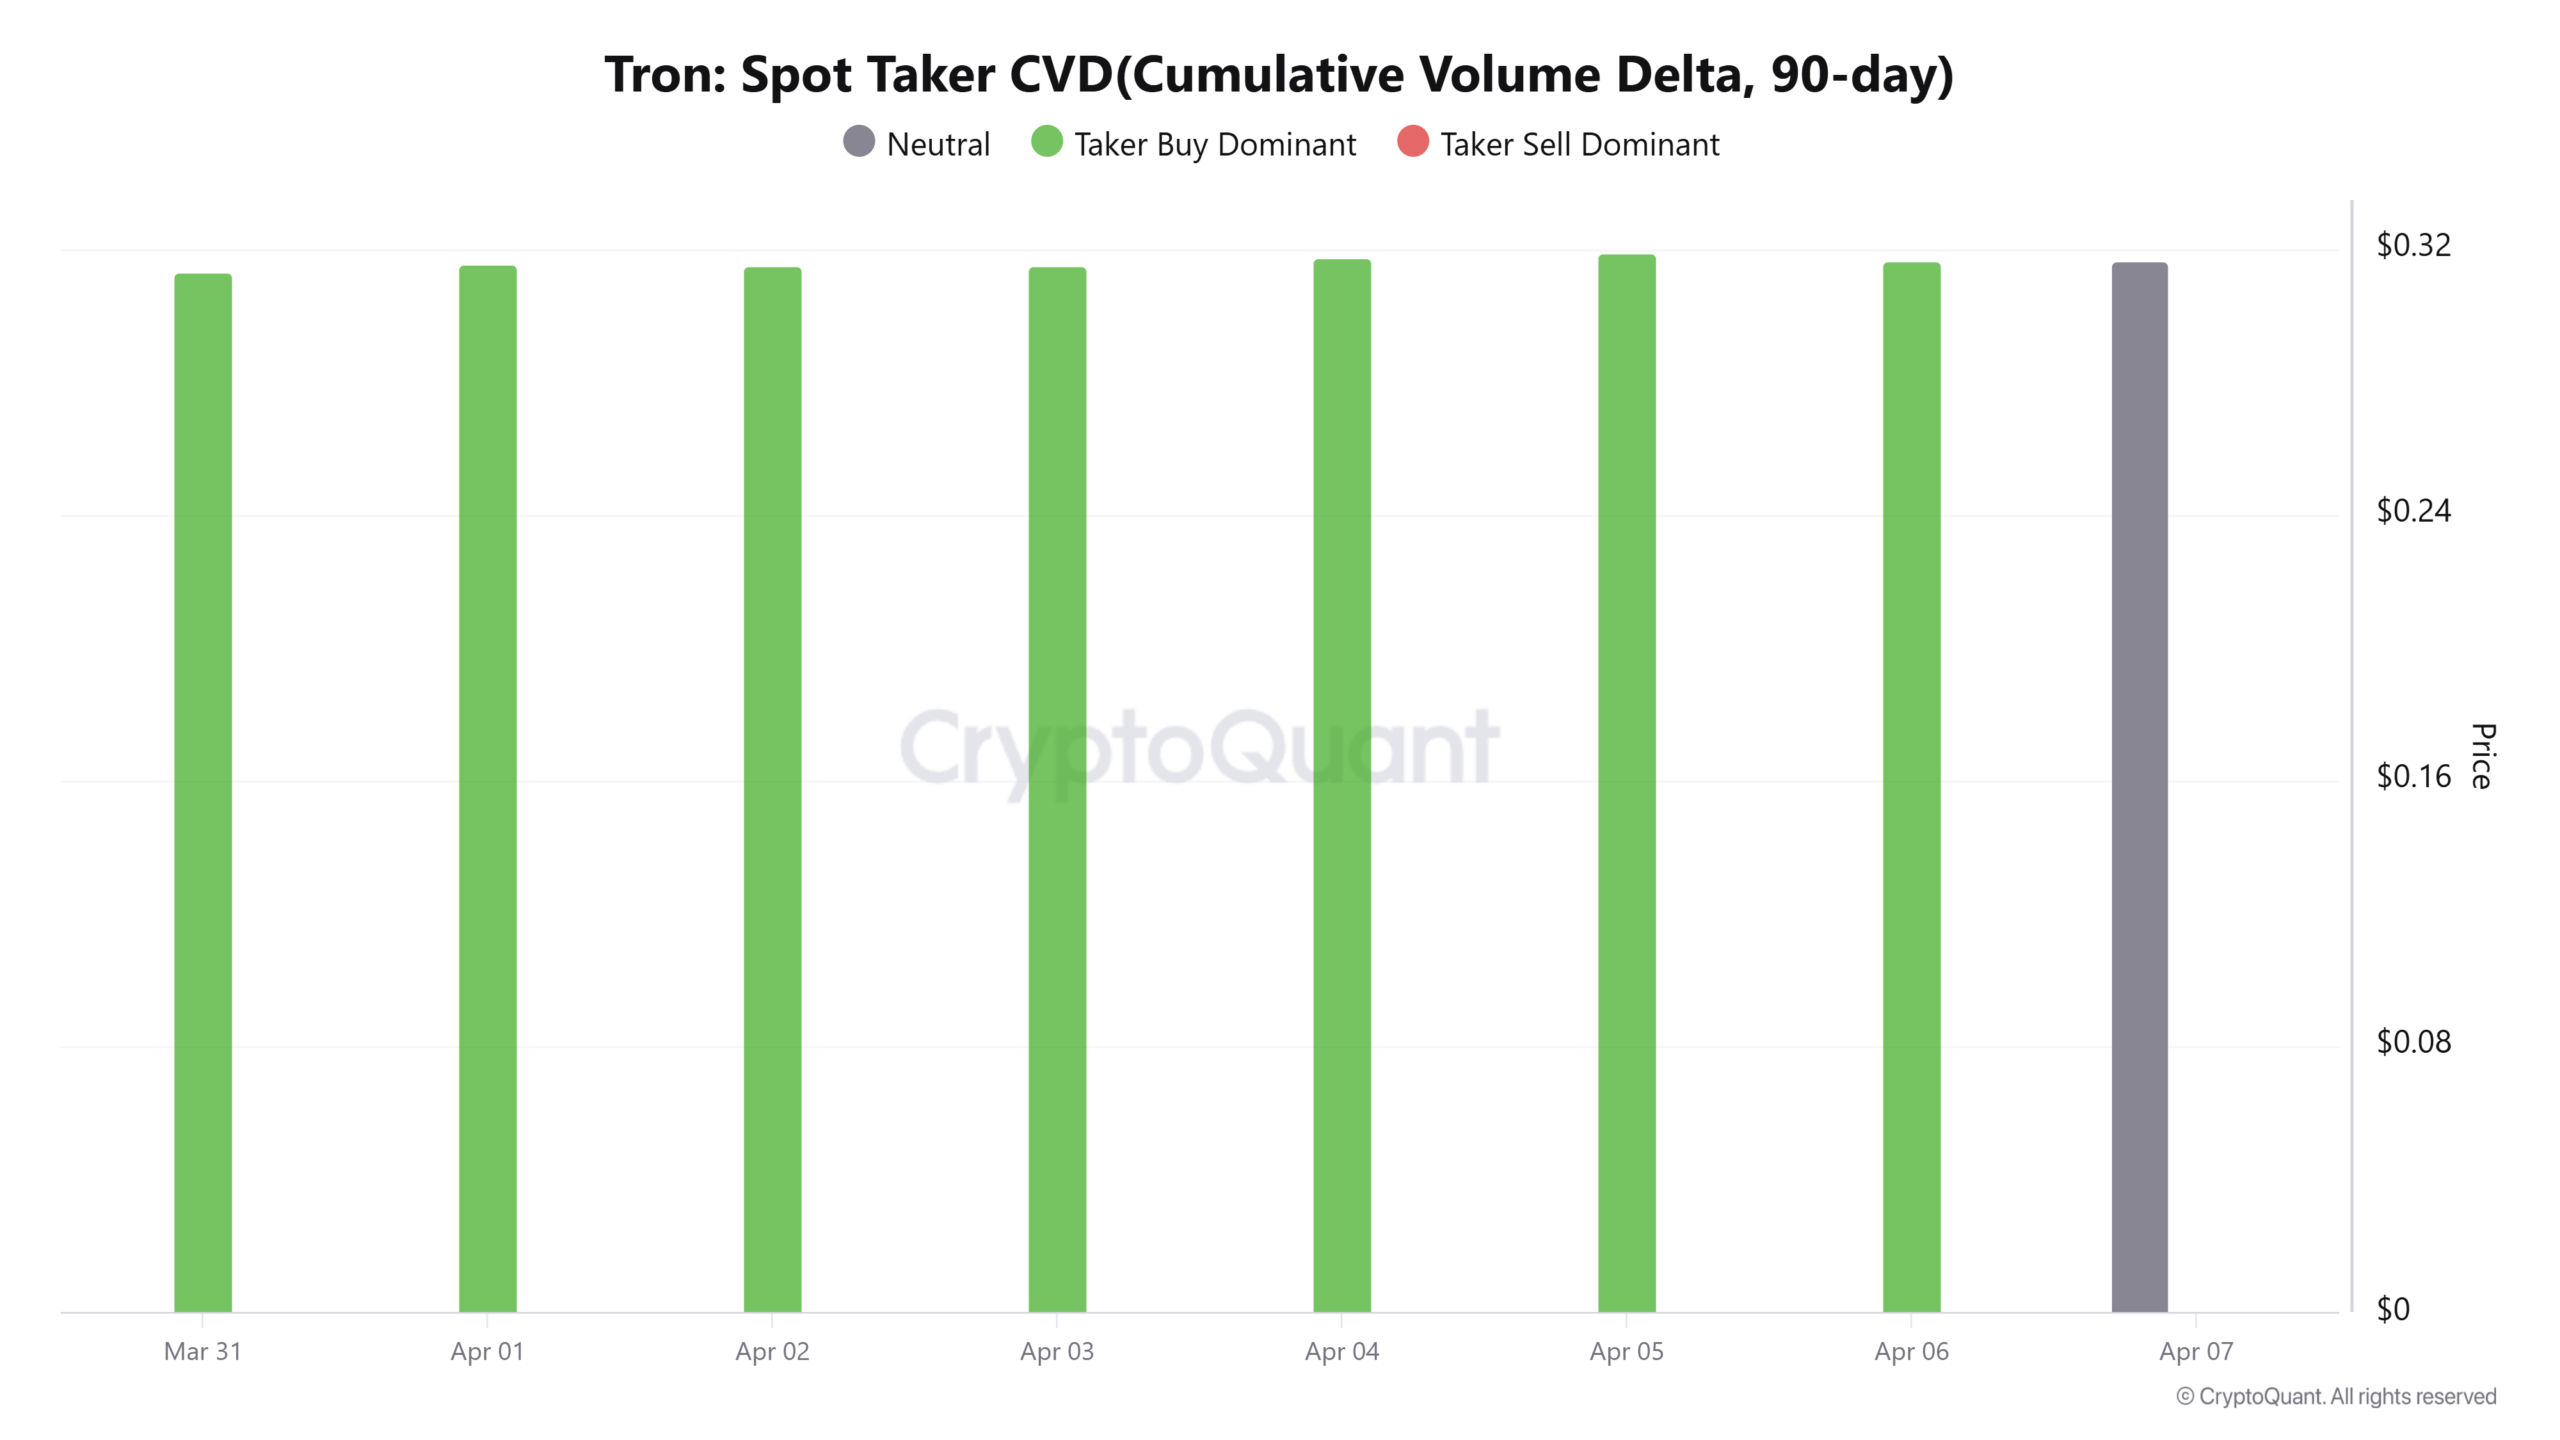
Besides the bearish outlook, Tron’s 90-day Spot Taker CVD revealed that the altcoin has seen strong buyer dominance in the market over the past week. The chart showed consecutive green bars from the 31st of March to the 6th of April, indicating aggressive buying activity.

Source: CryptoQuant

However, per TRX’s exchange liquidation map, $0.31 and $0.3224 are two key levels where intraday traders are highly active and over-leveraged.

Traders at these levels have built approximately $1.14 million worth of long leveraged positions and $1.74 million worth of short leveraged positions, suggesting that bears are presently in control while bulls appear exhausted.


Final Summary

  • Tron Inc. acquired a substantial 157,515 TRX tokens at an average price of $0.3174, increasing its total holdings to 690.3 million.
  • Price action suggests that TRX is poised for a 13% decline and may reach the $0.2705 level in the coming days.

Trend Kriptolar

İlgili Sorular

QHow many TRX tokens did Tron Inc. acquire and at what average price?

ATron Inc. acquired 157,515 TRX tokens at an average price of $0.3174.

QWhat is the key resistance level that TRX is struggling to break above on the daily chart?

AThe key resistance level that TRX is struggling to break above is $0.3235.

QAccording to the technical analysis, what is the potential downside target for TRX if it remains below $0.32?

AIf the price remains below $0.32, there is a strong possibility it could drop by 13%, reaching the $0.2705 level.

QWhat does the rise in the Average Directional Index (ADX) to 40.23 indicate for TRX?

AThe ADX rising to 40.23 indicates that TRX is currently experiencing a strong directional trend.

QWhat did the 90-day Spot Taker CVD chart reveal about buyer activity for TRX?

AThe 90-day Spot Taker CVD chart showed consecutive green bars from March 31st to April 6th, indicating strong and aggressive buyer dominance in the market over that period.

İlgili Okumalar

The Entire Internet Hails Noam's Joining, But OpenAI's Loss Bill Just Got Thicker

While the AI community celebrates Noam Shazeer, co-author of the "Attention Is All You Need" paper, joining OpenAI as Head of Architectural Research, the company's audited financials reveal a starkly different reality. In 2025, OpenAI reported $13.07 billion in revenue but a massive $20.92 billion operating loss. Even excluding a one-time accounting charge, the cash burn is severe, with $3.7 billion consumed in Q1 2026 alone. This high-profile hiring occurs against a backdrop of significant internal research talent drain, with key founders and researchers departing as the company's focus shifts from exploratory research to product iteration. Meanwhile, OpenAI's fundamental business model faces a deep crisis. It paid Microsoft $10.59 billion for compute in 2025, while its vast user base of 9 billion weekly actives includes only 50 million paying customers, making growth a direct driver of escalating costs. The article argues Shazeer's recruitment is less about technical necessity and more about crafting a compelling narrative for OpenAI's upcoming IPO, aiming to justify a rumored $1 trillion valuation to future public market investors. It contrasts OpenAI's strategy with Anthropic's reported path to profitability, which relies on a strong enterprise customer base and cost control, rather than star-powered narratives. Ultimately, the piece concludes that while Shazeer's architectural work may take 1-2 years to materialize, OpenAI's financial clock is ticking much faster, with its massive losses undercutting the celebratory headlines.

marsbit1 saat önce

The Entire Internet Hails Noam's Joining, But OpenAI's Loss Bill Just Got Thicker

marsbit1 saat önce

Market Trend (June 19): US-Iran Deal Drives Out Geopolitical Premium; Chip Stocks Soar to New Highs; Energy Sector Leads Declines

U.S. Market Trends (June 19): U.S.-Iran Deal Eases Tensions, Chip Stocks Soar, Energy Sector Leads Declines. U.S. stocks rallied on Thursday as the signing of a temporary U.S.-Iran deal in Geneva de-escalated Middle East tensions, with Saudi oil tankers transiting the Strait of Hormuz. This geopolitical relief helped markets recover from recent Fed-driven volatility. The S&P 500 rose over 1%, the Nasdaq gained nearly 2%, and the Dow Jones Industrial Average closed at another record high. The Philadelphia Semiconductor Index surged over 6% to a historic peak. Chip stocks were the standout performers. Reports of an Apple-Intel design and foundry deal for certain products, alongside mentions of potential Nvidia and SpaceX collaborations with Intel, propelled the sector. Intel surged ~10.5%, while memory chip makers like Micron also saw significant gains, highlighting sustained confidence in long-term AI capital expenditure. In contrast, the energy sector was the day's sole loser, with the S&P 500 energy sub-index declining as WTI crude fell ~2% to around $74.29/barrel. The reopening of key shipping routes erased prior geopolitical risk premiums. SpaceX extended losses for a second day on news of a potential large bond offering. Market volatility (VIX) dropped sharply, indicating a swift reversal of post-Fed jitters. Treasury yields dipped slightly but remained elevated. The focus now shifts to upcoming economic data, including next week's PCE inflation report and Micron's earnings, which will serve as a key test for the AI trade's durability.

marsbit2 saat önce

Market Trend (June 19): US-Iran Deal Drives Out Geopolitical Premium; Chip Stocks Soar to New Highs; Energy Sector Leads Declines

marsbit2 saat önce

İşlemler

Spot
Futures

Popüler Makaleler

TRX Nasıl Satın Alınır

HTX.com’a hoş geldiniz! TRON (TRX) satın alma işlemlerini basit ve kullanışlı bir hâle getirdik. Adım adım açıkladığımız rehberimizi takip ederek kripto yolculuğunuza başlayın. 1. Adım: HTX Hesabınızı OluşturunHTX'te ücretsiz bir hesap açmak için e-posta adresinizi veya telefon numaranızı kullanın. Sorunsuzca kaydolun ve tüm özelliklerin kilidini açın. Hesabımı Aç2. Adım: Kripto Satın Al Bölümüne Gidin ve Ödeme Yönteminizi SeçinKredi/Banka Kartı: Visa veya Mastercard'ınızı kullanarak anında TRON (TRX) satın alın.Bakiye: Sorunsuz bir şekilde işlem yapmak için HTX hesap bakiyenizdeki fonları kullanın.Üçüncü Taraflar: Kullanımı kolaylaştırmak için Google Pay ve Apple Pay gibi popüler ödeme yöntemlerini ekledik.P2P: HTX'teki diğer kullanıcılarla doğrudan işlem yapın.Borsa Dışı (OTC): Yatırımcılar için kişiye özel hizmetler ve rekabetçi döviz kurları sunuyoruz.3. Adım: TRON (TRX) Varlıklarınızı SaklayınTRON (TRX) satın aldıktan sonra HTX hesabınızda saklayın. Alternatif olarak, blok zinciri transferi yoluyla başka bir yere gönderebilir veya diğer kripto para birimlerini takas etmek için kullanabilirsiniz.4. Adım: TRON (TRX) Varlıklarınızla İşlem YapınHTX'in spot piyasasında TRON (TRX) ile kolayca işlemler yapın.Hesabınıza erişin, işlem çiftinizi seçin, işlemlerinizi gerçekleştirin ve gerçek zamanlı olarak izleyin. Hem yeni başlayanlar hem de deneyimli yatırımcılar için kullanıcı dostu bir deneyim sunuyoruz.

1.6k Toplam GörüntülenmeYayınlanma 2024.12.10Güncellenme 2026.06.02

TRX Nasıl Satın Alınır

Tartışmalar

HTX Topluluğuna hoş geldiniz. Burada, en son platform gelişmeleri hakkında bilgi sahibi olabilir ve profesyonel piyasa görüşlerine erişebilirsiniz. Kullanıcıların TRX (TRX) fiyatı hakkındaki görüşleri aşağıda sunulmaktadır.

活动图片