Three Scenarios for BTC's Future Direction and a Duel Between Two Strong Forces | Special Invited Analysis

Odaily星球日报2026-05-12 tarihinde yayınlandı2026-05-12 tarihinde güncellendi

Özet

**Title: Three Scenarios for BTC's Future Trajectory and a Key Duel | Invited Analysis** The market remains at a critical juncture. Over the past week, Bitcoin (BTC) consolidated broadly between $79,500 and $80,600, validating previous technical analysis. The current focus is on whether this marks the start of a new uptrend or a pause within a larger correction. **BTC Multi-Cycle Analysis & Three Possible Scenarios** BTC's daily chart structure, following its peak at $126,200 in October 2025, presents three primary technical scenarios based on Elliott Wave theory: 1. **Bullish Scenario (End of Correction):** The corrective A-B-C wave from $126,200 ended at the $60,000 low in February 2026. The current price action is the start of a major Wave I uptrend. A subsequent Wave II pullback would not break below $60,000. 2. **Bearish Scenario 1 (Complex Correction):** The correction is unfolding as an A-B-C-D-E pattern. The current move from $60,000 is a D-wave rally. After its completion, a final E-wave decline could potentially breach the $60,000 level. 3. **Bearish Scenario 2 (Larger Correction):** The entire move down from $126,200 to $60,000 was a large A-wave. The current rally is a B-wave correction within a larger A-B-C structure, to be followed by a C-wave decline below $60,000. *Analysis suggests Scenario 2 is less probable due to time disproportions between waves. The battle is effectively between the Bullish Scenario (1) and Bearish Scenario (3).* **Key BTC Levels &...

The market never lies; it simply remains silent.

When prices linger in critical zones, both bulls and bears are waiting for an answer.

Over the past week, Bitcoin completed the wide-range oscillation we previously predicted within the core zone of $79,500 to $80,600. The market's price action has validated the effectiveness of our technical logic. However, validation is merely the starting point; the real game begins this week.

BTC's daily chart correction structure stands at a crossroads with three diverging paths: Is it the starting point of a new rising wave, or a midpoint in a larger-scale correction? Wave analysis can provide a framework, but the market ultimately votes with its price. Regarding HYPE, its seven-wave structure is clearly discernible. Whether it can break through the key level around $45.76 will become the variable most worth watching closely this week.

In this week's article, we will continue to approach from a multi-timeframe perspective, analyzing the structure, judging the direction, and formulating plans. Strategy is ready; discipline is self-held.

Summary of Core Trading Views for This Week:

• Analysis of BTC's Multi-Timeframe Price Structure (Detailed in Part One)
• BTC Market Forecast and Mid-/Short-Term Trading Strategies for This Week. (Detailed in Part Two)
• Analysis of HYPE's Daily Chart Price Structure. (Detailed in Part Three)
• HYPE Market Forecast and Short-Term Trading Strategies for This Week. (Detailed in Part Four)

Market Validation of Last Week's Trading Strategy and Core Views:

• Validation of BTC Market Forecast: In last week's article, we pointed out that we should focus on observing the battle between bulls and bears over the core zone of $79,500 to $80,600 and judged that the market was likely to experience wide-range oscillation there. Current market movements have largely validated our previous view.

One: Analysis of Bitcoin's Multi-Timeframe Price Structure

1. Analysis of BTC's Daily Chart Price Structure: (Three Scenarios for BTC's Subsequent Wave Structure)

Bitcoin _ Daily Candlestick Chart:
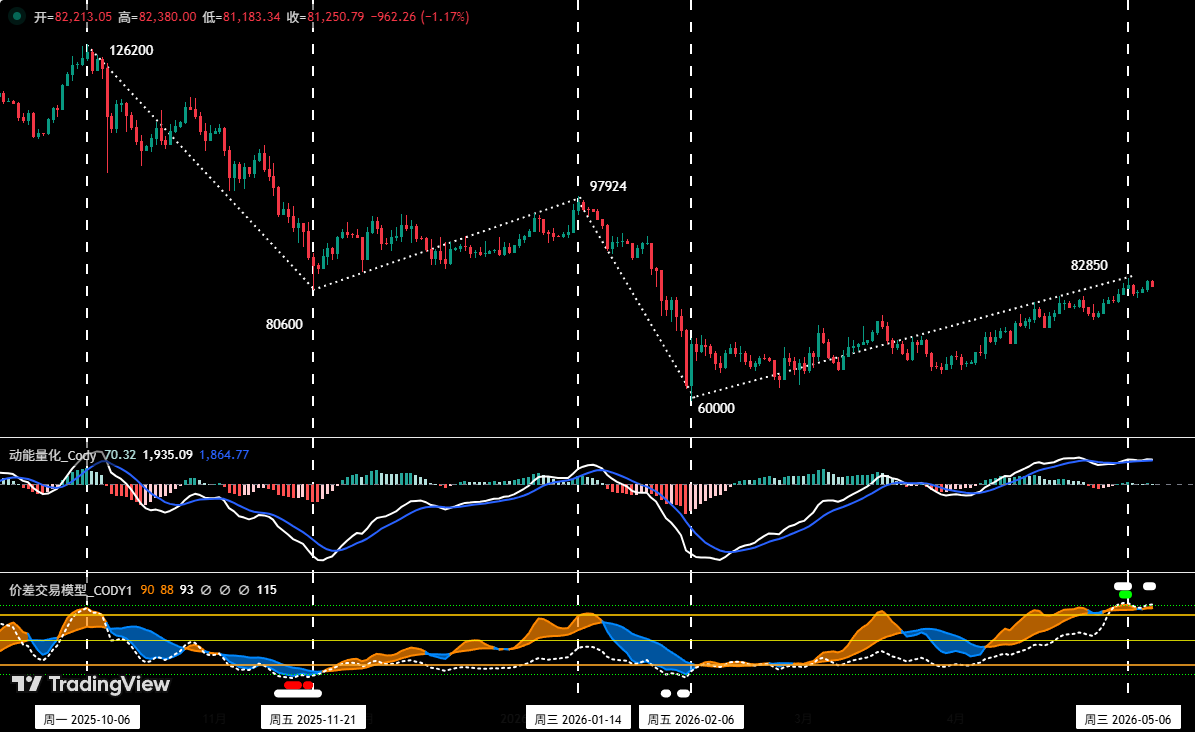
Chart One

As shown in (Chart One), since reaching the high of $126,200 in October 2025, Bitcoin has entered an adjustment cycle lasting about 7 months (216 days). There is significant divergence in the market regarding the subsequent direction. The bearish view argues that the downtrend is not over yet; after the recent rebound concludes, the price will still correct and break below the $60,000 low. The bullish view believes that the adjustment starting from $126,200 ended at $60,000, marking a reversal of the correction trend. The rebound since February is the start of a new upward trend. Next, we will analyze this daily chart correction structure based on Elliott Wave Theory rules and propose three technical scenarios for the subsequent movement for your reference.

1. Scenario One: Adjustment Concluded, New Rising Wave Initiated (Bullish View)

This view holds: The daily-level adjustment starting from the previous high of $126,200 is an A-B-C three-wave structure, with Wave C ending at $60,000. Currently, Major Wave I (the initial rising wave) is underway.

Wave A (Decline): $126,200 (2025-10-06) to $80,600 (2025-11-21), lasting 46 days, maximum decline ~36%.
Wave B (Rebound): $80,600 (2025-11-21) to $97,924 (2026-01-14), lasting 54 days, maximum increase ~21.5%.
Wave C (Decline): $97,924 (2026-01-14) to $60,000 (2026-02-06), lasting 23 days, maximum decline ~38.7%.
• Major Wave I (Initial Rising Wave): $60,000 (2026-02-06) to present, has run for 94 days, maximum increase ~38.1% so far, still ongoing.
• Potential Major Wave II (Correction Wave): The adjustment wave to run after Major Wave I ends. Its low point will not break below $60,000.

2. Scenario Two: Complex Five-Wave Adjustment Structure, Currently in Wave D Rebound (Bearish View One)

This view holds: The daily-level adjustment starting from the previous high of $126,200 may complete as an A-B-C-D-E five-wave structure. Currently, Wave D rebound is underway.

Wave A (Decline): $126,200 (2025-10-06) to $80,600 (2025-11-21), lasting 46 days, maximum decline ~36%.
Wave B (Rebound): $80,600 (2025-11-21) to $97,924 (2026-01-14), lasting 54 days, maximum increase ~21.5%.
Wave C (Decline): $97,924 (2026-01-14) to $60,000 (2026-02-06), lasting 23 days, maximum decline ~38.7%.
• Wave D (Rebound Wave): $60,000 (2026-02-06) to present, has run for 94 days, maximum increase ~38.1% so far, still ongoing.
• Potential Wave E (Decline Wave): The correction wave to run after Wave D rebound ends. Its low point may break below $60,000.

3. Scenario Three: Larger-Level Adjustment Structure (e.g., Weekly), Currently in Wave B Rebound (Bearish View Two)

This view holds: The daily-level adjustment starting from the previous high of $126,200 may be part of a larger-level A-B-C three-wave adjustment structure. Currently, Wave B rebound is underway.

Wave A (Decline): $126,200 (2025-10-06) to $60,000 (2026-02-06), lasting 112 days, maximum decline ~52.5%.
• Wave B (Rebound Wave): $60,000 (2026-02-06) to present, lasting 94 days, maximum increase ~38.1% so far, still ongoing.
• Potential Wave C (Decline Wave): The correction wave to run after Wave B rebound ends. Its low point may break below $60,000.

4. Summary:

• From the perspective of Elliott Wave time rules and pattern harmony, in Scenario Two, Waves B and D are rebound waves of the same degree. However, the current Wave D rebound cycle (94 days) has significantly exceeded the Wave B rebound cycle (54 days). Therefore, due to the excessive extension of Wave D in the time dimension, it disrupts the balance of the wave structure, thereby significantly reducing the probability of this scenario occurring.
• Based on the above analysis, if Scenario Two is excluded, the probability of the market choosing Scenario One (bullish) and Scenario Three (bearish) increases accordingly. As for which of the two has a higher probability, it involves a comprehensive judgment of multiple dimensions, which we will delve into in the next weekly review.

2. In-depth Analysis of BTC's Hourly Chart Structure: (Using the 4-hour chart as the analysis timeframe)

Bitcoin _ 4-hour Candlestick Chart
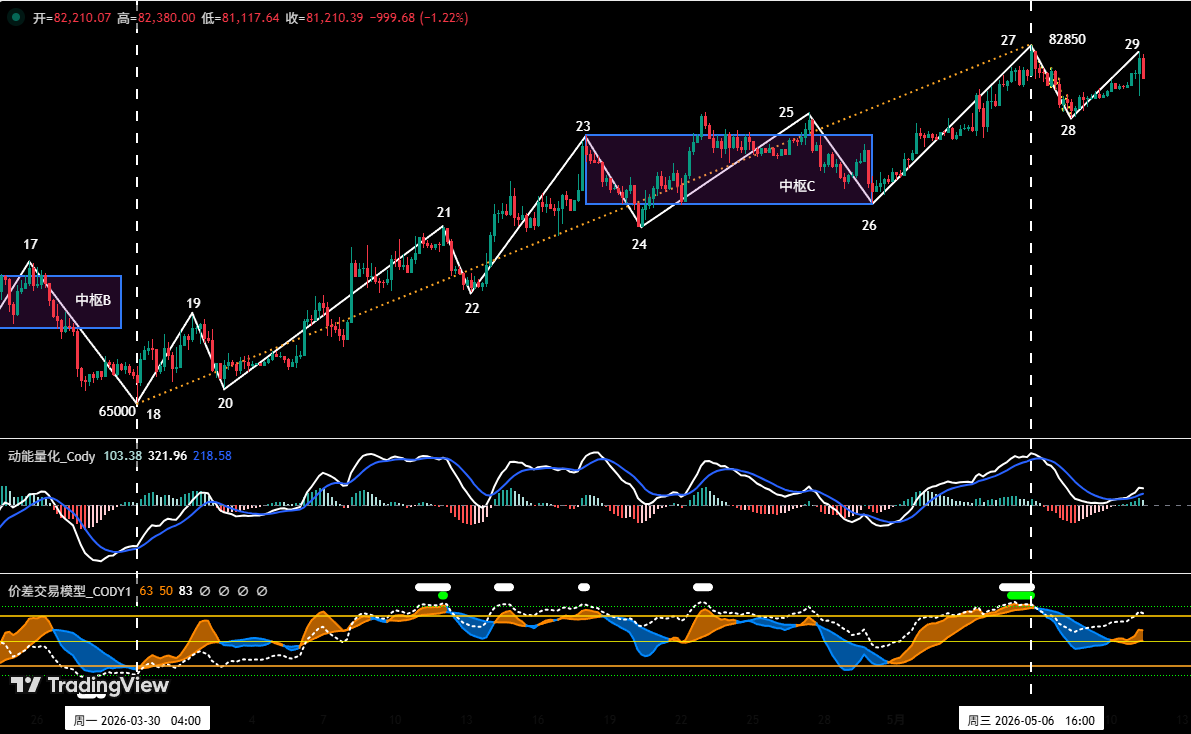
Chart Two

As shown in (Chart Two), the price is currently above central pivot C and is developing segment 28-29.

• If the price effectively holds support above the upper boundary of central pivot C (around $78,500), the high-range wide oscillation pattern will be maintained.
• If the price effectively breaks below the lower boundary of central pivot C (around $75,000), a daily-level correction may initiate.

Two: Bitcoin's Market Forecast and Trading Strategies for This Week

1. BTC Market Forecast for This Week:

Core view this week: The key to this week's movement lies in observing the battle between bulls and bears over the upper and lower boundaries of central pivot C. The gain or loss of this area can serve as an important basis for judging whether the price can continue its rebound or turn downward for adjustment.

2. Core Resistance Levels:

• First Resistance Zone: $83,500~$84,500 region (previous area of concentrated bulls/bears transactions)
• Second Resistance Zone: $89,000~$90,500 region (previous consolidation platform)

3. Core Support Levels:

• First Support Level: $78,500~$79,500 region (near the upper boundary of the central pivot)
• Second Support Level: $73,500~$75,000 region (previous important support level)
• Third Support Level: $69,500~$70,500 region (previous important support level)

4. Trading Strategies for This Week (Excluding Impact of Sudden News)

1. Mid-term Strategy:

Bitcoin _ Daily Candlestick Chart: (Position Monitoring Model)
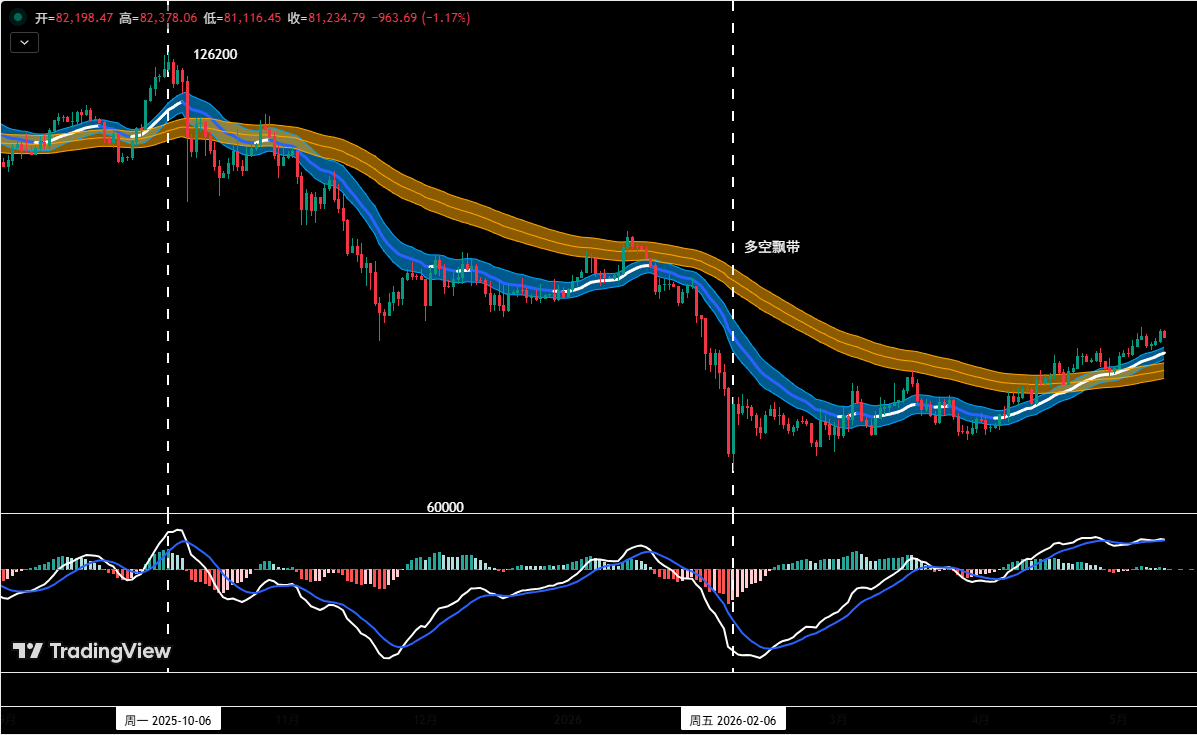
Chart Three

Position Monitoring Model: As shown in (Chart Three), based on trading rules, the market's mid-term direction is not yet clear. This week, the mid-term strategy is to maintain a cash position and wait patiently, avoiding chasing rallies or selling off in panic, until the direction becomes clear before entering positions.

2. Short-term Strategy: Use 30% of capital, set stop-loss points, and look for "price difference" opportunities based on support and resistance levels. (Use 30-minute/60-minute charts as the operation timeframe).

3. In short-term operations, to dynamically respond to the market's complex evolution, we have prepared two specific operation plans in advance, A/B.

Plan A: Effective Holding Above, Go Long on Dips.

• Entry: When the price effectively holds above the $78,500~$79,500 region and combines with bottom signals from the quantitative model, a long position below 20% can be established.
• Risk Control: Initial stop-loss set below $78,500.
• Exit: When rebounding near important resistance levels and combined with model signals, gradually close positions to take profits.

Plan B: Effective Break Below Support, Go Short on Rallies.

• Entry: When the price effectively breaks below the $73,500~$75,000 support region and combines with top signals from the model, a short position below 30% can be established.
• Risk Control: Initial stop-loss set above $76,500.
• Exit: When declining to important support levels and combined with model signals, gradually close positions to take profits.

Three: Analysis of HYPE's Daily Chart Price Structure:

HYPE_ Daily Candlestick Chart
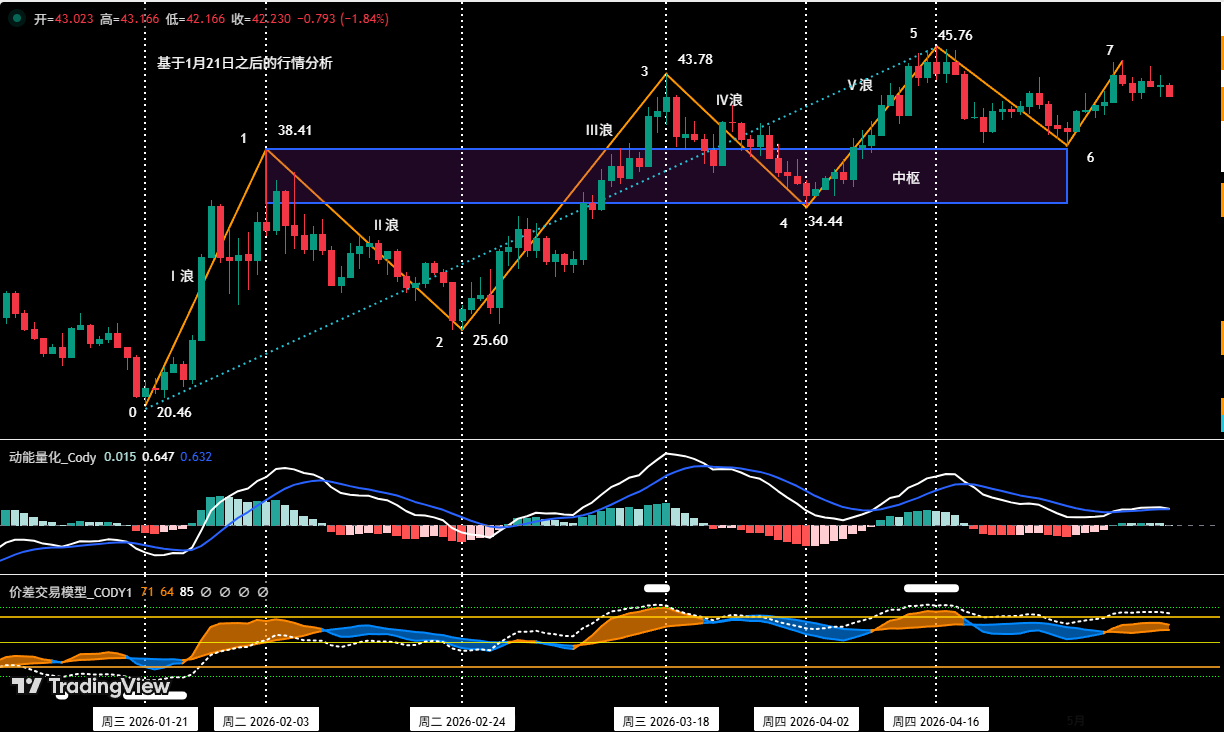
Chart Four

1. As shown in (Chart Four), the uptrend of HYPE starting from the low of $20.46 on January 21 can be divided into a seven-segment structure in the daily chart: 0-1, 1-2, 2-3, 3-4, 4-5, 5-6, 6-7. In the first five segments, prices continuously made new highs, forming a volatile rising structure. In the last two segments, because endpoint 7 ($44.79) is lower than endpoint 5 ($45.76), it is currently viewed as a correction structure.

2. (Chart Four) shows that because the price movements of segments 1-2, 2-3, and 3-4 overlap with each other, they together form an "uptrend central pivot."

Four: HYPE's Market Forecast and Short-Term Trading Strategies for This Week

1. HYPE Market Forecast for This Week:

Core view on HYPE this week:

• Focus on observing whether the price can break through the previous high of $45.76 in subsequent movements. A breakout would indicate the current movement is still within the daily-level uptrend structure.
• Pay attention to the battle between bulls and bears near the upper and lower boundaries of the central pivot.

2. HYPE Short-Term Trading Strategies for This Week:

• This week's short-term operations will be formulated based on the gain or loss of the two key price levels: the upper boundary of the central pivot ($38.41) and the lower boundary of the central pivot ($34.44).
• Long Strategy: If the price retraces to near $38.41, finds support, shows signs of stabilization, and combines with bottom signals triggered by the two major models, consider a light long position. Position size must be controlled below 30%, and stop-loss discipline must be strictly observed.
• Short Strategy: If the price effectively breaks below the support near $34.44 and combines with top signals triggered by the two major models, consider a light short position. Position size must be controlled below 30%, and stop-loss discipline must be strictly observed.

Five: Special Reminders:

1. When opening a position: Immediately set the initial stop-loss level.
2. When profit reaches 1%: Move the stop-loss to the entry cost price (breakeven point) to ensure capital safety.
3. When profit reaches 2%: Move the stop-loss to the level representing a 1% profit.
4. Continuous tracking: Thereafter, for every additional 1% profit in price, move the stop-loss up 1% accordingly, dynamically protecting and locking in profits.

Financial markets change rapidly. All market analysis and trading strategies require dynamic adjustment. All views, analysis models, and operation strategies mentioned in this article originate from personal technical analysis and are solely for personal trading log purposes. They do not constitute any investment advice or basis for operation. Markets involve risks; investing requires caution. Please do not make decisions based solely on this content.


Trend Kriptolar

İlgili Sorular

QAccording to the article, what are the three technical wave-based scenarios for BTC's future trend after its correction cycle?

AThe three wave-based scenarios for BTC's future trend are: 1) Adjustment complete, new uptrend initiated (Bullish view - A-B-C correction finished, now in major Wave I up). 2) Complex five-wave correction structure, currently in Wave D rebound (Bearish view one - A-B-C-D-E structure, in Wave D). 3) Larger-degree (e.g., weekly) correction structure, currently in Wave B rebound (Bearish view two - larger A-B-C structure, in Wave B).

QWhy does the article consider the probability of the second scenario (five-wave correction) to be low?

AThe probability of the second scenario (five-wave correction) is considered low because in this scenario, Wave B and Wave D are supposed to be corrective waves of the same degree. However, the current Wave D rebound has lasted 94 days, which significantly exceeds the 54-day duration of the prior Wave B rebound. This excessive extension in the time dimension disrupts the equilibrium of the wave structure, thus greatly reducing its likelihood.

QWhat is the key price zone for judging whether BTC can continue its rebound or start a downward adjustment this week?

AThe key price zone for judging BTC's direction this week is the area defined by the upper and lower rails of 'Central C' on the 4-hour chart. Specifically, observing whether the price effectively holds above the upper rail (around $78,500-$79,500) or breaks below the lower rail (around $75,000) is crucial. Holding above suggests maintaining a wide-range oscillation, while breaking below may initiate a daily-level adjustment.

QWhat is the critical price level for HYPE this week, and what does its breakthrough signify?

AThe critical price level for HYPE this week is the previous high of $45.76. The article states that whether the price can break through this level in subsequent movements is a key focus. A successful breakthrough would indicate that the current price action is still within the daily-level upward structure.

QWhat are the two specific short-term operation plans (A and B) provided for BTC, and what are their respective triggers?

AThe two short-term operation plans for BTC are: Plan A (Effective Holding, Go Long on Dips): Triggered when the price effectively holds above the $78,500-$79,500 area, combined with a bottom signal from the quantitative model. A long position of less than 20% can be established. Plan B (Effective Break of Support, Go Short on Rebound): Triggered when the price effectively breaks below the $73,500-$75,000 support area, combined with a top signal from the model. A short position of less than 30% can be established.

İlgili Okumalar

Anthropic Creates an AI Jailbreak 'Penal Code': Your Requests, Four Ways to Die

Anthropic has publicly detailed its security measures and a new "Cyber Jailbreak Severity" (CJS) framework following the controversial takedown of its Fable 5 model. The incident, triggered by simple user requests like counting letters or stating a profession, highlighted overzealous safety filters. Anthropic classifies cybersecurity-related prompts into four tiers: malicious activities (blocked), high-risk dual-use (like pentesting, with strict limits), low-risk dual-use (often blocked by "safety margin" errors), and harmless tasks (theoretically allowed but still frequently flagged). The company admits its classifiers are tuned for high sensitivity, leading to many false positives. The newly proposed CJS framework aims to objectively score the severity of AI "jailbreaks" (prompts that bypass safety rules) on a 0-10 scale across four dimensions: Capability Gain (does it grant new attack abilities?), Breadth (does it work across multiple attack types?), Weaponization Ease (how hard is it to turn into a real attack?), and Discoverability (how easy is it to find?). The score determines the response, from no action (CJS-0) to a potential model takedown (CJS-4). The score is context-dependent; for example, discovering a major unknown vulnerability today scores high, while asking about a well-known one scores low. The article raises concerns about Anthropic's dual role: it is both creating powerful models (like the restricted Mythos 5) and defining the rules (CJS) for judging their misuse, potentially giving it disproportionate influence. This is set against the backdrop of U.S. export controls, which for the first time directly restricted API access to a model (Fable 5), creating a "tiered" system where public models are heavily filtered and advanced ones are limited to vetted partners. The CJS framework is portrayed as potentially providing regulators with a metric to justify future API shutdowns. For users, the advice is to carefully phrase prompts, watch for signs of being downgraded to a weaker model, and wait indefinitely for promised filter improvements.

marsbit10 dk önce

Anthropic Creates an AI Jailbreak 'Penal Code': Your Requests, Four Ways to Die

marsbit10 dk önce

$100M Annual Revenue, Two Berkeley Roommates in Their 20s Build the Most Profitable AI Business

Arena, the AI model ranking platform, has become a $100 million annual revenue business just eight months after launching its commercial service. Originally a UC Berkeley open-source research project called Chatbot Arena, it created a "battle arena" where users blind-test and vote on anonymous AI model responses. This has generated a highly trusted, community-driven leaderboard based on over 10 million user evaluations and 82 million votes. Major AI companies like OpenAI, Google, and Anthropic submit their flagship models to be ranked. The core monetization strategy is its AI Evaluations service, where model developers and large enterprises pay for in-depth performance analysis from Arena's massive user community. This provides real-world feedback on model strengths, weaknesses, and hallucinations—a critical service as models become more complex. The company, spun out from Berkeley in early 2025, quickly raised $100 million in seed funding at a $600 million valuation and later secured a $150 million Series A at a $1.7 billion valuation. The founding team includes CEO Anastasios Angelopoulos, a mathematician focused on rigorous model evaluation; CTO Wei-Lin Chiang, creator of the popular Vicuna chatbot; and co-founder Ion Stoica, a renowned Berkeley professor. Arena is now expanding beyond chat benchmarks into "Agent Mode," evaluating AI agents on complex, multi-step tasks like coding and research. The company's success illustrates the growing value and cost of independent, real-world AI model evaluation as the industry intensifies.

marsbit15 dk önce

$100M Annual Revenue, Two Berkeley Roommates in Their 20s Build the Most Profitable AI Business

marsbit15 dk önce

Racking Up 24,000 Stars: With One Command, AI Can Now Find Its Own Skills

Vercel, known for its developer tools like Next.js, has launched 'skills', a package manager for AI coding agents, garnering 24,000 GitHub stars. It allows developers to add specialized capabilities, such as React best practices, to AI assistants like Claude Code or Cursor with a single command: `npx skills add <package>`. Skills are shareable, reusable modules that define an AI agent's behavior for specific tasks, moving beyond one-off prompt engineering towards standardized 'capability engineering'. A key innovation is the 'find-skills' skill, which acts as an internal search engine, allowing an agent to autonomously find and install the right skill for a user's request. This lowers the barrier for non-developers to leverage advanced AI coding assistance. However, this 'npm moment' for AI brings significant security risks. Security audits of thousands of skills on platforms like skills.sh and ClawHub found over 30% contained security flaws, with about 13% classified as severe. Threats include malicious scripts that can access local files and credentials, and prompt injection hidden within skill documentation. Unlike traditional code packages, skills blend instructions, code, and system access, posing a direct risk to user machines and data. Experts advise treating skills like code—reviewing them carefully before installation, especially their scripts, and being wary of excessive permissions. Ultimately, Vercel's initiative represents a major shift towards modular, reusable AI capabilities, but its rapid adoption requires developers to bring the same caution used in managing traditional software dependencies.

marsbit16 dk önce

Racking Up 24,000 Stars: With One Command, AI Can Now Find Its Own Skills

marsbit16 dk önce

Claude Engineer Finally Unveils Fable 5's Ultimate Strategy, Teaching You How to Bridge the Information Gap with AI Models

This article, titled "Claude Engineer Finally Releases Fable 5 'Skill-Burning' Guide, Teaching How to Bridge the Information Gap with Models," details a blog post by Claude Code engineer Thariq Shihipar. The core concept is the "information gap" or "unknowns"—the disconnect between a user's instructions (the "map") and the actual task requirements (the "territory"). The article argues that with powerful models like Claude Fable 5, work quality depends on the user's ability to identify and clarify these unknowns. Shihipar categorizes unknowns into four types: Known Knowns (explicit instructions), Known Unknowns (awareness of gaps), Unknown Knowns (implicit, unstated knowledge), and Unknown Unknowns (unforeseen issues). The blog provides a framework for addressing these gaps throughout the workflow: * **Before Implementation:** Techniques include "Blindspot Scanning" to uncover Unknown Unknowns, brainstorming/prototyping for visual or complex tasks, having Claude ask clarifying questions, using reference code/examples, and creating implementation plans. * **During Implementation:** Maintaining an "implementation notes" file for Claude to document deviations and decisions made due to encountered edge cases. * **After Implementation:** Creating summary documents for review and having Claude generate quizzes to ensure the user fully understands the completed changes. The article concludes that as models become more capable, the key to success is systematically discovering and defining these unknowns through low-cost methods like prototyping and planning, allowing for more effective collaboration.

marsbit20 dk önce

Claude Engineer Finally Unveils Fable 5's Ultimate Strategy, Teaching You How to Bridge the Information Gap with AI Models

marsbit20 dk önce

İşlemler

Spot

Popüler Makaleler

BITCOIN Nedir

HarryPotterObamaSonic10Inu (ERC-20)'yu ve Kripto Alanındaki Yerini Anlamak Son yıllarda, kripto para piyasası, hem ticaret yapanların hem de topluluk etkileşimi ve eğlence değeri arayanların ilgisini çeken meme coin'lerin popülaritesinde bir artış gördü. Bu benzersiz token'lar arasında, kripto para dokusuna kültürel referansları harmanlayan ilginç bir proje olan HarryPotterObamaSonic10Inu (ERC-20) bulunmaktadır. Bu makale, HarryPotterObamaSonic10Inu'nun temel yönlerini, mekanizmalarını, topluluk odaklı ethosunu ve daha geniş kripto manzarasıyla etkileşimini incelemektedir. HarryPotterObamaSonic10Inu (ERC-20) Nedir? Adından da anlaşılacağı gibi, HarryPotterObamaSonic10Inu, Ethereum blok zinciri üzerinde inşa edilen bir meme coin'dir ve ERC-20 standardı altında sınıflandırılmaktadır. Geleneksel kripto paraların pratik kullanılabilirlik veya yatırım potansiyeline odaklandığı durumların aksine, bu token eğlence değeri ve topluluğunun gücü üzerine kuruludur. Proje, bağlı kullanıcıların bir araya gelebileceği, fikirlerini paylaşabileceği ve çeşitli kültürel fenomenlerden ilham alan etkinliklere katılabileceği bir ortam yaratmayı hedeflemektedir. HarryPotterObamaSonic10Inu'nun dikkate değer özelliklerinden biri işlemlerde sıfır vergi olmasıdır. Bu çekici unsur, küçük ölçekli yatırımcıları caydırabilecek ek ücretlerden yoksun olarak ticareti ve topluluk katılımını teşvik etmeyi amaçlamaktadır. Coin'in toplam arzı bir milyar token olarak belirlenmiştir; bu, topluluk içinde önemli bir dolaşım sağlama niyetini göstermektedir. HarryPotterObamaSonic10Inu (ERC-20) Yaratıcısı HarryPotterObamaSonic10Inu'nun kökenleri bir miktar gizemlidir; yaratıcısı hakkında spesifik bilgilerin ne olduğu bilinmemektedir. Bu token'ın geliştirilmesi, belirli bir ekip veya açık bir plan eksikliği ile gerçekleşmiştir; bu durum, meme coin sektöründe oldukça yaygındır. Proje, topluluğunun heyecanı ve katılımına dayalı olarak organik bir şekilde ortaya çıkmıştır. HarryPotterObamaSonic10Inu (ERC-20) Yatırımcıları Dış yatırımlar ve destekler söz konusu olduğunda, HarryPotterObamaSonic10Inu da belirsiz kalmaktadır. Token, bilinen herhangi bir yatırım fonunu veya önemli bir kurumsal desteği listelememektedir. Bunun yerine, projenin can damarı, kolektif eylem ve kripto alanındaki katılım yoluyla büyüme ve sürdürülebilirlik sağlayan temel topluluğudur. HarryPotterObamaSonic10Inu (ERC-20) Nasıl Çalışır? Bir meme coin olarak, HarryPotterObamaSonic10Inu, genellikle varlık değerini yöneten geleneksel çerçevelerin dışında çalışmaktadır. Projenin nasıl çalıştığını tanımlayan birkaç özelliği vardır: Sıfır Vergi İşlemleri: İşlemlerde vergi ücreti olmadan, kullanıcılar gizli maliyet endişesi olmadan token'ı serbestçe alıp satabilirler. Topluluk Etkileşimi: Proje, topluluk etkileşimi üzerine kuruludur ve sosyal medya platformlarını kullanarak heyecan yaratarak katılımı kolaylaştırır. Tartışmalar, içerik paylaşımı ve katılım, projenin erişimini genişletmeye ve destekleyiciler arasında sadakat oluşturmaya yardımcı olan kritik unsurlardır. Pratik Kullanılabilirlik Yok: HarryPotterObamaSonic10Inu'nun mali ekosistem içinde somut bir kullanılabilirlik sunmadığı belirtilmelidir. Daha ziyade, eğlence ve topluluk etkinlikleri için bir token olarak sınıflandırılmaktadır. Kültürel Referans: Token, popüler kültürden unsurları zekice harmanlayarak ilgi çekmektedir ve hem meme meraklıları hem de kripto takipçileriyle bağlantı kurmaktadır. HarryPotterObamaSonic10Inu, meme coin'lerin, daha geleneksel kripto para projelerinden nasıl farklı çalıştığını örneklendirmektedir; bu projeler, utilitarist varlıklar yerine yenilikçi sosyal yapıların bir parçası olarak piyasaya girmektedir. HarryPotterObamaSonic10Inu (ERC-20) Zaman Çizelgesi HarryPotterObamaSonic10Inu'nun tarihi, birkaç dikkate değer kilometre taşı ile işaretlenmiştir: Oluşum: Token, birçok kripto meraklısının hayal gücünü yakalayan bir viral meme'den ortaya çıkmıştır. Spesifik yaratım tarihleri mevcut değildir ve bu onun organik yükselişini vurgulamaktadır. Borsa Listelemeleri: HarryPotterObamaSonic10Inu, topluluğun daha kolay erişim ve ticaret yapabilmesini sağlamak için çeşitli borsalarda yer bulmuştur. Topluluk Katılım İnisiyatifleri: Yarışmalar, sosyal medya kampanyaları ve hayranlar ile destekçilerden içerik üretimini içeren topluluk etkileşimini artırmayı amaçlayan devam eden etkinlikler. Gelecek Genişleme Planları: Projenin yol haritası, kültürel temalarına ilişkin bir NFT koleksiyonu, ticari ürünler ve bir e-ticaret sitesi başlatılmasını içermektedir; bu da topluluğun daha fazla katılımını sağlamayı ve ekosistemine daha fazla boyut kazandırmayı hedeflemektedir. HarryPotterObamaSonic10Inu (ERC-20) Hakkında Kilit Noktalar Topluluk Odaklı Doğası: Proje, kullanıcı katılımını geliştirme önceliği taşır ve böylece kullanıcıların sürecin en önünde yer almasını sağlar. Meme Coin Sınıflandırması: Eğlenceye dayalı kripto paranın doruk noktasıdır ve geleneksel yatırım araçlarından ayrılmaktadır. Bitcoin ile Doğrudan İlişki Yok: Ticker ismindeki benzeliğe rağmen, HarryPotterObamaSonic10Inu ayırt edicidir ve Bitcoin veya diğer yerleşik kripto paralarla herhangi bir ilişkisi yoktur. İşbirliğine Odaklanma: HarryPotterObamaSonic10Inu, sahipleri arasında işbirliği ve hikaye paylaşımı için bir alan oluşturmak üzere tasarlanmıştır ve bu da yaratıcılık ve topluluk bağlarını sağlamaktadır. Gelecek Beklentileri: Başlangıçta belirlendiği temalardan NFTs ve ticari ürünlere genişleme arzusu, projenin dijital kültürde daha ana akıma girebilmesi için bir yol haritası çizmektedir. Meme coin'ler, kripto para topluluğunun hayal gücünü çalmaya devam ederken, HarryPotterObamaSonic10Inu (ERC-20), kültürel bağları ve topluluk merkezli yaklaşımıyla öne çıkmaktadır. Geleneksel bir hizmet odaklı token modeliyle uyumlu olmasa da, özünde destekçileri arasında sağlanan neşe ve dostluğu vurgulayarak, giderek dijitalleşen bir çağda kripto paraların evrilen doğasını göstermektedir. Proje gelişmeye devam ettikçe, topluluk dinamiklerinin blockchain teknolojisi dünyasındaki seyrini nasıl etkilediğini izlemek önemli olacaktır.

2.1k Toplam GörüntülenmeYayınlanma 2024.04.01Güncellenme 2024.12.03

BITCOIN Nedir

BTC Nasıl Satın Alınır

HTX.com’a hoş geldiniz! Bitcoin (BTC) satın alma işlemlerini basit ve kullanışlı bir hâle getirdik. Adım adım açıkladığımız rehberimizi takip ederek kripto yolculuğunuza başlayın. 1. Adım: HTX Hesabınızı OluşturunHTX'te ücretsiz bir hesap açmak için e-posta adresinizi veya telefon numaranızı kullanın. Sorunsuzca kaydolun ve tüm özelliklerin kilidini açın. Hesabımı Aç2. Adım: Kripto Satın Al Bölümüne Gidin ve Ödeme Yönteminizi SeçinKredi/Banka Kartı: Visa veya Mastercard'ınızı kullanarak anında Bitcoin (BTC) satın alın.Bakiye: Sorunsuz bir şekilde işlem yapmak için HTX hesap bakiyenizdeki fonları kullanın.Üçüncü Taraflar: Kullanımı kolaylaştırmak için Google Pay ve Apple Pay gibi popüler ödeme yöntemlerini ekledik.P2P: HTX'teki diğer kullanıcılarla doğrudan işlem yapın.Borsa Dışı (OTC): Yatırımcılar için kişiye özel hizmetler ve rekabetçi döviz kurları sunuyoruz.3. Adım: Bitcoin (BTC) Varlıklarınızı SaklayınBitcoin (BTC) satın aldıktan sonra HTX hesabınızda saklayın. Alternatif olarak, blok zinciri transferi yoluyla başka bir yere gönderebilir veya diğer kripto para birimlerini takas etmek için kullanabilirsiniz.4. Adım: Bitcoin (BTC) Varlıklarınızla İşlem YapınHTX'in spot piyasasında Bitcoin (BTC) ile kolayca işlemler yapın.Hesabınıza erişin, işlem çiftinizi seçin, işlemlerinizi gerçekleştirin ve gerçek zamanlı olarak izleyin. Hem yeni başlayanlar hem de deneyimli yatırımcılar için kullanıcı dostu bir deneyim sunuyoruz.

8.0k Toplam GörüntülenmeYayınlanma 2024.12.12Güncellenme 2026.06.02

BTC Nasıl Satın Alınır

$BITCOIN Nedir

DİJİTAL ALTIN ($BITCOIN): Kapsamlı Bir Analiz DİJİTAL ALTIN ($BITCOIN) Tanıtımı DİJİTAL ALTIN ($BITCOIN), geleneksel değerli metallerin özelliklerini merkeziyetsiz teknolojilerin yeniliği ile birleştirmeyi amaçlayan Solana ağı üzerinde çalışan blockchain tabanlı bir projedir. Bitcoin ile aynı isme sahip olmasına rağmen, genellikle bir değer saklama aracı olarak algılandığı için “dijital altın” olarak anılmaktadır; DİJİTAL ALTIN, Web3 ortamında benzersiz bir ekosistem yaratmak için tasarlanmış ayrı bir tokendir. Hedefi, uygulanabilir bir alternatif dijital varlık olarak kendini konumlandırmaktır, ancak uygulamaları ve işlevleri ile ilgili ayrıntılar hala gelişmektedir. DİJİTAL ALTIN ($BITCOIN) Nedir? DİJİTAL ALTIN ($BITCOIN), Solana blockchain'inde kullanılmak üzere açıkça tasarlanmış bir kripto para tokenidir. Bitcoin'in yaygın olarak tanınan bir değer saklama rolü sağlamasının aksine, bu token daha geniş uygulamalara ve özelliklere odaklanıyor gibi görünmektedir. Dikkate değer yönler şunlardır: Blockchain Altyapısı: Token, yüksek hızlı ve düşük maliyetli işlemleri yönetme kapasitesi ile bilinen Solana blockchain'inde inşa edilmiştir. Arz Dinamikleri: DİJİTAL ALTIN'ın maksimum arzı 100 katrilyon token (100P $BITCOIN) ile sınırlıdır, ancak dolaşımdaki arzı ile ilgili ayrıntılar şu anda açıklanmamıştır. Kullanım Alanı: Kesin işlevler açıkça belirtilmemiş olsa da, token'ın merkeziyetsiz uygulamalar (dApps) veya varlık tokenizasyon stratejileri ile ilgili çeşitli uygulamalar için kullanılabileceğine dair işaretler bulunmaktadır. DİJİTAL ALTIN ($BITCOIN) Yaratıcısı Kimdir? Şu anda, DİJİTAL ALTIN ($BITCOIN) arkasındaki yaratıcıların ve geliştirme ekibinin kimliği bilinmemektedir. Bu durum, merkeziyetsiz finans ve meme coin fenomenleriyle uyumlu olan birçok yenilikçi proje arasında yaygındır. Böyle bir anonimlik, topluluk odaklı bir kültürü teşvik edebilirken, yönetişim ve hesap verebilirlik konusundaki endişeleri artırmaktadır. DİJİTAL ALTIN ($BITCOIN) Yatırımcıları Kimlerdir? Mevcut bilgiler, DİJİTAL ALTIN ($BITCOIN) için bilinen herhangi bir kurumsal destekçi veya önde gelen risk sermayesi yatırımı olmadığını göstermektedir. Proje, geleneksel finansman yolları yerine topluluk desteği ve benimsemeye odaklanan bir eşler arası modelde çalışıyor gibi görünmektedir. Faaliyetleri ve likiditesi esas olarak PumpSwap gibi merkeziyetsiz borsalarda (DEX'ler) yer almakta olup, bu da onun taban hareketine vurgu yapmaktadır. DİJİTAL ALTIN ($BITCOIN) Nasıl Çalışır DİJİTAL ALTIN ($BITCOIN) 'ın operasyonel mekanikleri, blockchain tasarımı ve ağ özellikleri temelinde açıklanabilir: Konsensüs Mekanizması: Solana'nın benzersiz tarih kanıtı (PoH) ile bir hisse kanıtı (PoS) modelini birleştirerek, proje ağın yüksek performansına katkıda bulunan verimli işlem doğrulamasını sağlar. Tokenomik: Belirli deflasyonist mekanizmalar kapsamlı bir şekilde detaylandırılmamış olsa da, geniş maksimum token arzı, henüz tanımlanmamış mikro işlemler veya niş kullanım durumlarına hitap edebileceğini ima etmektedir. Etkileşim: Solana'nın daha geniş ekosistemi ile entegrasyon potansiyeli bulunmaktadır; bu, çeşitli merkeziyetsiz finans (DeFi) platformlarını içermektedir. Ancak, belirli entegrasyonlarla ilgili ayrıntılar belirtilmemiştir. Önemli Olayların Zaman Çizelgesi DİJİTAL ALTIN ($BITCOIN) ile ilgili önemli kilometre taşlarını vurgulayan bir zaman çizelgesi: 2023: Token'ın Solana blockchain'inde ilk dağıtımı, sözleşme adresi ile işaretlenmiştir. 2024: DİJİTAL ALTIN, PumpSwap gibi merkeziyetsiz borsalarda işlem görmeye başladıkça görünürlük kazanır ve kullanıcıların bunu SOL karşısında ticaret yapmasına olanak tanır. 2025: Proje, topluluk odaklı etkileşimlere yönelik potansiyel ilgi ve ara sıra ticaret faaliyetleri görür, ancak şu ana kadar dikkate değer ortaklıklar veya teknik ilerlemeler belgelenmemiştir. Kritik Analiz Güçlü Yönler Ölçeklenebilirlik: Temel Solana altyapısı, yüksek işlem hacimlerini destekleyerek $BITCOIN'in çeşitli işlem senaryolarındaki faydasını artırabilir. Erişilebilirlik: Token başına potansiyel düşük ticaret fiyatı, perakende yatırımcıları çekebilir ve parçalı mülkiyet fırsatları sayesinde daha geniş katılımı kolaylaştırabilir. Riskler Şeffaflık Eksikliği: Kamuya açık olarak bilinen destekçilerin, geliştiricilerin veya bir denetim sürecinin olmaması, projenin sürdürülebilirliği ve güvenilirliği konusunda şüpheler doğurabilir. Piyasa Volatilitesi: Ticaret faaliyeti büyük ölçüde spekülatif davranışa dayanmakta olup, bu da yatırımcılar için önemli fiyat dalgalanmalarına ve belirsizliklere yol açabilir. Sonuç DİJİTAL ALTIN ($BITCOIN), hızla gelişen Solana ekosisteminde ilginç ama belirsiz bir proje olarak ortaya çıkmaktadır. “Dijital altın” anlatısını kullanmaya çalışırken, Bitcoin'in değer saklama rolünden ayrılması, amaçlanan faydasının ve yönetişim yapısının daha net bir şekilde tanımlanması gerekliliğini vurgulamaktadır. Gelecekteki kabul ve benimseme, mevcut belirsizliklerin giderilmesine ve operasyonel ile ekonomik stratejilerinin daha açık bir şekilde tanımlanmasına bağlı olacaktır. Not: Bu rapor, Ekim 2023 itibarıyla mevcut olan sentezlenmiş bilgileri kapsamaktadır ve araştırma döneminin ötesinde gelişmeler yaşanmış olabilir.

164 Toplam GörüntülenmeYayınlanma 2025.05.13Güncellenme 2025.05.13

$BITCOIN Nedir

Tartışmalar

HTX Topluluğuna hoş geldiniz. Burada, en son platform gelişmeleri hakkında bilgi sahibi olabilir ve profesyonel piyasa görüşlerine erişebilirsiniz. Kullanıcıların BTC (BTC) fiyatı hakkındaki görüşleri aşağıda sunulmaktadır.

活动图片