# Divergence İlgili Makaleler

HTX Haber Merkezi, kripto endüstrisindeki piyasa trendleri, proje güncellemeleri, teknoloji gelişmeleri ve düzenleyici politikaları kapsayan "Divergence" hakkında en son makaleleri ve derinlemesine analizleri sunmaktadır.

Number of Active XRP Addresses Reaches Two-Month High Amid Worsening Market Sentiment

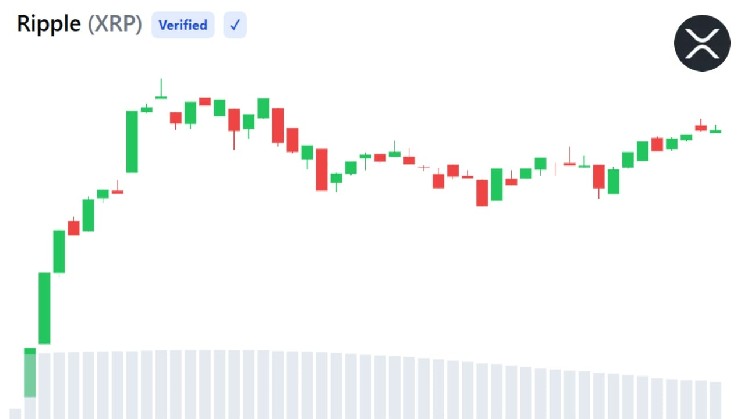
On August 14th, activity on the XRP Ledger surged to a two-month high, with 49,929 active addresses recorded in a 24-hour period. This spike occurred despite market sentiment towards XRP hitting a three-month low, as the token traded below $1, highlighting a sharp divergence between on-chain activity and retail investor mood. The data from Santiment shows that average daily active addresses had already risen to around 35,700 by August 12th, up from approximately 26,400 in July—a nearly 35% increase. However, the number of new addresses remained flat, suggesting the surge was driven by existing addresses becoming more active rather than an influx of new users. Analysts caution that while high address activity indicates increased network participation, it doesn't specify whether the activity stems from new investors, institutional moves, exchange transactions, or existing holders. Concurrently, the bearish sentiment, tracked from social platforms like X and Reddit, reflects crowd psychology rather than fundamental network health. The report notes that the XRP Ledger's validator-based consensus allows for such on-chain activity to grow independently of short-term price pessimism. Furthermore, broader ecosystem development, including Ripple's reported $550 million in investments since 2017 into grants and institutional infrastructure for tokenized assets, provides a long-term context separate from current price trends. The key question is whether the elevated address activity will be sustained beyond the single-day spike amidst ongoing negative sentiment, or if it represents only a temporary divergence.

cryptonews.ruŞimdi

Number of Active XRP Addresses Reaches Two-Month High Amid Worsening Market Sentiment

cryptonews.ruŞimdi

Bitcoin Adjustment Signal Confirmed, HYPE Bull-Bear Divergence Intensifies | Invited Analysis

Bitcoin Adjustment Signal Confirmed, HYPE Faces Key Resistance Battle | Analysis This week's analysis indicates Bitcoin's daily cycle Wave A rebound likely peaked on July 21st, with the market entering a Wave B correction phase. For HYPE, price action is contested at the critical $60–$63.5 resistance zone, with its path yet to be determined. **Bitcoin (BTC) Analysis & Strategy:** * **Structure:** Analysis suggests the corrective move from the May 6th high has formed a four-segment structure. The rebound from the July 1st low (~$57,820) is likely Wave A, completed around $66,955. The market is now likely in Wave B correction, with a potential Wave C rebound to follow, provided the $57,820 low holds. * **4-Hour View:** A seven-segment rebound from the July 1st low shows momentum divergence, indicating the rally may have ended, with a correction now underway. Price is currently testing a pullback after breaking below $65,700. * **Weekly Outlook & Levels:** * **Key Pressure:** Watch price action around the $65,700–$67,300 retest and the $60,950–$61,500 support zone. * **Resistance:** $65,700–$67,300; $69,500–$71,000. * **Support:** ~$63,700; $60,950–$61,500; ~$57,820. * **Strategy:** Mid-term positioning has increased short exposure to ~40% based on model signals. Short-term tactics (30% capital) involve two scenarios: **A)** Testing shorts in the $65,700–$67,300 resistance area upon bearish signals; **B)** Testing longs near the $57,820 support upon bullish reversal signals. **HYPE Analysis & Strategy:** * **Structure:** The correction from the July 7th high ($72.97) has formed a ten-segment structure on the 4-hour chart, including a five-segment declining pivot. The current bounce faces two potential paths: 1) A corrective rally if the $56.47 low holds, or 2) Further decline below $56.47 after forming a new declining pivot. * **Weekly Outlook & Levels:** The key is monitoring the battle between the $60–$63.5 resistance band and the ~$56.47 support. * **Resistance:** $60–$63.5; $68–$69.5; ~$72.97. * **Support:** ~$56.47; $52–$55. * **Strategy:** Consider light short positions (under 20% capital) if price rallies into the $60–$63.5 zone and shows clear reversal signals, with strict stop-loss discipline. **Trade Review:** A recent short BTC trade was executed at ~$66,319 and closed at ~$65,192, yielding a ~1.70% profit, based on signals from proprietary quant models. **Risk Disclaimer:** Markets are dynamic; all analysis and strategies require constant adjustment. This content is for informational purposes only, representing personal technical analysis, and is not investment advice. Trade at your own risk.

Odaily星球日报07/27 12:44
Bitcoin Adjustment Signal Confirmed, HYPE Bull-Bear Divergence Intensifies | Invited Analysis

Odaily星球日报07/27 12:44

BIT Research: If It Followed Nasdaq, Bitcoin Should Be Close to $140,000

BIT Research: Bitcoin Price Analysis Under Inflation Re-pricing The market is currently undergoing a macro adjustment phase dominated by inflation re-pricing. Analysis suggests that if Bitcoin had continued to follow Nasdaq's trajectory, its theoretical price would be near $140,000. However, a significant divergence between the two assets has emerged since October 2025. The core reason is the resurgence of US inflation, which has led to a reversal in market expectations for the Federal Reserve's rate-cut path. Recent data shows US CPI rising to 3.8% and PPI to 6.0%, prompting markets to scale back expectations for 2026 rate cuts. For Bitcoin, the previous supportive narrative of anticipated loose liquidity is weakening. Concurrently, escalating tensions involving Iran have driven oil prices up approximately 40% since late February 2026, heightening inflation concerns through rising energy costs. While the market currently views this inflation surge as a temporary pressure point, the interplay between energy, interest rates, and risk appetite is prompting a reassessment of the potential for a prolonged high-rate environment. In this context, Bitcoin has begun to underperform tech stocks, which can benefit from nominal inflation. The divergence stems from a key distinction: Bitcoin's past rallies were driven by loose liquidity and rate-cut expectations, not inflation itself. As a long-duration asset, Bitcoin is highly sensitive to interest rate paths. When expectations for rate cuts are withdrawn, its valuation faces pressure. Unlike equities, which can benefit from increased nominal revenues and reduced real debt burdens during inflation, Bitcoin possesses neither debt that inflates away nor cash flows that expand with inflation, offering no direct structural benefit from rising prices. Looking ahead, the critical question is whether high inflation will force the Fed to maintain elevated rates for longer. The BIT model anticipates US CPI could potentially rise further to 6.0%. Additionally, factors like AI infrastructure expansion—driving data center construction and power demand—may sustain energy price pressures and extend the period of above-target inflation. In such an environment, tech stocks gain from order growth and improved earnings expectations, while Bitcoin remains susceptible to high-rate pressure. In summary, the current shift does not invalidate Bitcoin's long-term thesis but reflects a market re-evaluation of interest rate and liquidity paths amid resurgent inflation. In the short term, a high-inflation environment may continue to suppress Bitcoin's performance relative to Nasdaq. This represents a slowdown in its upward momentum rather than a bearish turn. Bitcoin could regain support once markets begin to reprice expectations for future liquidity easing.

marsbit05/15 10:07

BIT Research: If It Followed Nasdaq, Bitcoin Should Be Close to $140,000

marsbit05/15 10:07

活动图片