Solana volume is fragile, but traders haven’t given up – Here’s why!

ambcrypto2026-04-11 tarihinde yayınlandı2026-04-11 tarihinde güncellendi

Özet

Solana (SOL) is experiencing a prolonged cooling phase with significantly weakened trading volumes in both spot and futures markets since November 2025. Despite a notable price decline from around $160 to the $80-$90 range, and a sharp drop to below $80 in late January, trading activity has not recovered. However, derivatives data reveals some underlying optimism: aggregated open interest has remained stable around $2.0B-$2.1B, indicating traders haven't fully exited, and funding rates have turned positive. Currently trading near $85, SOL is range-bound with neutral RSI and weak trend strength. A breakout above the $90-$92 resistance zone requires stronger volume; otherwise, sideways movement is likely to continue.

Solana’s [SOL] markets are in a prolonged “cooling” phase. Even so, traders look like they’re holding onto hope.

Will SOL deliver?

Solana volumes weak across the board

At the time of writing, both Solana’s Spot and Futures volume charts revealed that trading activity has stayed weak for months.

Source: Cryptoquant

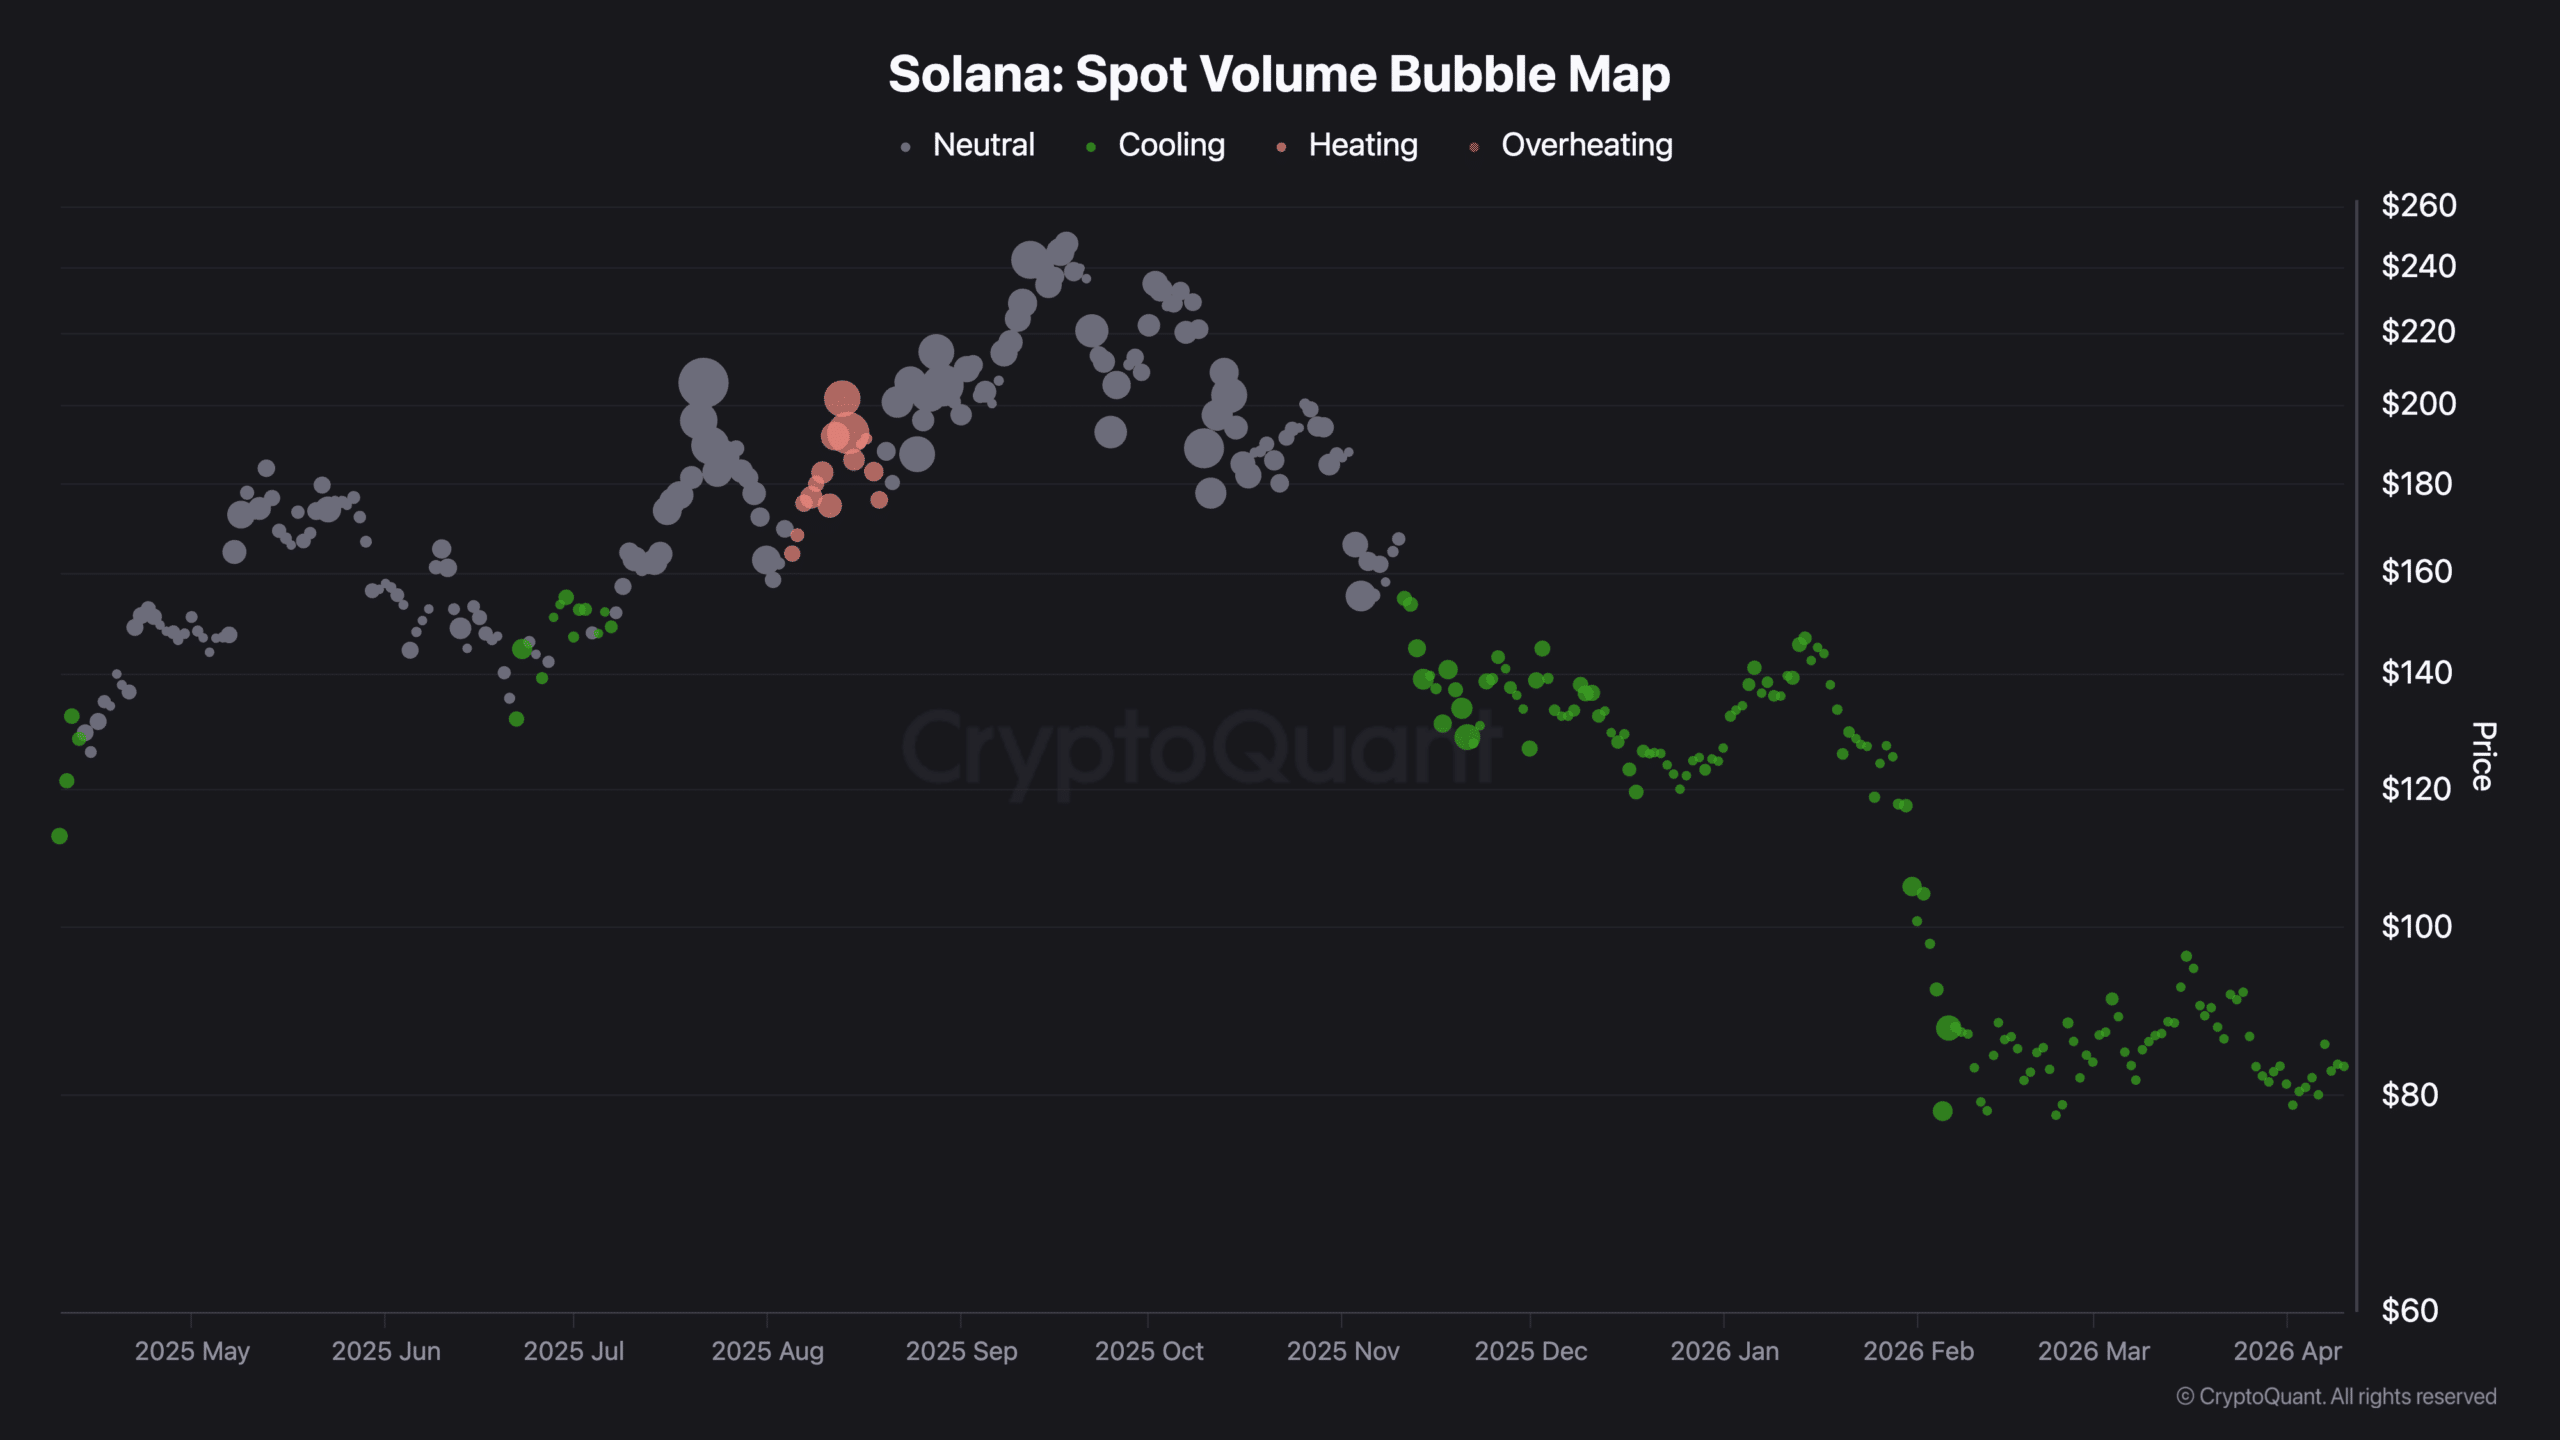
Since November 2025, most of the bubbles have remained in the green “cooling” zone. In fact, there’s been lower participation from both spot buyers and derivatives traders.

Source: Cryptoquant

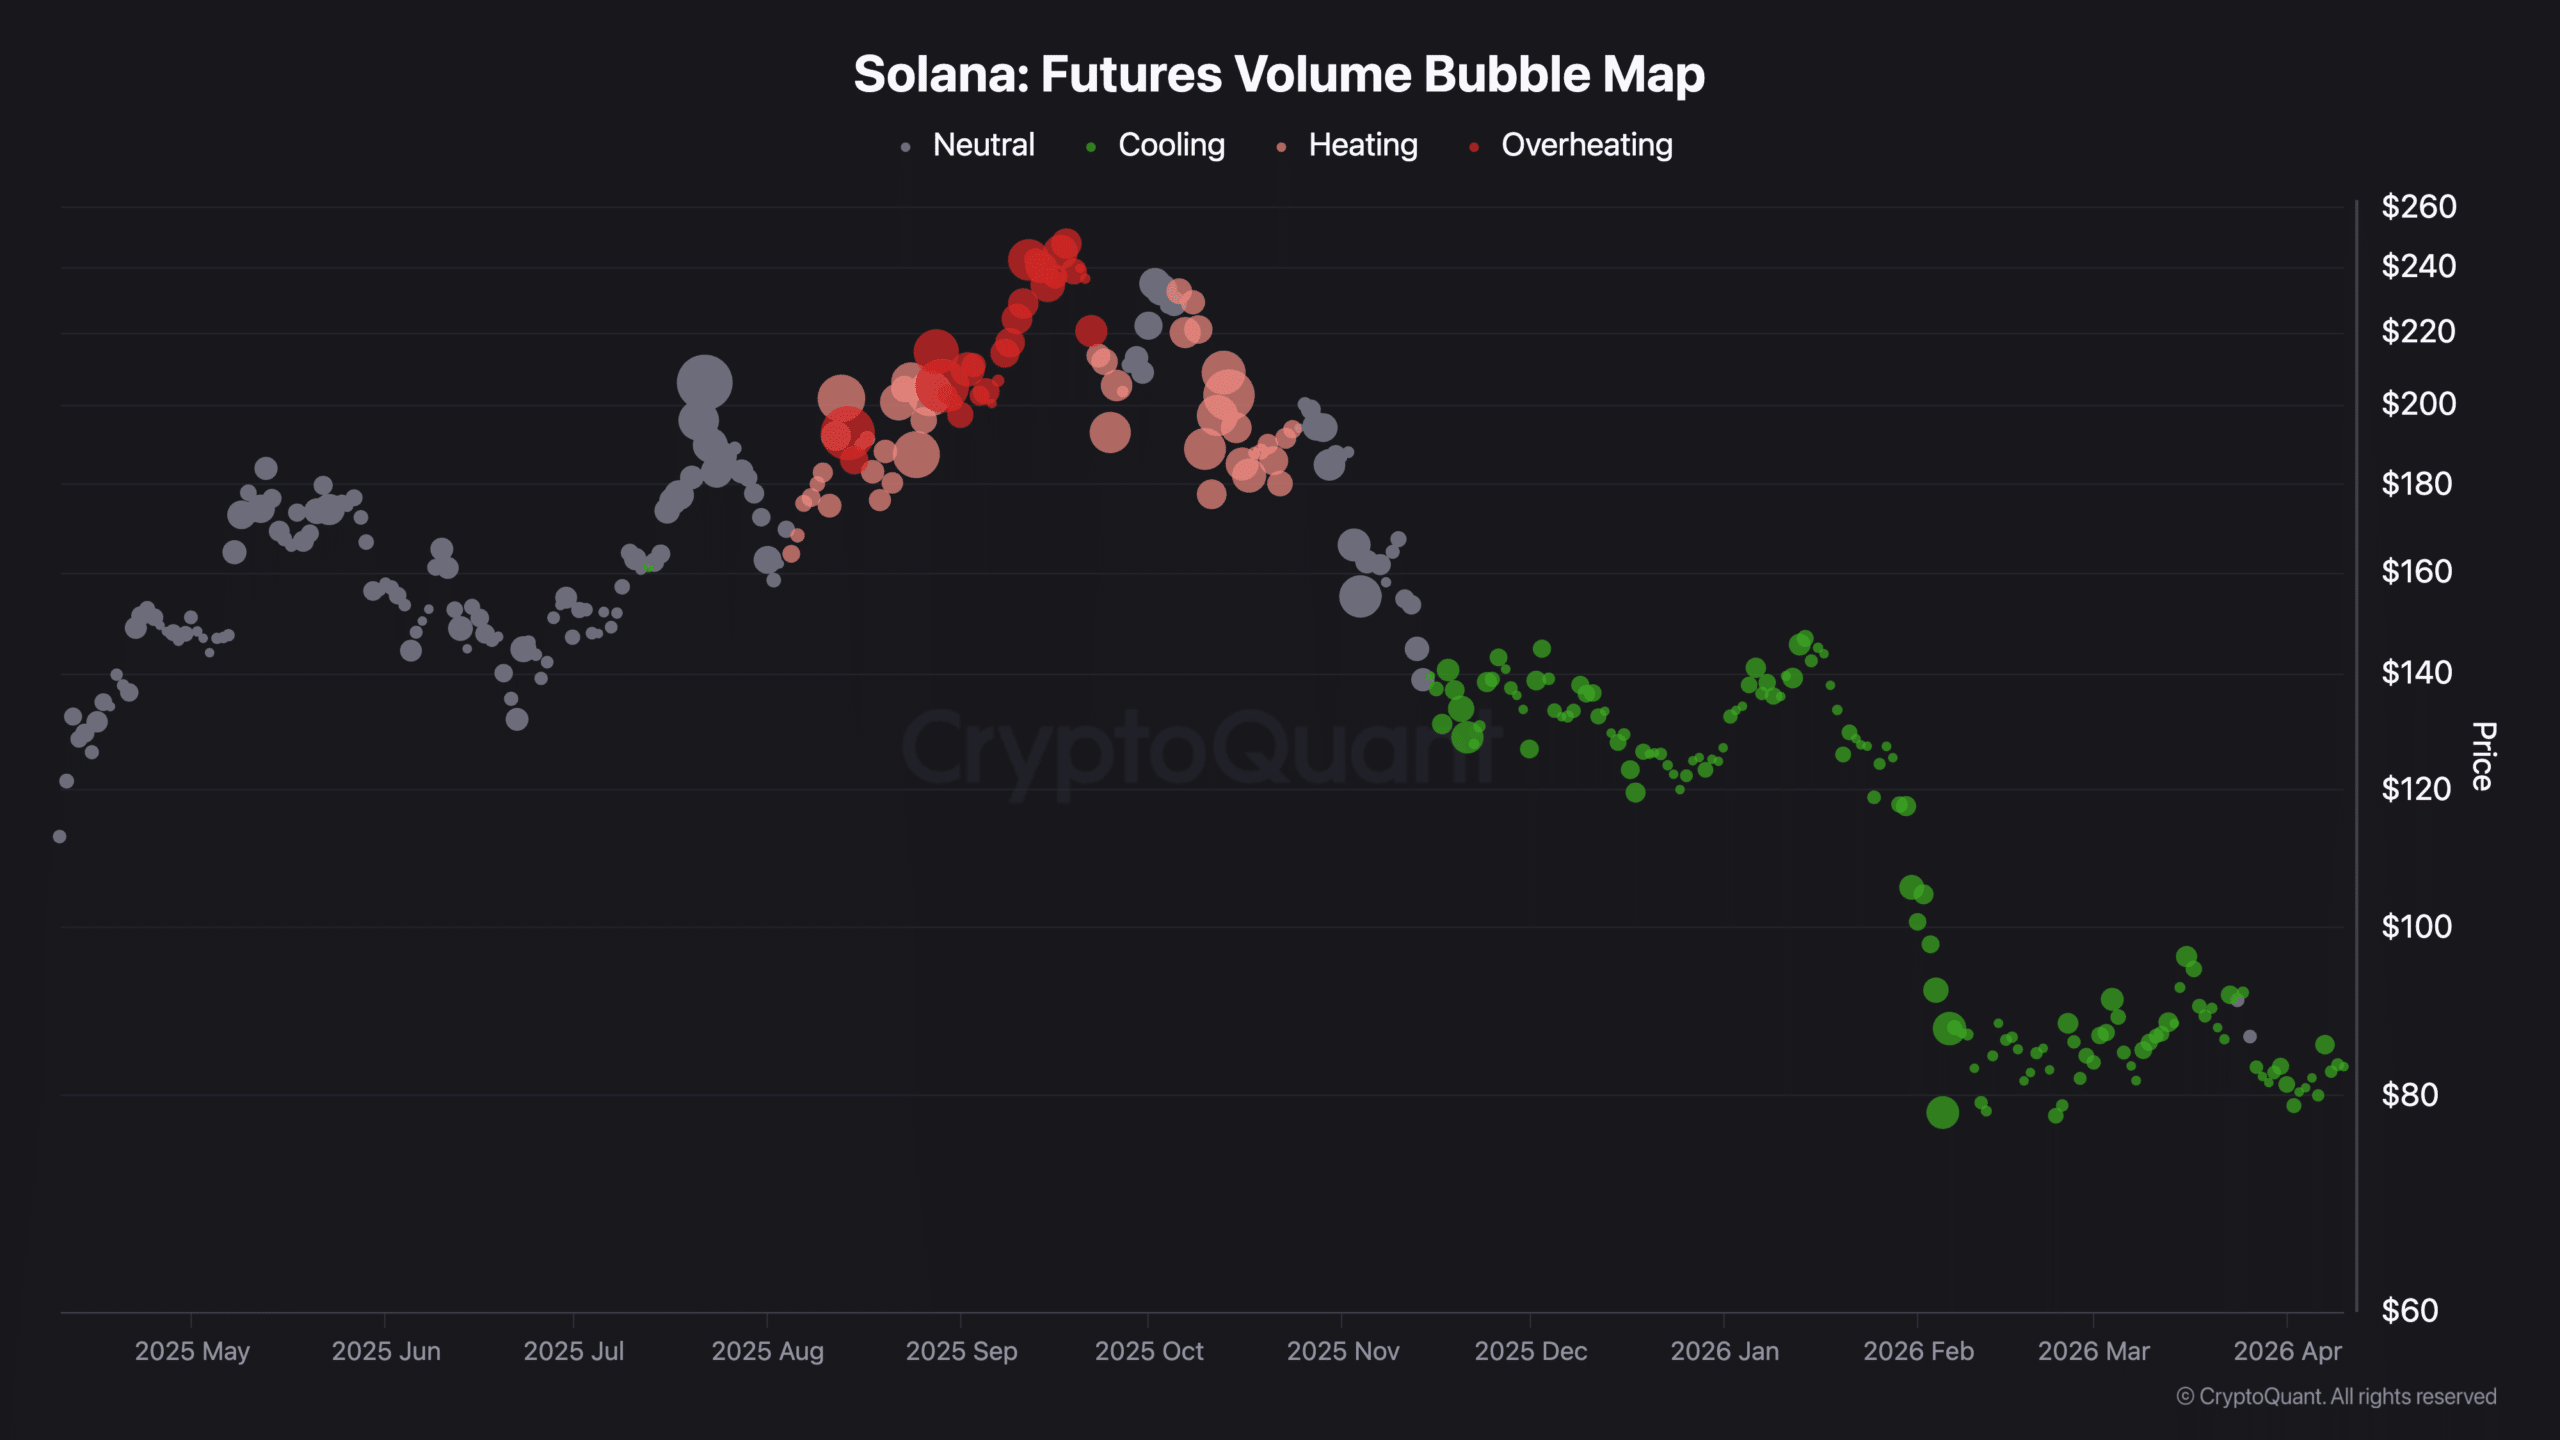
During this period, SOL’s price fell from around $160 to the $80-$90 range. The biggest drop came in late January to early February, when the token fell from about $125 to below $80 on the charts.

There were small recoveries towards $90-$95 in March, but volumes did not pick up.

Derivatives numbers look positive

Volumes might be weak, but there’s more! Solana’s Aggregated Open Interest has held relatively stable around the $2.0B-$2.1B range. Traders haven’t fully exited the market just yet.

Source: Coinalyze

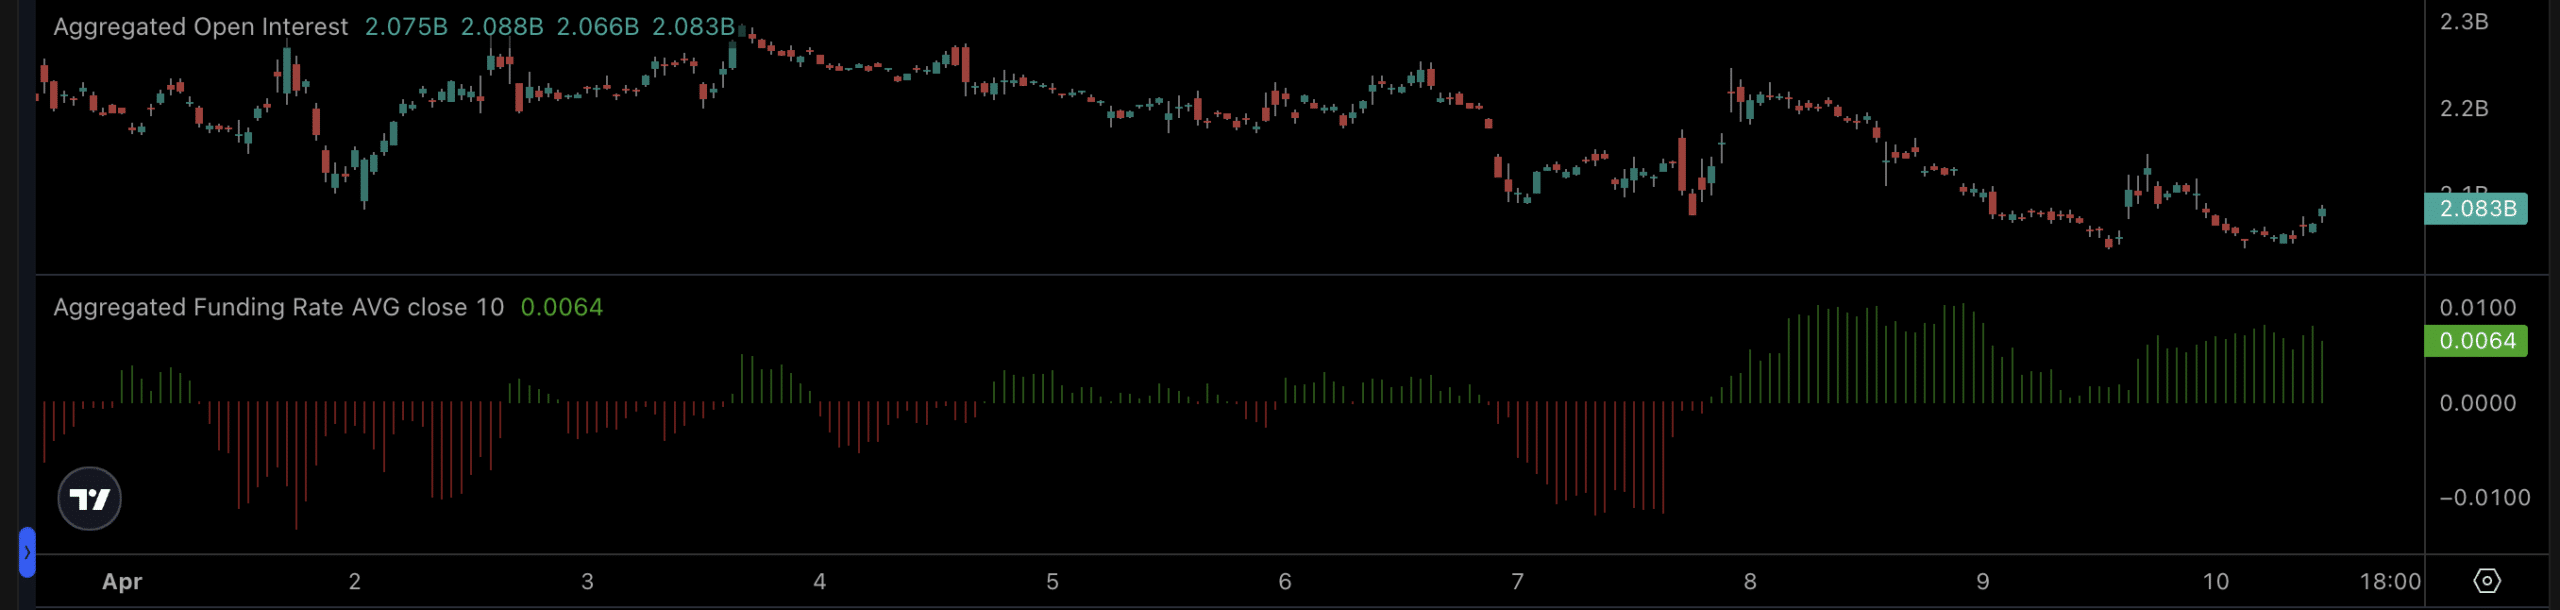
At the same time, funding rates were also back in positive territory, at around 0.006 at press time. Long positions seemed to be regaining strength, even if there wasn’t enough belief.

Earlier this month, there was high short pressure. That phase has eased since, with mild optimism being the mood for now.

SOL holds near $85

On the price charts, SOL was stable, but not quite strong enough. At the time of writing, the altcoin was trading at around $85, being range-bound after weeks of decline.

The RSI was near neutral; no clear bias from buyers or sellers. The DMI indicator also highlighted weak trend strength. So, it confirmed that neither bulls nor bears were in firm control.

Source: TradingView

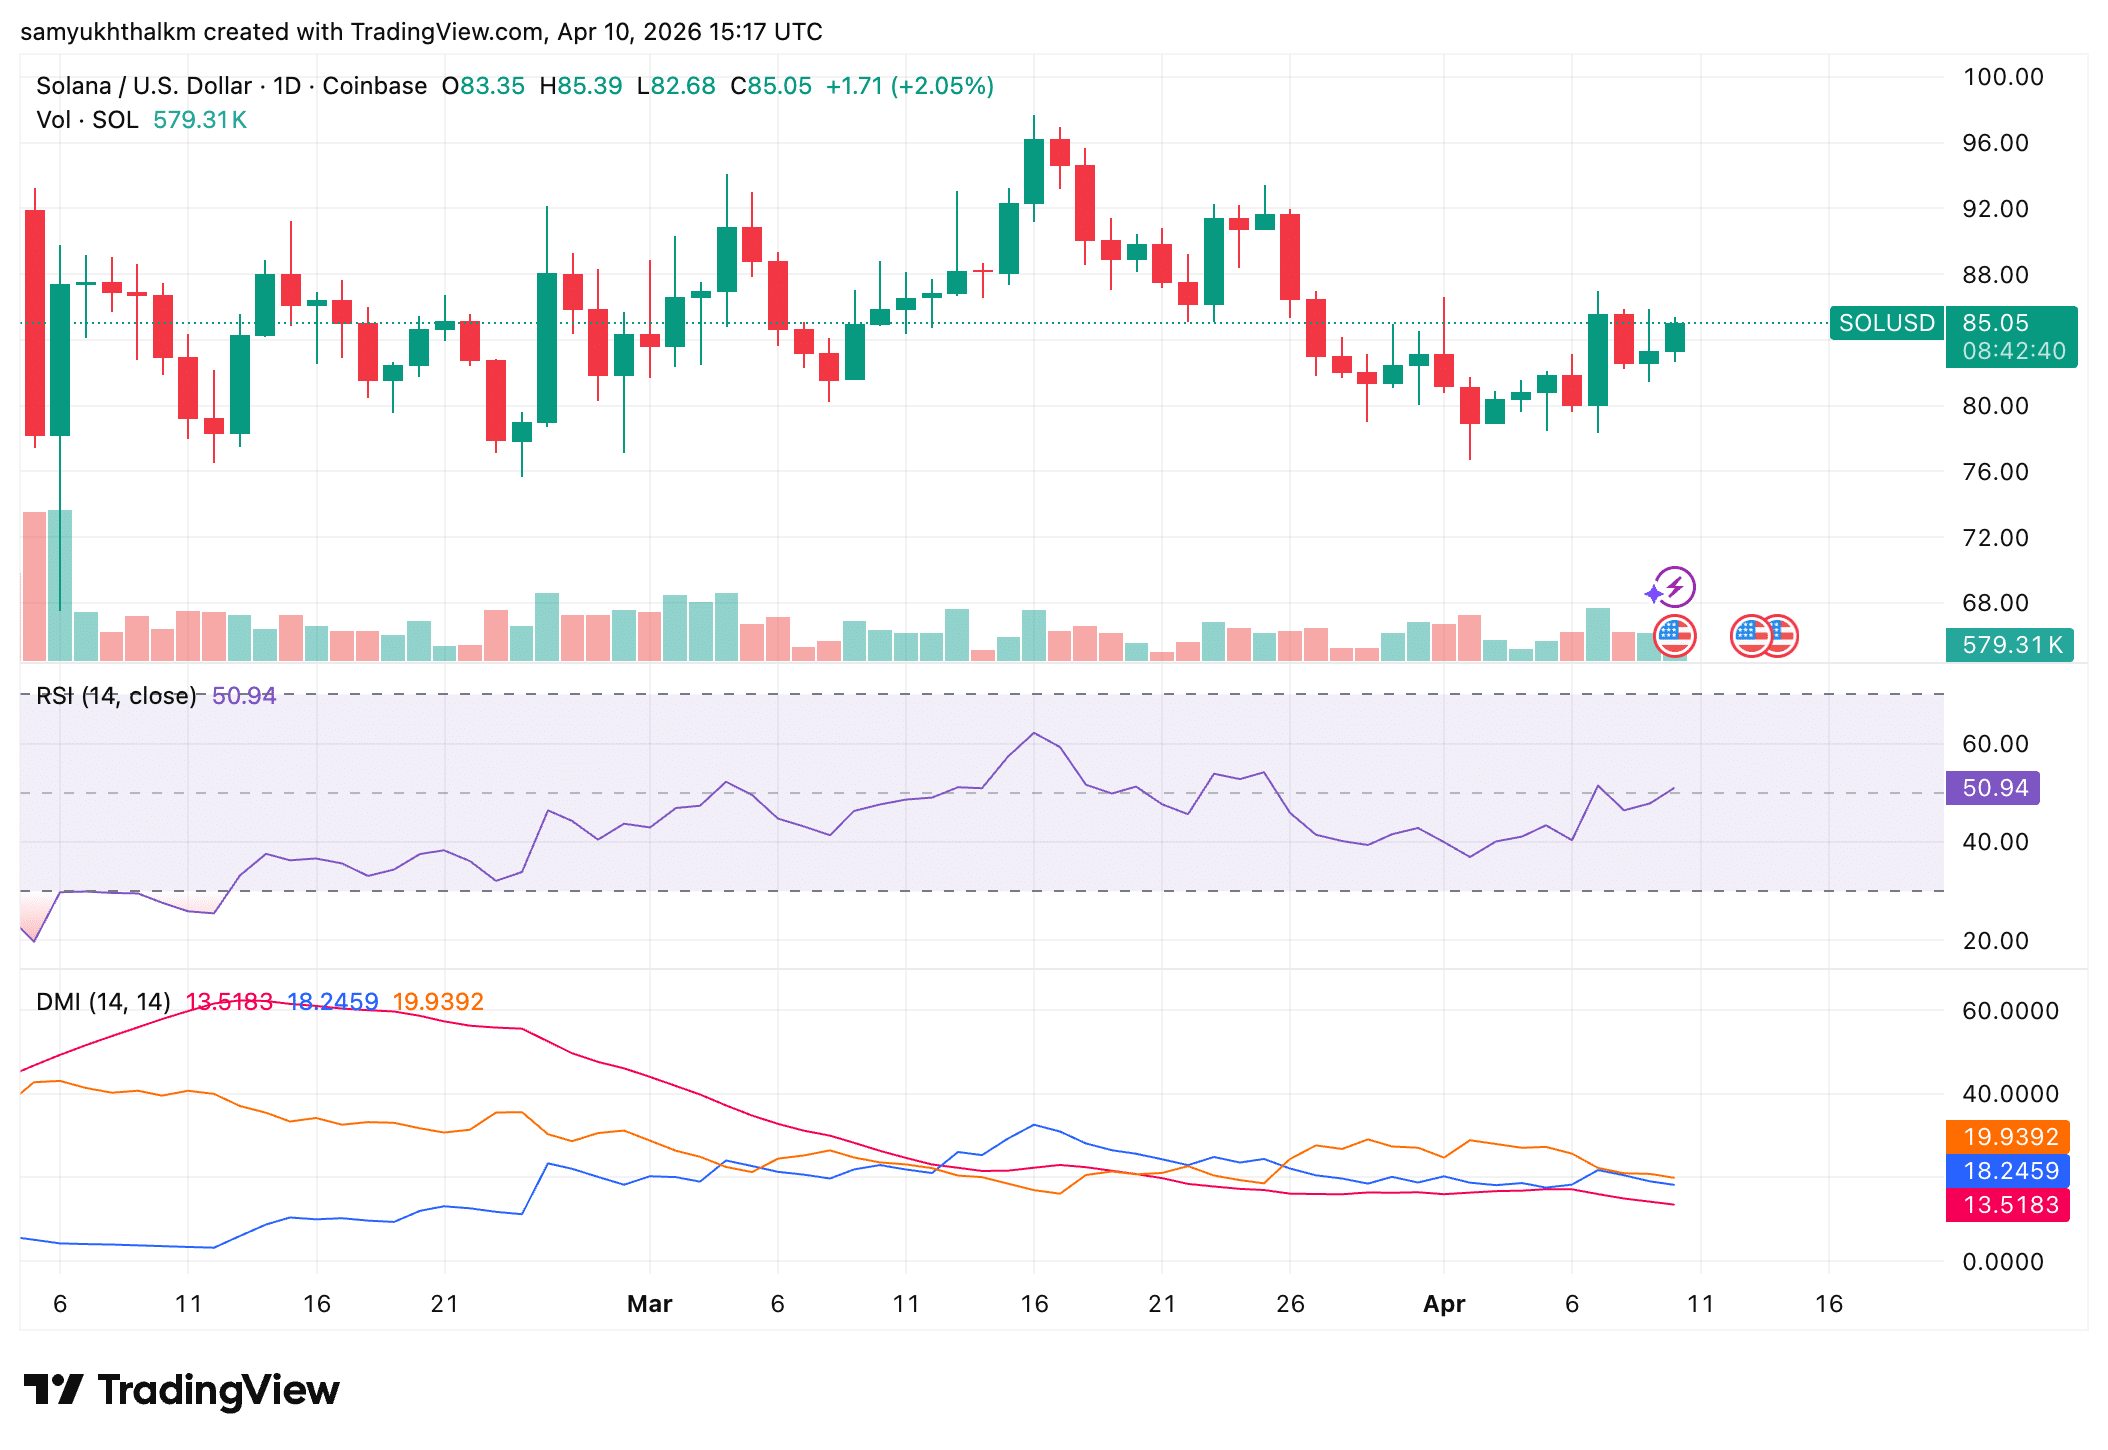
The price structure was capped below the $90-$92 resistance zone – A level that has rejected recent upside attempts.

Unless SOL breaks above this range with greater volume activity, it will continue to move sideways rather than break out on the charts.


Final Summary

  • Solana might be stuck thanks to Spot and Futures volumes staying weak.
  • Derivatives numbers suggested traders might still be expecting a rebound.

İlgili Sorular

QWhat has been the trend in Solana's trading volumes according to the article?

ASolana's trading volumes have been weak for months, with both spot and futures activity staying low since November 2025, indicating a prolonged cooling phase.

QHow has SOL's price changed during the period of weak volumes mentioned?

ASOL's price fell from around $160 to the $80-$90 range, with the most significant drop occurring from about $125 to below $80 in late January to early February.

QWhat does the stability in Solana's Aggregated Open Interest around $2.0B-$2.1B suggest?

AIt suggests that traders haven't fully exited the market yet, indicating that some are still holding positions and possibly expecting a rebound.

QWhat is the current market sentiment based on funding rates and recent pressure?

AFunding rates are positive at around 0.006, showing mild optimism with long positions regaining strength, and the earlier high short pressure has eased.

QWhat key resistance level must SOL break for a potential breakout, according to the article?

ASOL needs to break above the $90-$92 resistance zone with greater volume activity to avoid continuing sideways movement and potentially initiate a breakout.

İlgili Okumalar

You Bet on the News, the Pros Read the Rules: The True Cognitive Gap in Losing Money on Polymarket

The article explains that the key to profiting on Polymarket, a prediction market platform, lies not just predicting real-world events correctly, but in meticulously understanding the specific rules that govern how each market will be resolved. It illustrates this with examples, such as a market on Venezuela's 2026 leader, where the official rules defining "officially holds" the office overruled the intuitive answer of who was in practical control. Other examples include debates over the definition of a "token" or what constitutes an "agreement." The core argument is that a "reality vs. rules" gap creates pricing discrepancies that savvy traders ("车头" or "whales") exploit. The platform has a formal dispute resolution process managed by UMA token holders to settle ambiguous outcomes. This process involves proposal submission, a challenge window, a discussion period, and a final vote. However, the article highlights a critical flaw in this system compared to a traditional court: the lack of separation between the arbiters (UMA voters) and the interested parties (traders with financial stakes in the outcome). This conflict of interest undermines the discussion phase, leads to herd mentality, and results in opaque final decisions without explanatory rulings. Consequently, the system lacks a body of precedent, making it difficult for users to learn from past disputes. The ultimate takeaway is that success on Polymarket requires a lawyer-like scrutiny of the rules to identify and capitalize on the cognitive gap between how events appear and how they are contractually defined for settlement.

marsbit1 saat önce

You Bet on the News, the Pros Read the Rules: The True Cognitive Gap in Losing Money on Polymarket

marsbit1 saat önce

İşlemler

Spot
Futures

Popüler Makaleler

T Nasıl Satın Alınır

HTX.com’a hoş geldiniz! Threshold Network Token (T) satın alma işlemlerini basit ve kullanışlı bir hâle getirdik. Adım adım açıkladığımız rehberimizi takip ederek kripto yolculuğunuza başlayın. 1. Adım: HTX Hesabınızı OluşturunHTX'te ücretsiz bir hesap açmak için e-posta adresinizi veya telefon numaranızı kullanın. Sorunsuzca kaydolun ve tüm özelliklerin kilidini açın. Hesabımı Aç2. Adım: Kripto Satın Al Bölümüne Gidin ve Ödeme Yönteminizi SeçinKredi/Banka Kartı: Visa veya Mastercard'ınızı kullanarak anında Threshold Network Token (T) satın alın.Bakiye: Sorunsuz bir şekilde işlem yapmak için HTX hesap bakiyenizdeki fonları kullanın.Üçüncü Taraflar: Kullanımı kolaylaştırmak için Google Pay ve Apple Pay gibi popüler ödeme yöntemlerini ekledik.P2P: HTX'teki diğer kullanıcılarla doğrudan işlem yapın.Borsa Dışı (OTC): Yatırımcılar için kişiye özel hizmetler ve rekabetçi döviz kurları sunuyoruz.3. Adım: Threshold Network Token (T) Varlıklarınızı SaklayınThreshold Network Token (T) satın aldıktan sonra HTX hesabınızda saklayın. Alternatif olarak, blok zinciri transferi yoluyla başka bir yere gönderebilir veya diğer kripto para birimlerini takas etmek için kullanabilirsiniz.4. Adım: Threshold Network Token (T) Varlıklarınızla İşlem YapınHTX'in spot piyasasında Threshold Network Token (T) ile kolayca işlemler yapın.Hesabınıza erişin, işlem çiftinizi seçin, işlemlerinizi gerçekleştirin ve gerçek zamanlı olarak izleyin. Hem yeni başlayanlar hem de deneyimli yatırımcılar için kullanıcı dostu bir deneyim sunuyoruz.

358 Toplam GörüntülenmeYayınlanma 2024.12.10Güncellenme 2025.03.21

T Nasıl Satın Alınır

Tartışmalar

HTX Topluluğuna hoş geldiniz. Burada, en son platform gelişmeleri hakkında bilgi sahibi olabilir ve profesyonel piyasa görüşlerine erişebilirsiniz. Kullanıcıların T (T) fiyatı hakkındaki görüşleri aşağıda sunulmaktadır.

活动图片