Reading Trends from Data: The Logic Behind the Crypto Market Rebound and Potential Risks

marsbit2025-12-29 tarihinde yayınlandı2025-12-29 tarihinde güncellendi

Özet

Analysis of the crypto market rebound and underlying risks, based on data for the week of Dec 20-26. Bitcoin found technical support at the $85,000 level, bouncing from a low of $84,500. While a technical rebound is underway, key data suggests the market is not yet on a solid footing for a sustained trend reversal. Key short-term data points show mixed picture: * **Stablecoins:** Net issuance remained negative at -$326M, but the outflow rate slowed by 60% week-over-week. * **BTC ETFs:** Net outflows worsened significantly to -$664.37M, a crucial headwind. A return to net inflows is deemed essential for a true reversal. * **OTC Premiums:** USDT and USDC premiums fell to 97.86% and 98.36% respectively, indicating weak demand and persistent capital outflows. * **ETH ETFs:** Outflows narrowed considerably to -$139.53M from the previous week, providing some relative stability for Ethereum. Mid-term on-chain data revealed minor accumulation by addresses holding 100-1K BTC, while larger wallets (10K-100K BTC) reduced holdings. Strong筹码 accumulation was noted near the $87,100 price point, suggesting it could become a key support level. The altcoin market (TOTAL3) saw a modest 1.95% gain but overall sentiment remained weak. Key observations include: * Low trading activity and a subdued market sentiment index. * BTC dominance held high at 65.76%, indicating altcoins continue to underperform Bitcoin. * Meme coins and high-profile tokens saw sporadic gains, but lacked s...

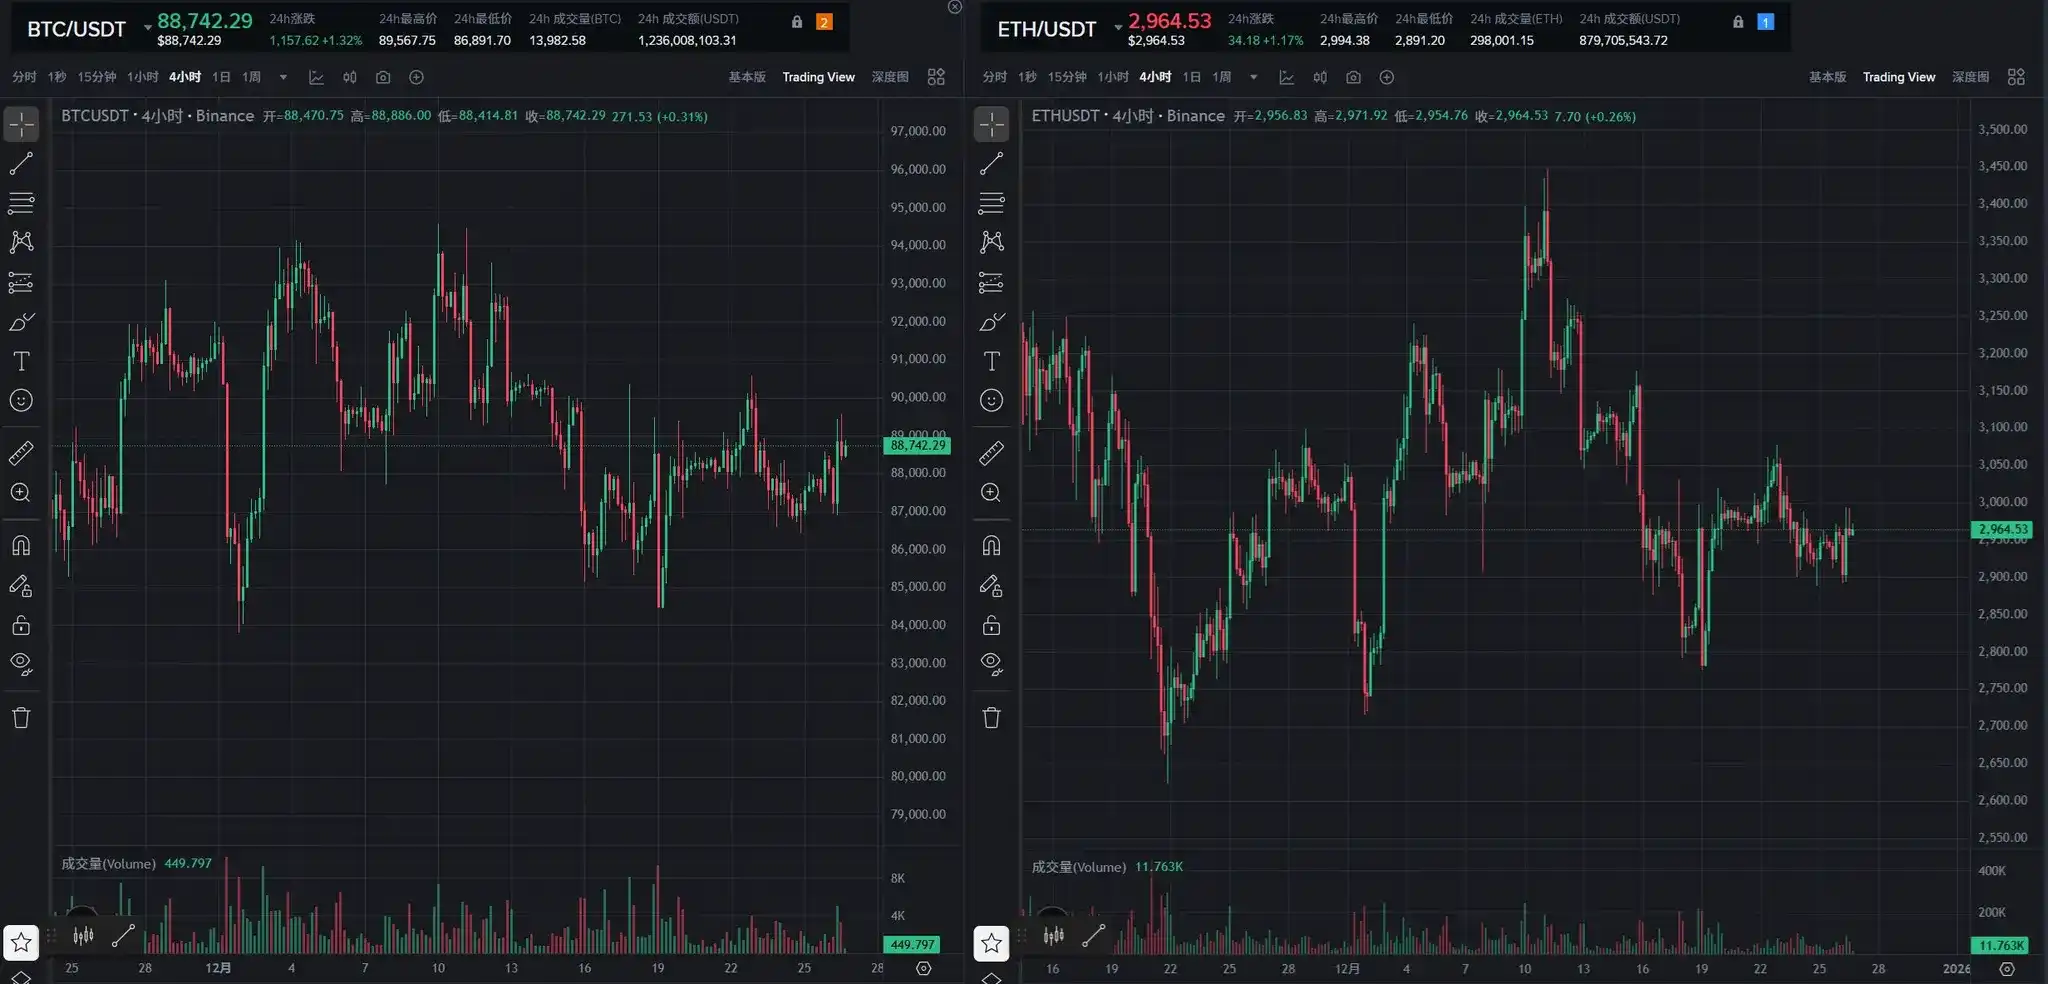
Last week, the market showed a downward trend, and the technical support level of $85,000 we previously emphasized proved effective. After BTC touched a low of $84,500 on Friday, it began a rebound this week. From both daily and weekly perspectives, the support level of $85,000 was validated after the previous continuous decline. Over the weekend, the market maintained its rebound momentum, showing an overall pattern of fluctuating recovery.
2. Mid- to Short-Term Data Changes Affecting the Market This Week

2.1 Stablecoin Fund Flows

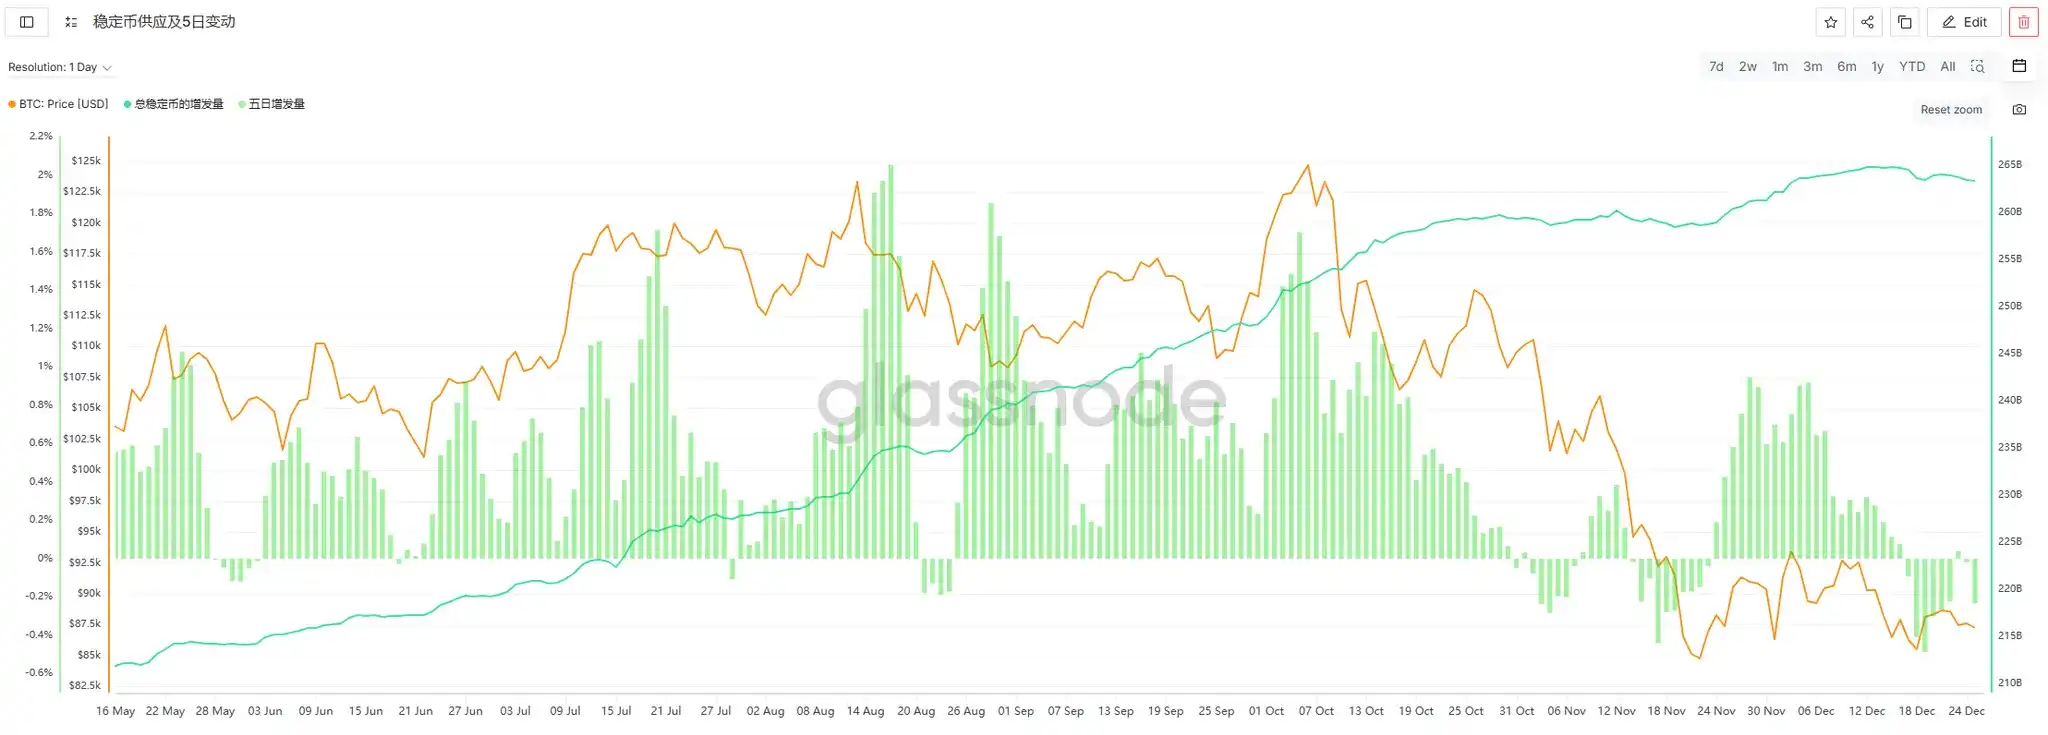
This week (12/20-12/26), the weekly issuance of stablecoins was -$326 million, indicating continued outflow of funds, but the scale of outflow has significantly narrowed. Compared to last week's negative issuance of -$824 million, the average daily negative issuance this week decreased from -$117.7 million to -$46.5 million, representing a 60% increase in overall fund flow. The broader market was mainly volatile this week without sustained declines, which aligns with the trend of reduced stablecoin outflows.
2.2 ETF Fund Flows

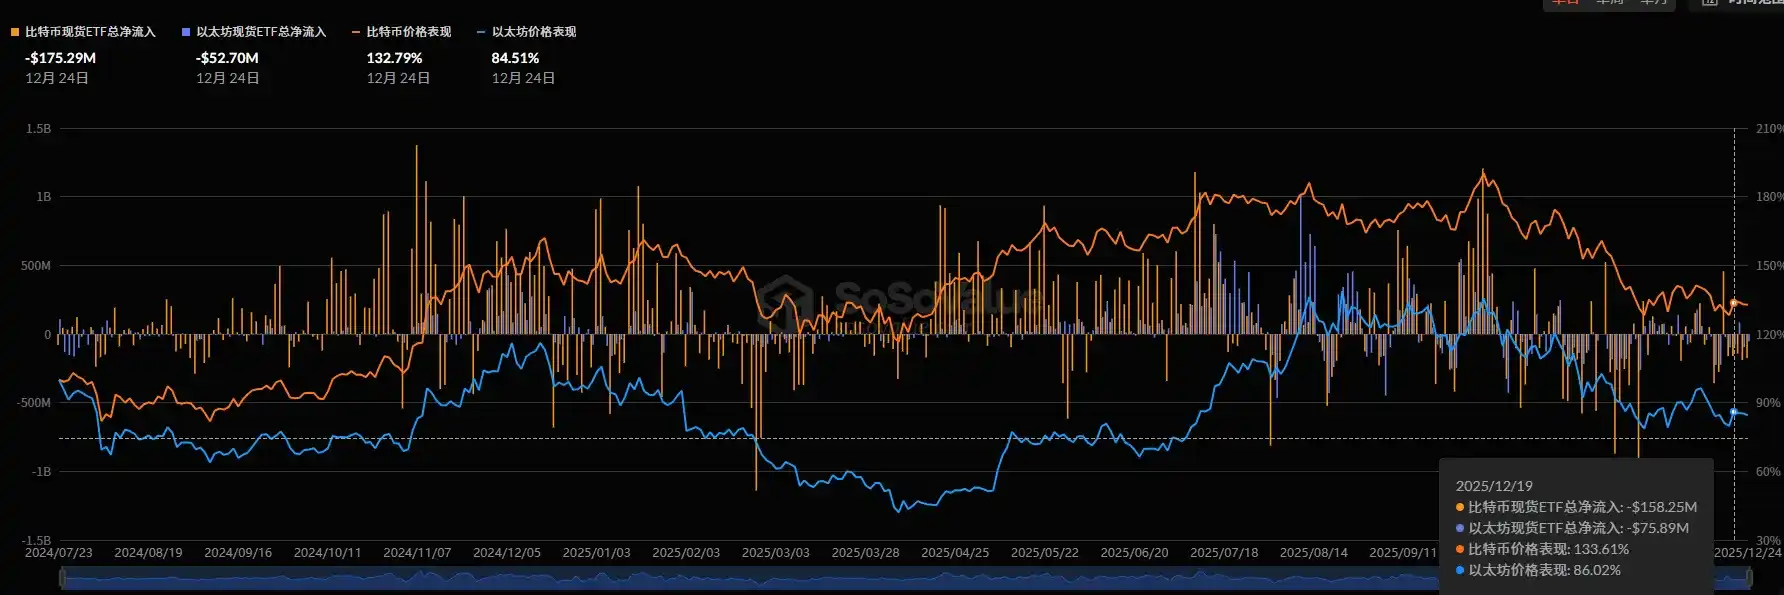
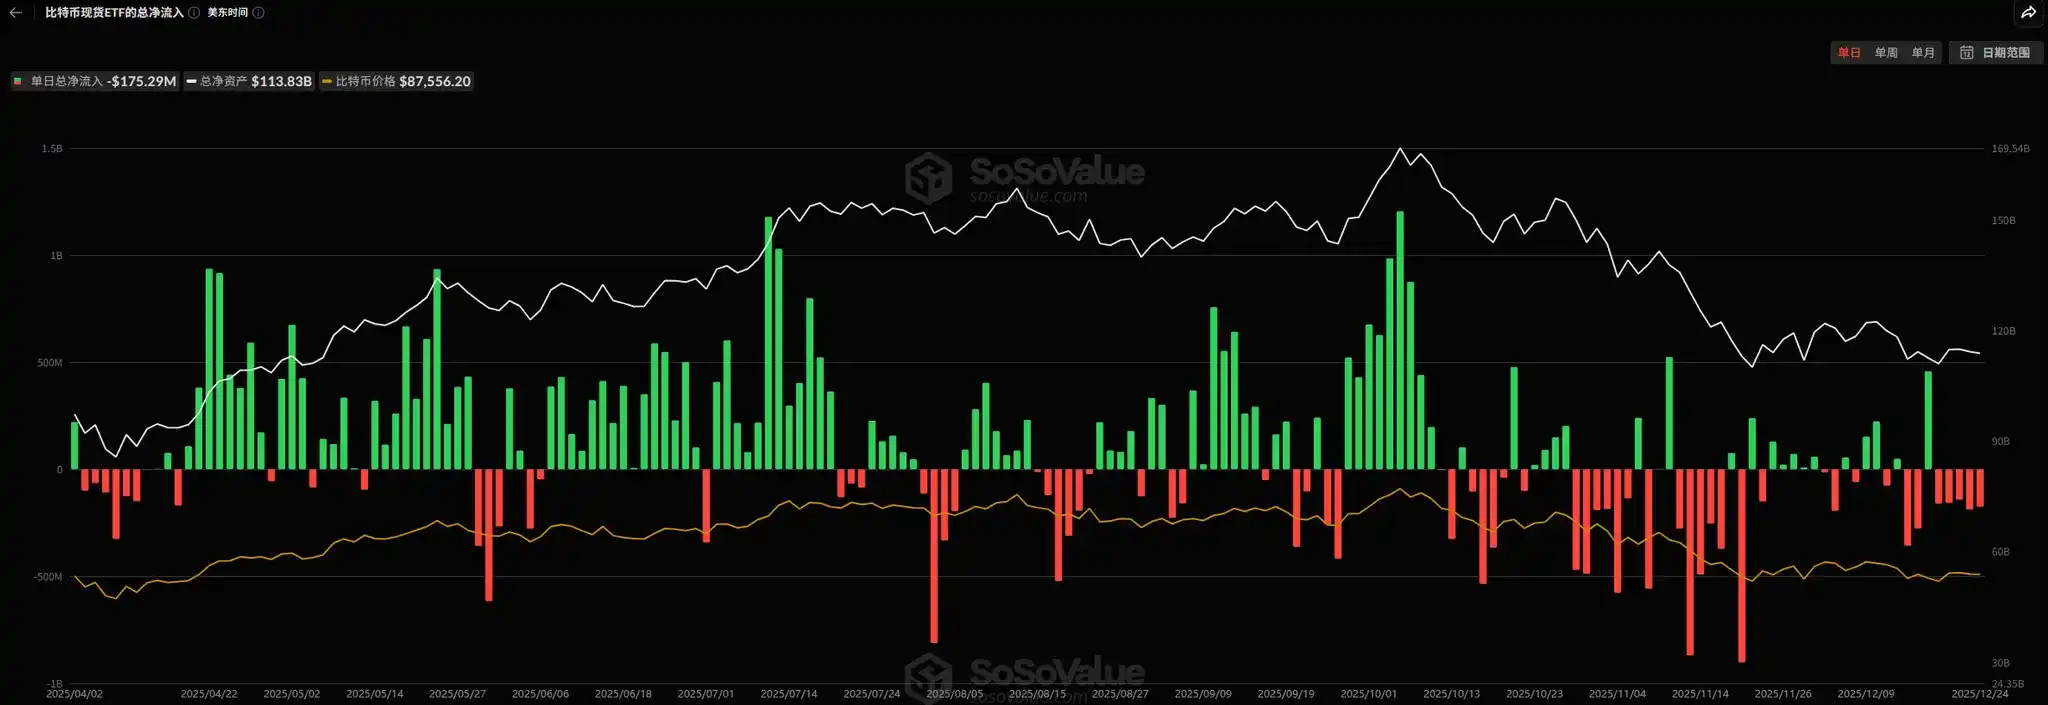
This week, the net outflow of Bitcoin ETFs further expanded, reaching $664.37 million, an increase of $374.72 million compared to last week. Based on daily fund flow data, there is no sign of a regular reduction in ETF net outflows yet. Although BTC prices have rebounded, this can only be characterized as a short-term technical rebound. For the market to achieve a trend reversal, the return of Bitcoin ETFs to net inflows is a core prerequisite.
2.3 Off-Market Discount/Premium

This week, the off-market discount/premium rates for USDT and USDC slightly declined. The current USDT discount/premium is 97.86%, and USDC is 98.36%, both at relatively low levels for the year. This phenomenon reflects continued低迷 market sentiment, insufficient off-market funds for bargain hunting, and some signs of capital outflow.

2.4 Ethereum ETF

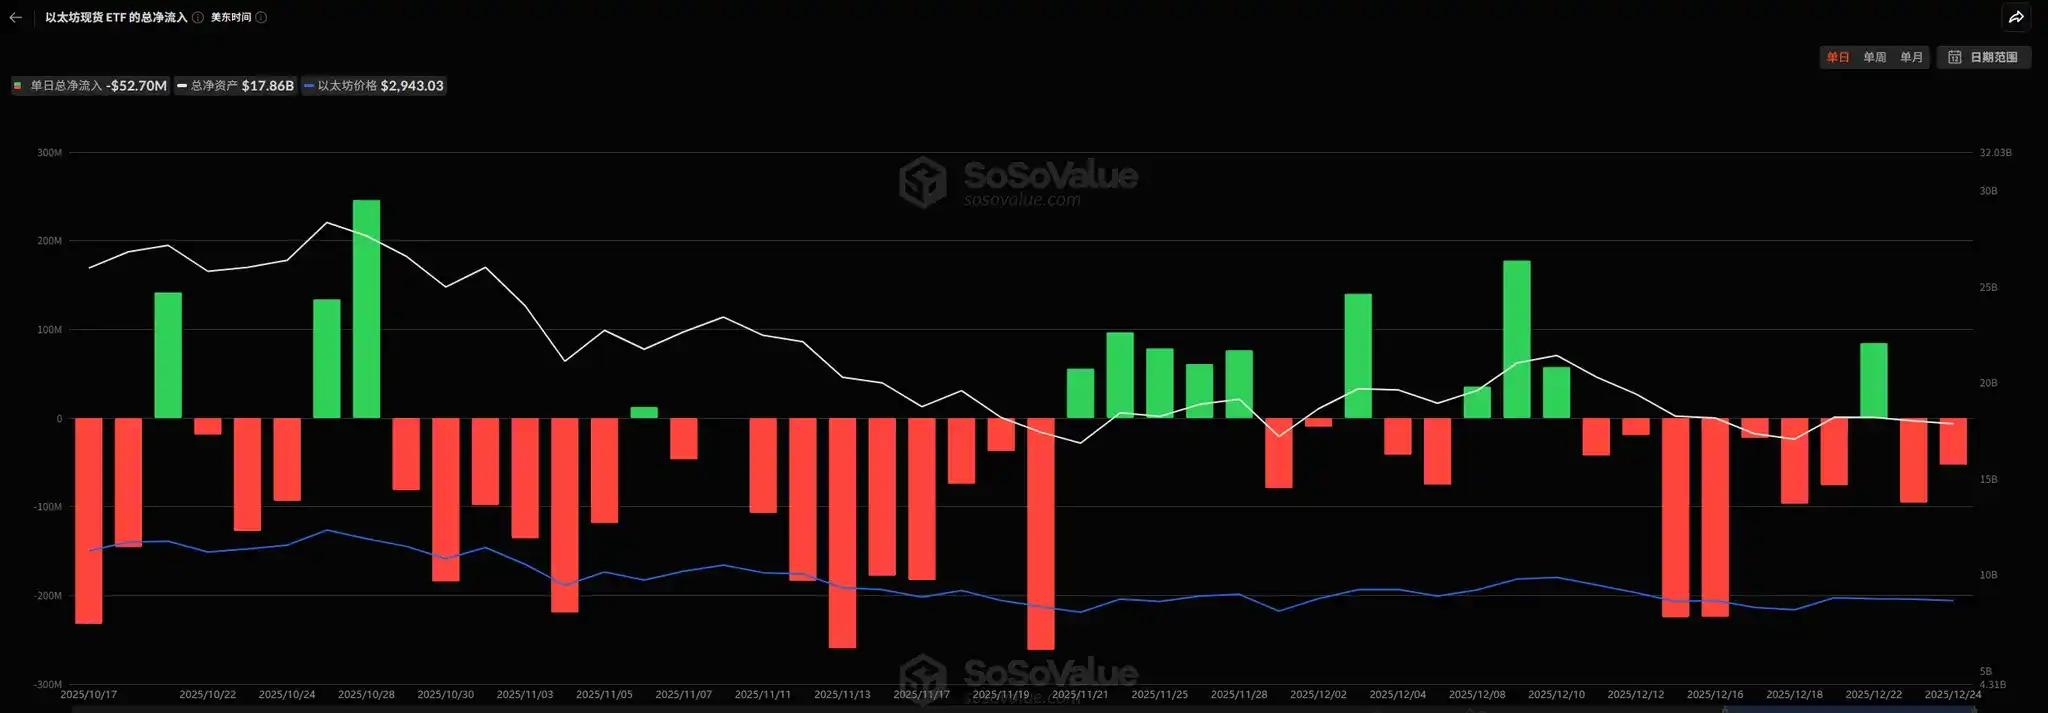
This week, the net outflow of Ethereum ETFs was -$139.53 million, a significant reduction compared to last week's net outflow of $587.5 million. Ethereum prices showed volatile movements this week without sustained declines, echoing the narrowed ETF outflows. If this trend can be maintained, it will provide strong support for Ethereum's rebound.
2.5 Total Crypto Market Capitalization

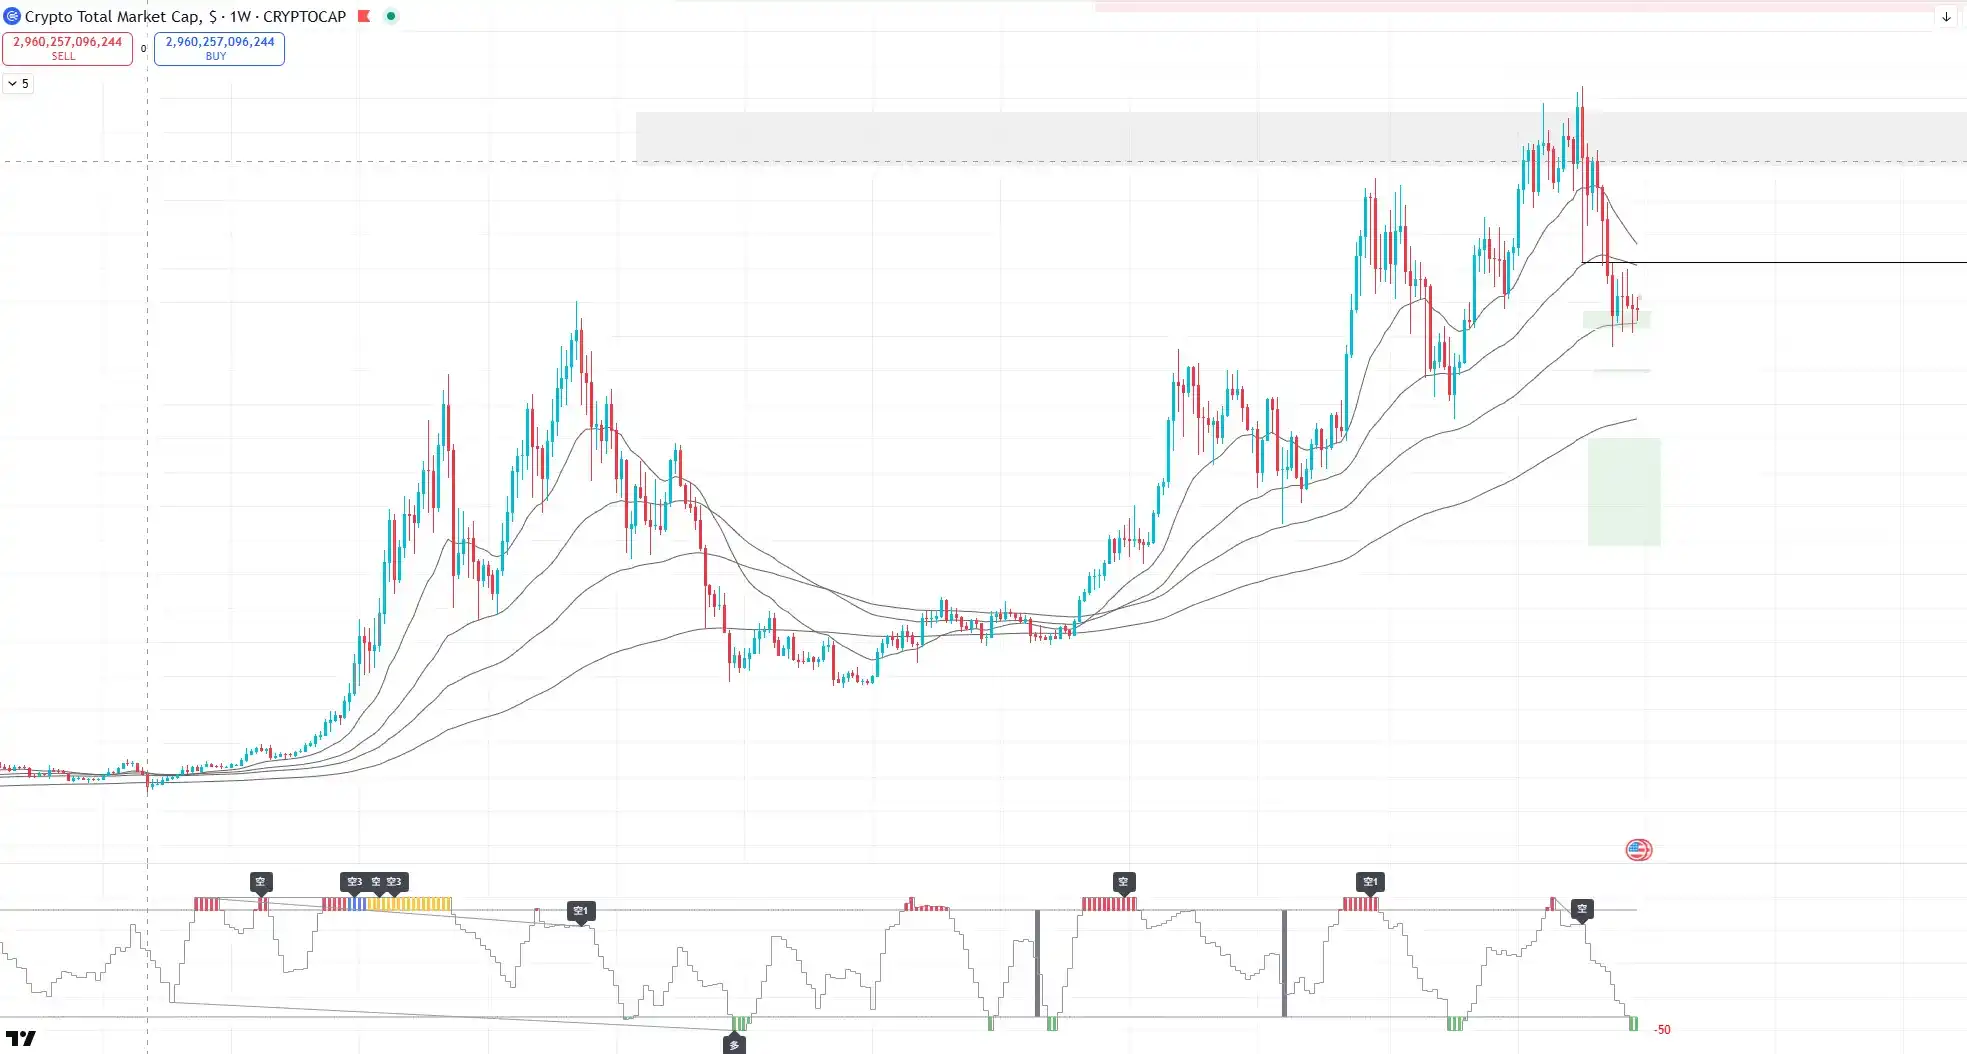
This week, the total crypto market capitalization fell to around $3 trillion, precisely touching the weekly EMA100 moving average. The indicator currently shows a weekly oversold signal. Combined with the historical performance of weekly oversold signals since 2021, the market has the potential for a rebound from a technical perspective.
3. Mid-Term Data Changes Affecting the Market This Week

Holding Address Distribution and URPD

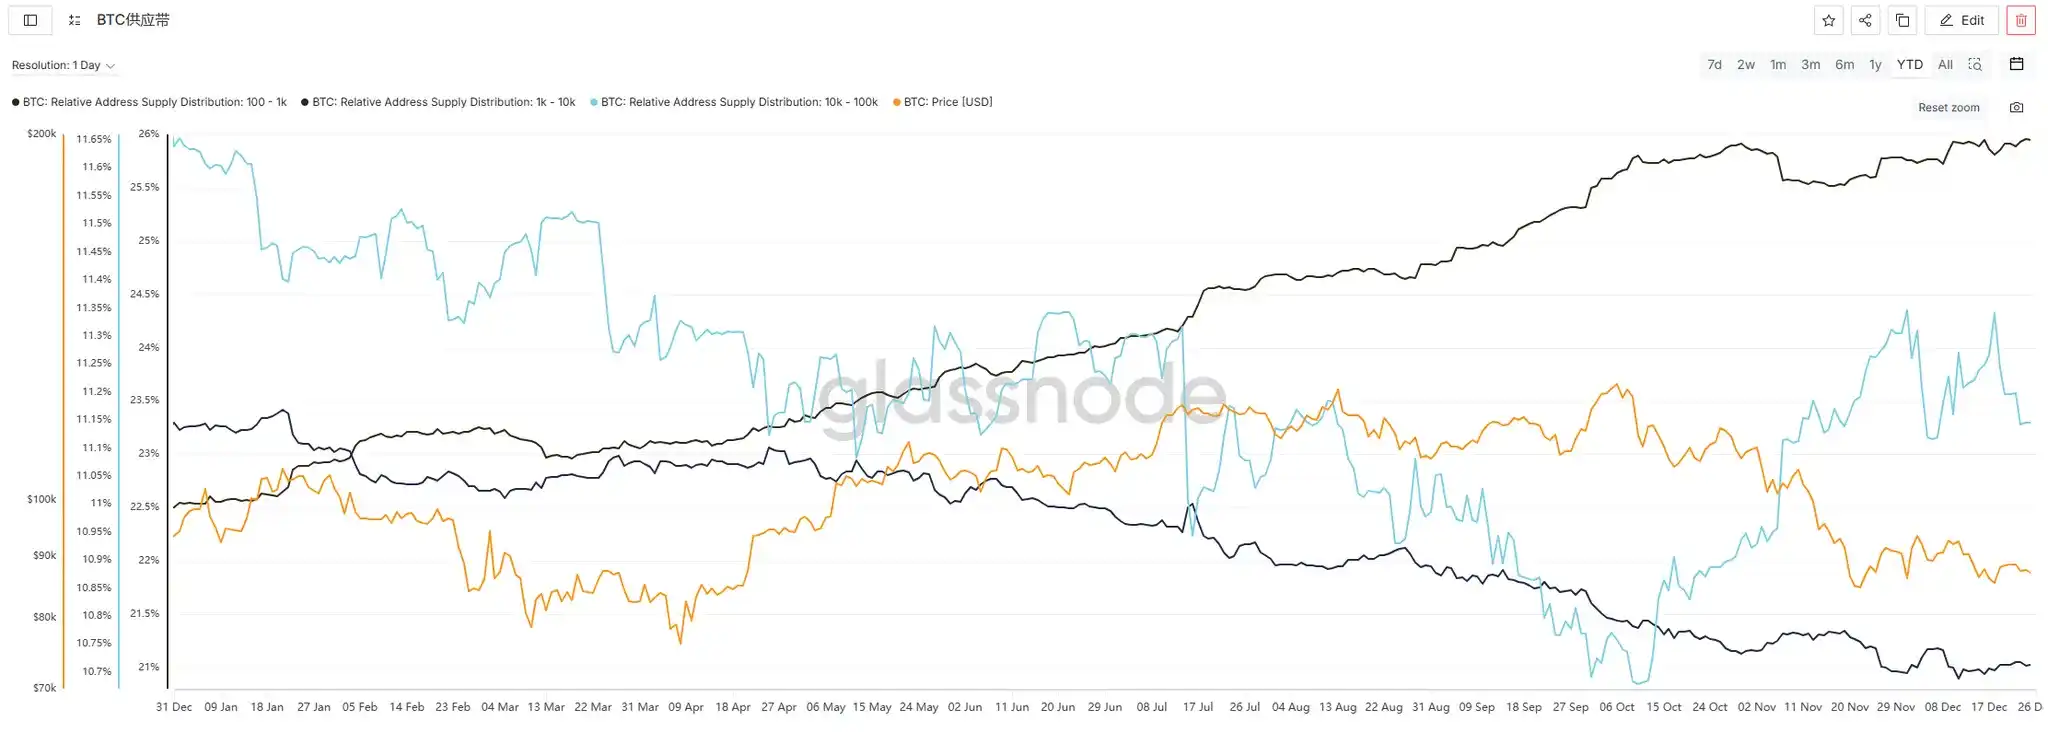
In terms of Bitcoin holding address distribution, the proportion of addresses holding 100-1K BTC increased from 25.813% to 25.951%, showing a slight accumulation trend. The proportion of addresses holding 10K-100K BTC decreased from 11.341% to 11.146%, indicating some reduction. The proportion of addresses holding 1K-10K BTC slightly increased from 20.972% to 21.022%, showing overall minor fluctuations.
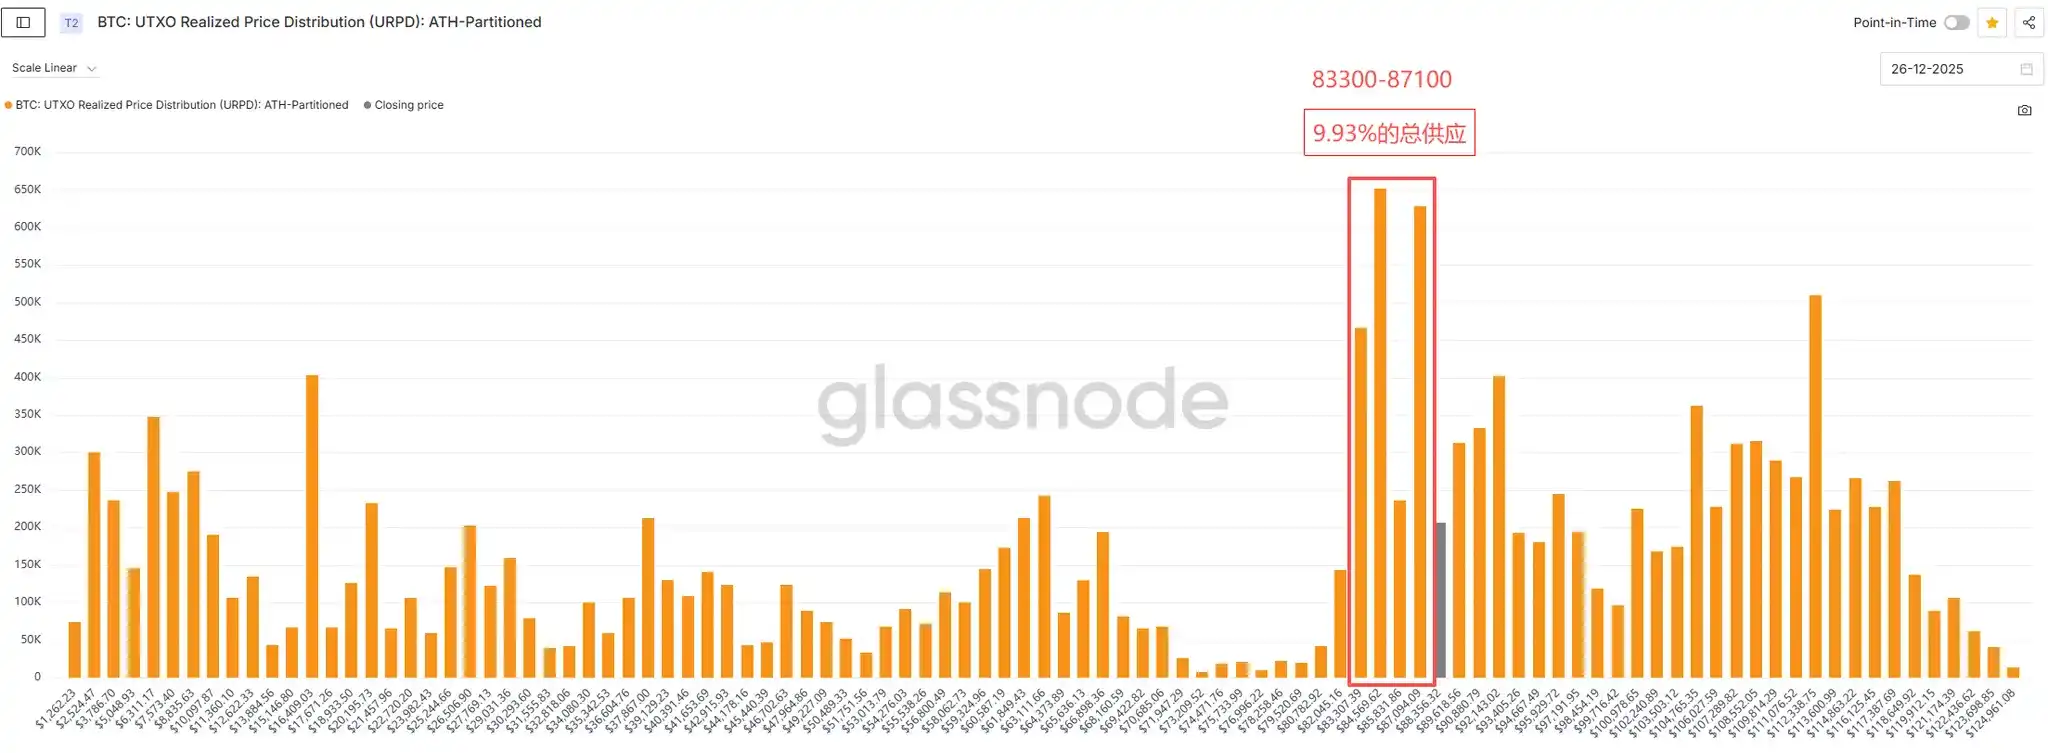
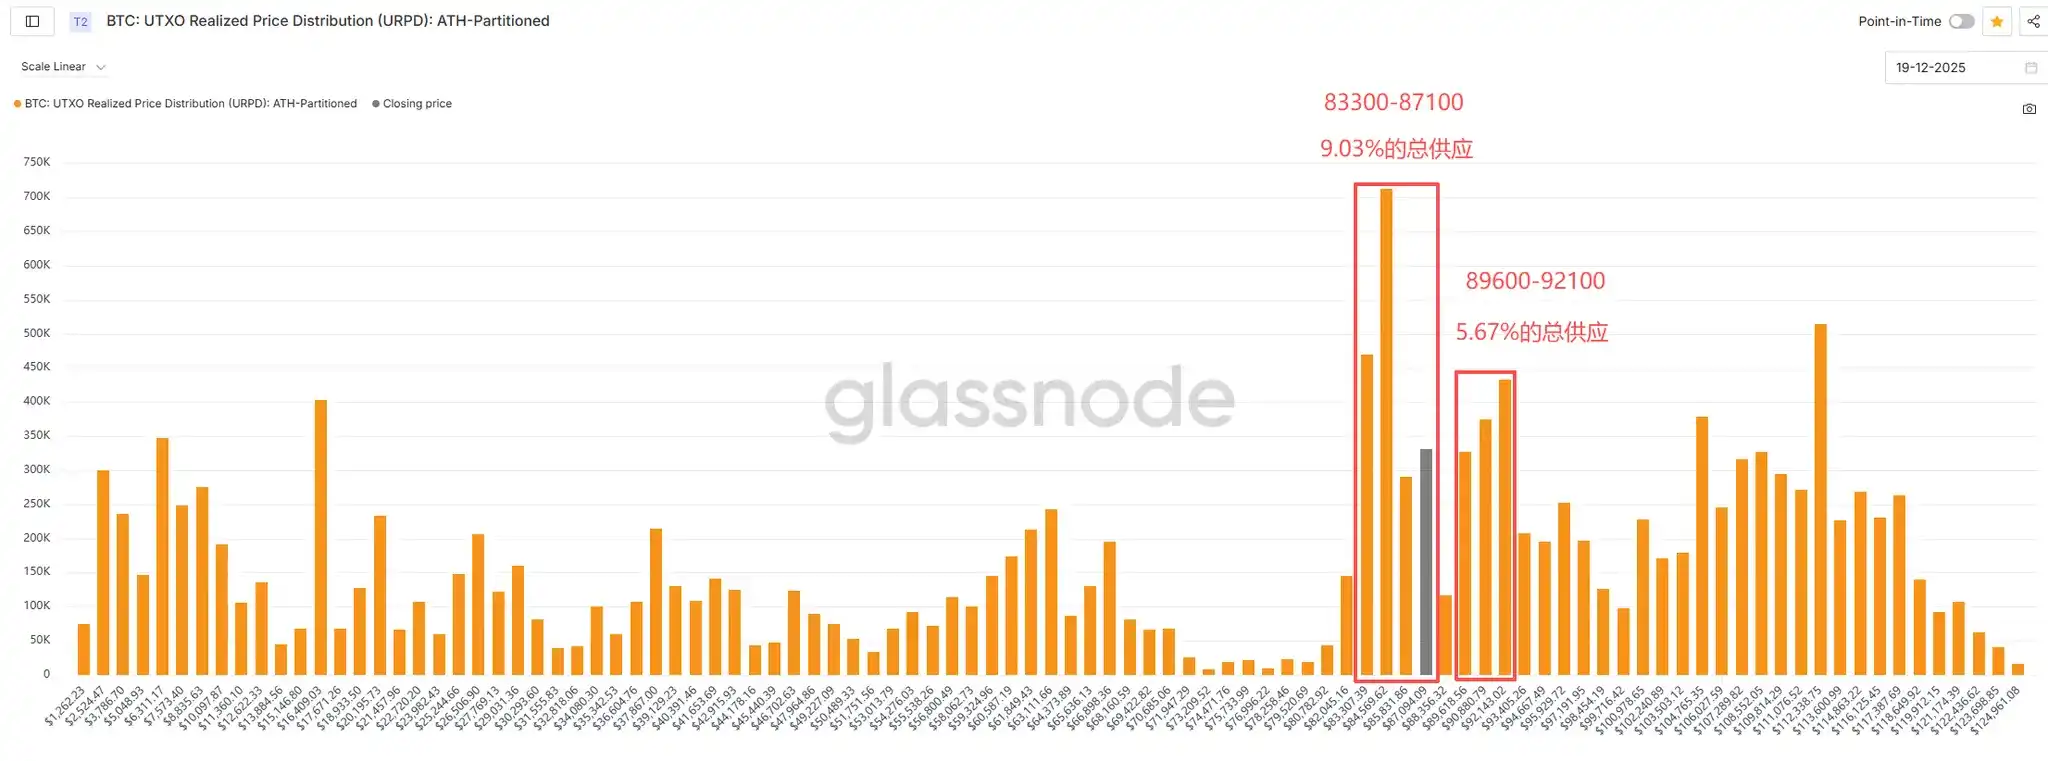
Regarding BTC筹码结构 (chip structure), the accumulation of筹码 in the $83,300-$87,100 price range increased from 9.03% of total supply to 9.93%, a rise of 0.9 percentage points. Specifically, the accumulation near $87,100 reached 3.15% of total supply, showing significant turnover compared to last week and intense battle between bulls and bears. This price level is expected to form strong support going forward.
4. Altcoin Market Analysis

This altcoin market analysis will be conducted from three main sections: Market Overview, Secondary Market Performance, and Primary Market Data, providing a comprehensive view of the current altcoin market dynamics.

4.1 Market Overview

Altcoin Market Capitalization

This Friday, TOTAL3 (total market cap excluding BTC and ETH) reached $822.3 billion, a环比 (week-on-week) increase of 1.95%. BTC traded in a narrow range around $88,000 this week, with low volatility. Despite continued rebounds in US stocks and A-shares, BTC did not follow suit, while commodity markets performed strongly. From a fund flow perspective, BTC still ranks lower in traditional financial allocation systems. In the absence of significant incremental funds, it is likely to maintain range-bound fluctuations.

On-Chain TVL Overview

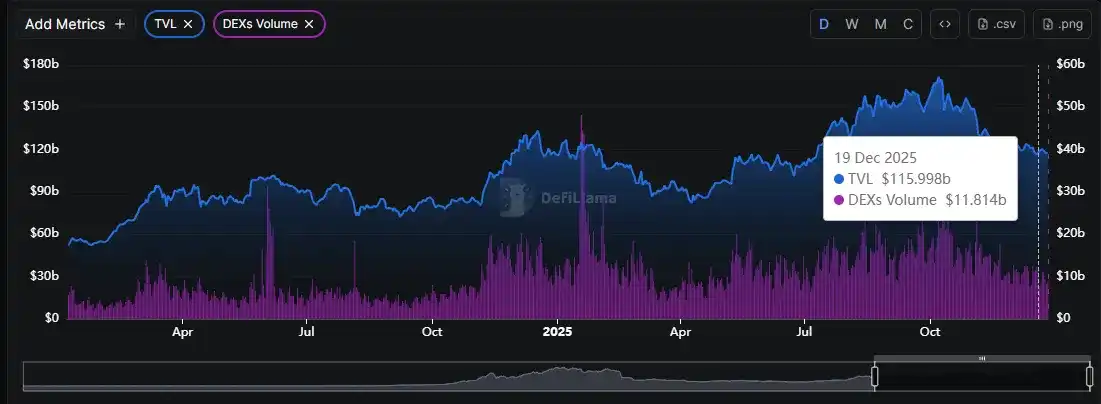
The total on-chain TVL reached $117.5 billion, a环比 increase of 1.29%, showing an overall volatile trend. The amount of ETH staked remained stable, with a trend of fluctuating upward, reflecting relatively solid confidence among long-term holders.
Stablecoin Market Cap and Exchange Reserves

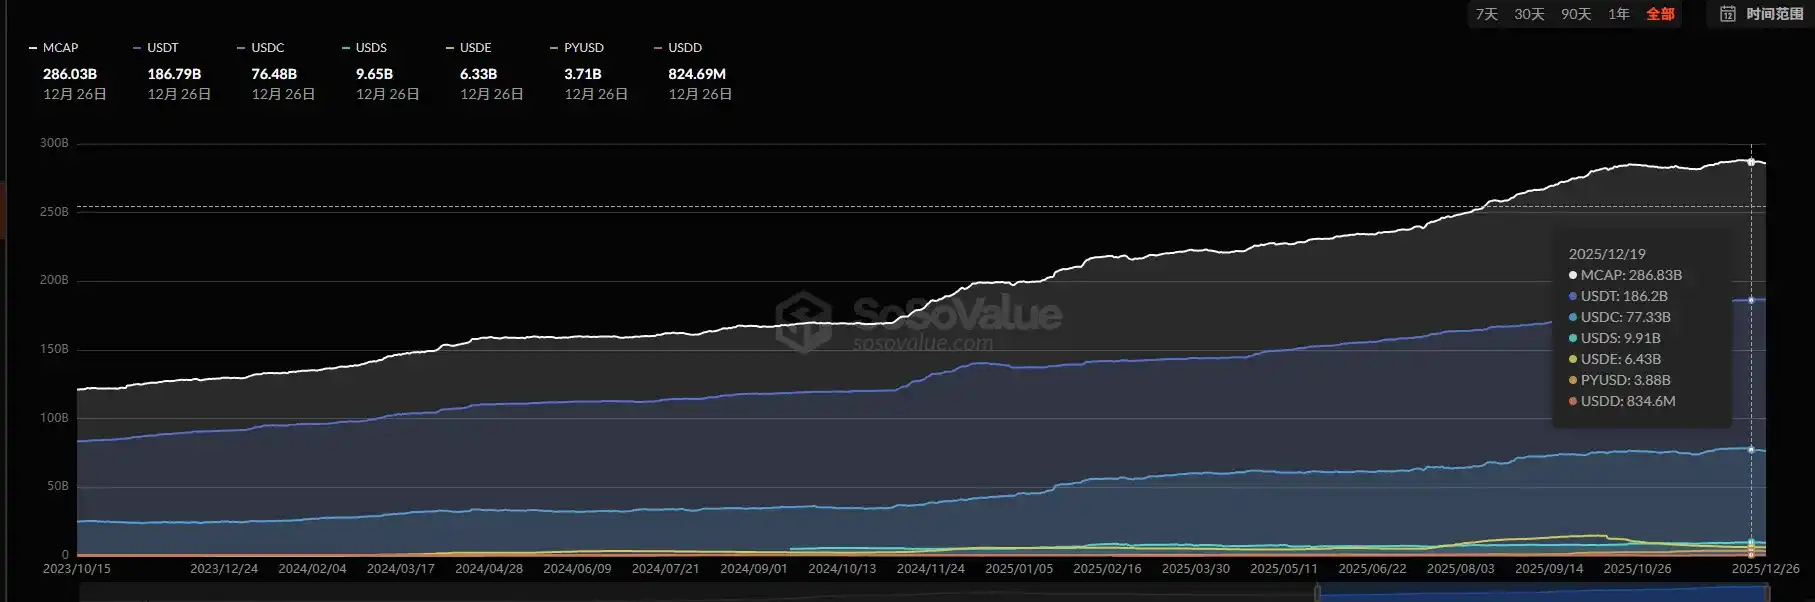
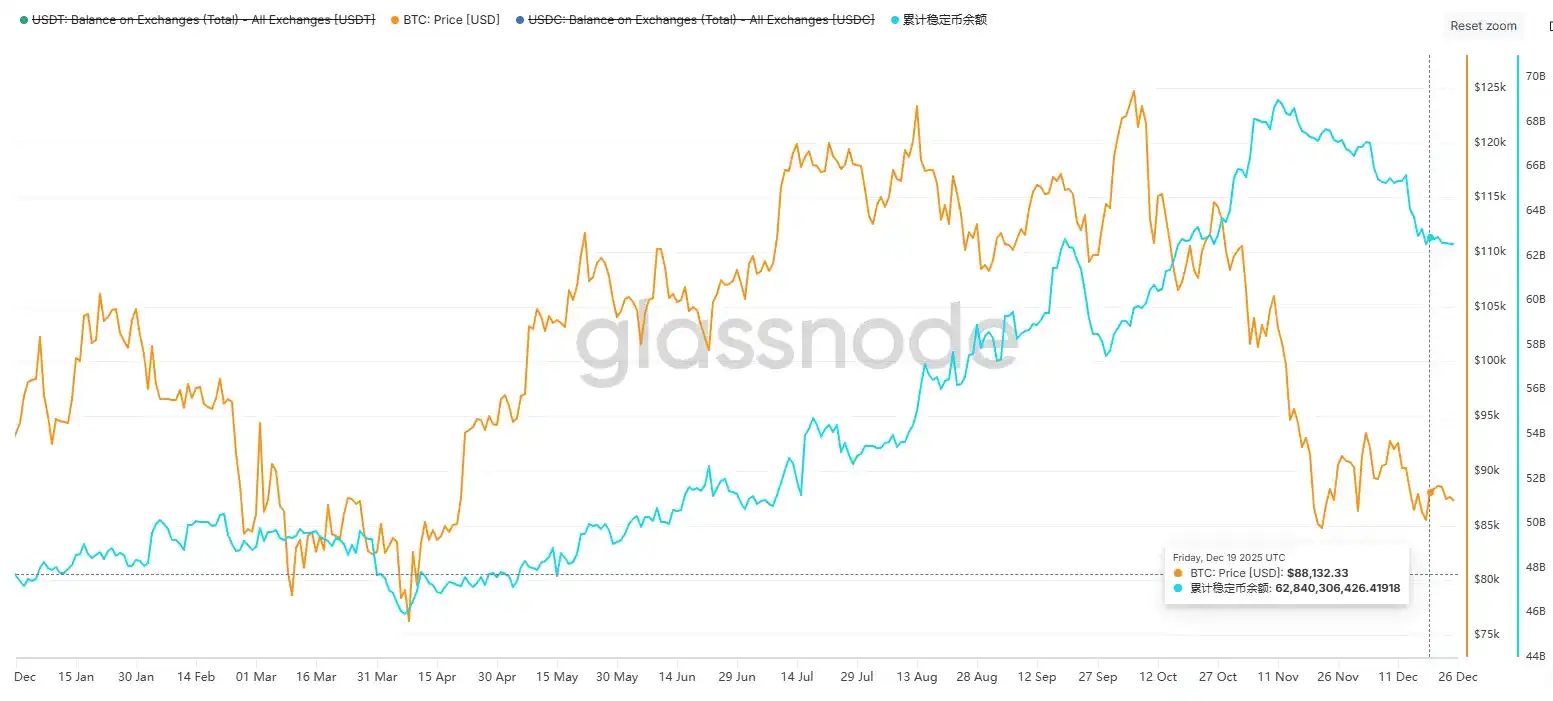
The total stablecoin market cap was $286 billion, a环比 decrease of 0.28%, with fiat-backed stablecoins experiencing a net outflow of $800 million. The current crypto market performance is disconnected from traditional financial markets, showing relative weakness. Market sentiment has not明显恢复 (significantly recovered), with a strong wait-and-see atmosphere. Exchange stablecoin balances slightly decreased this week, and there was no stablecoin inflow during BTC's rebound, indicating the market has not fully stabilized.
Altcoin Index and Market Sentiment

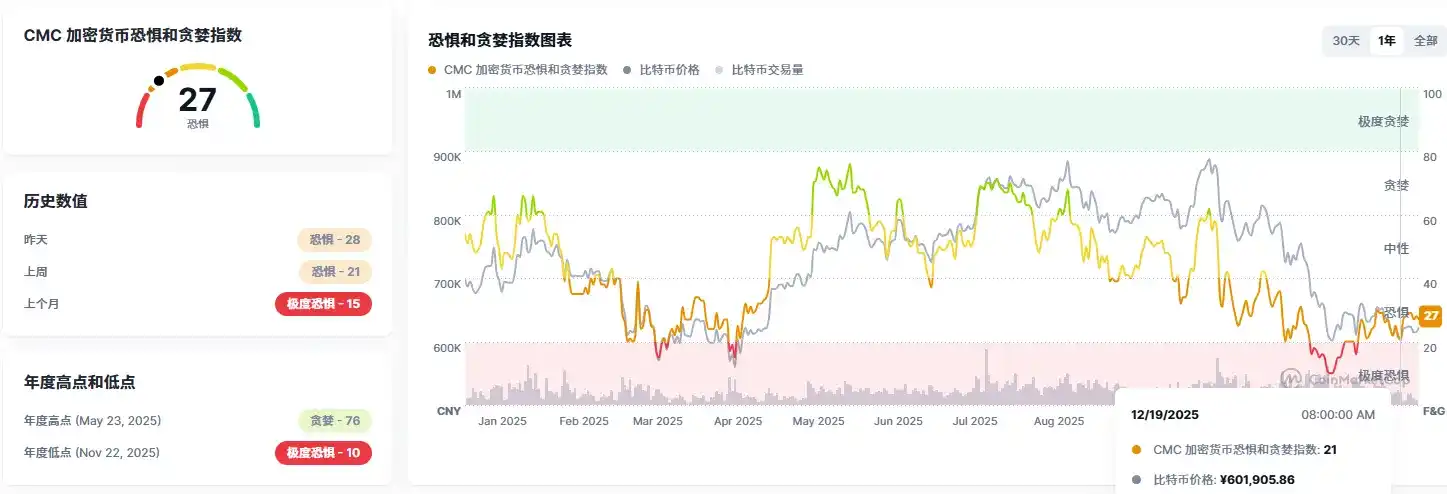
This Friday, the altcoin index was 16. Major altcoins maintained low-level fluctuations, with low market trading activity. The market sentiment index rose to 27, an improvement from last week.个别 (Individual) altcoins performed actively, but overall热度 (heat) was insufficient.

Altcoin Overview

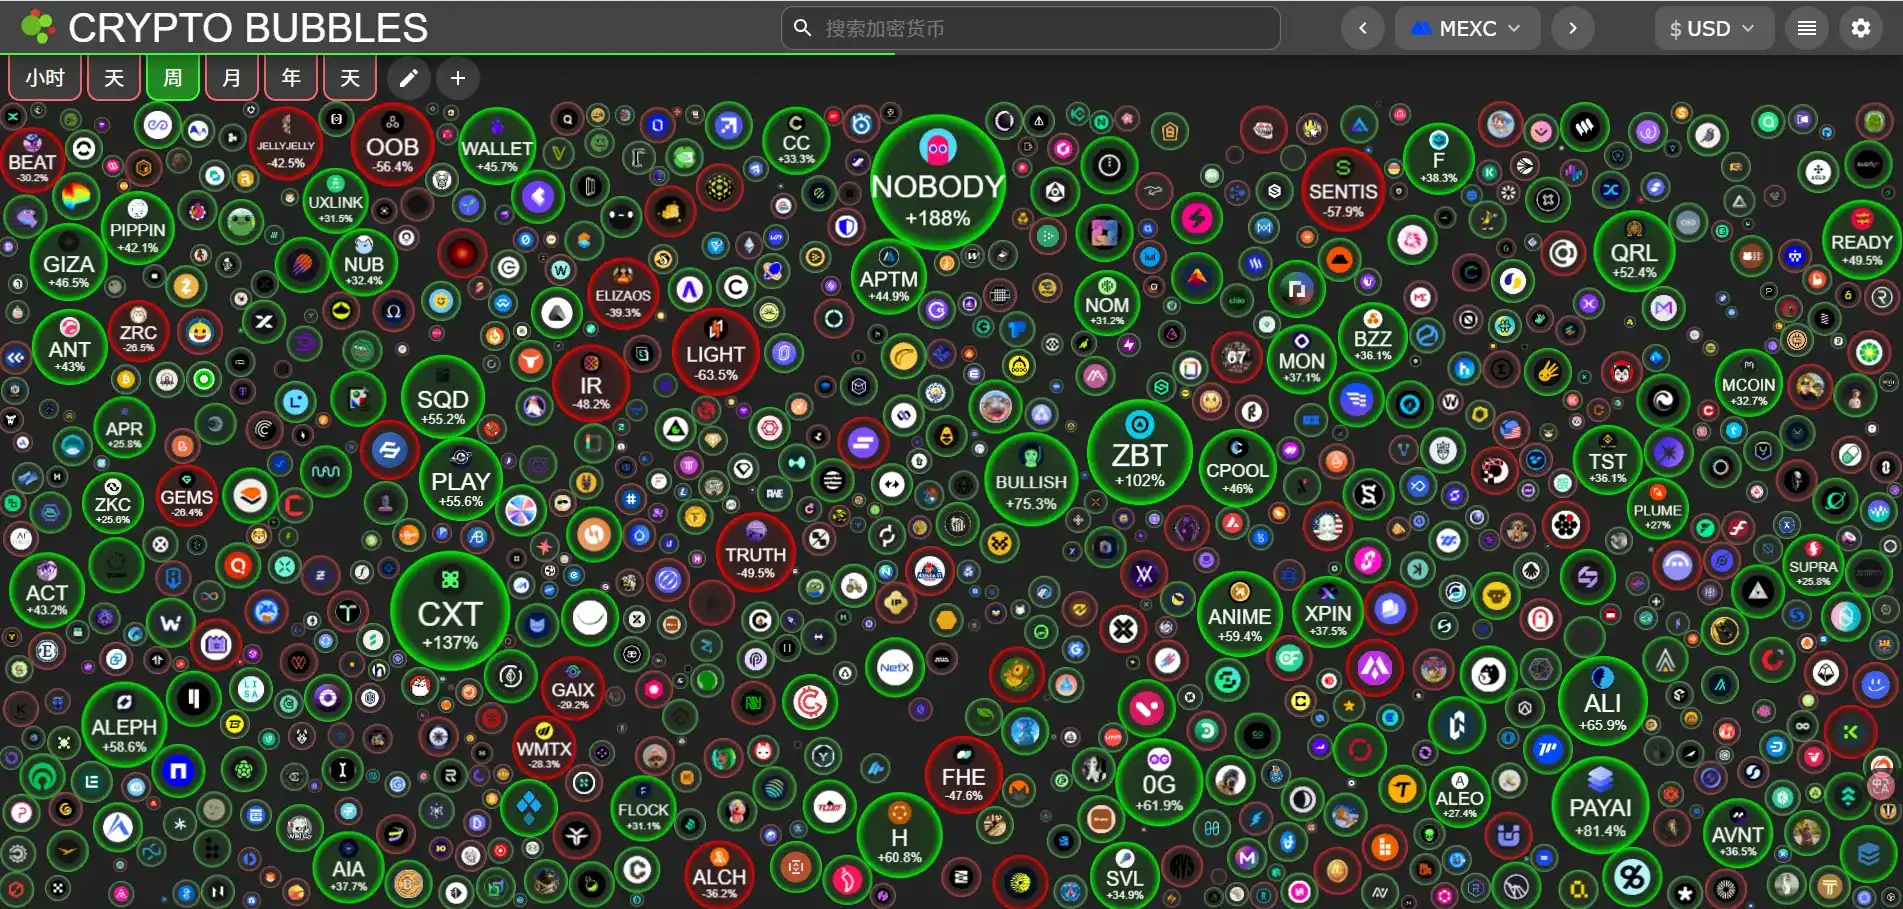
This week, the altcoin market showed an overall volatile pattern, with some tokens逆势走高 (rising against the trend). Benefiting from marginally improved stock market sentiment, the short-term sentiment and downside space of the crypto market received some support. Better-performing tokens were mainly concentrated in small-cap MEME coins and high-profile hot tokens, but the sustainability of the rally was weak, making it difficult to form sector联动效应 (linkage effects).

Top-Selling Indicator and Altcoin Heat

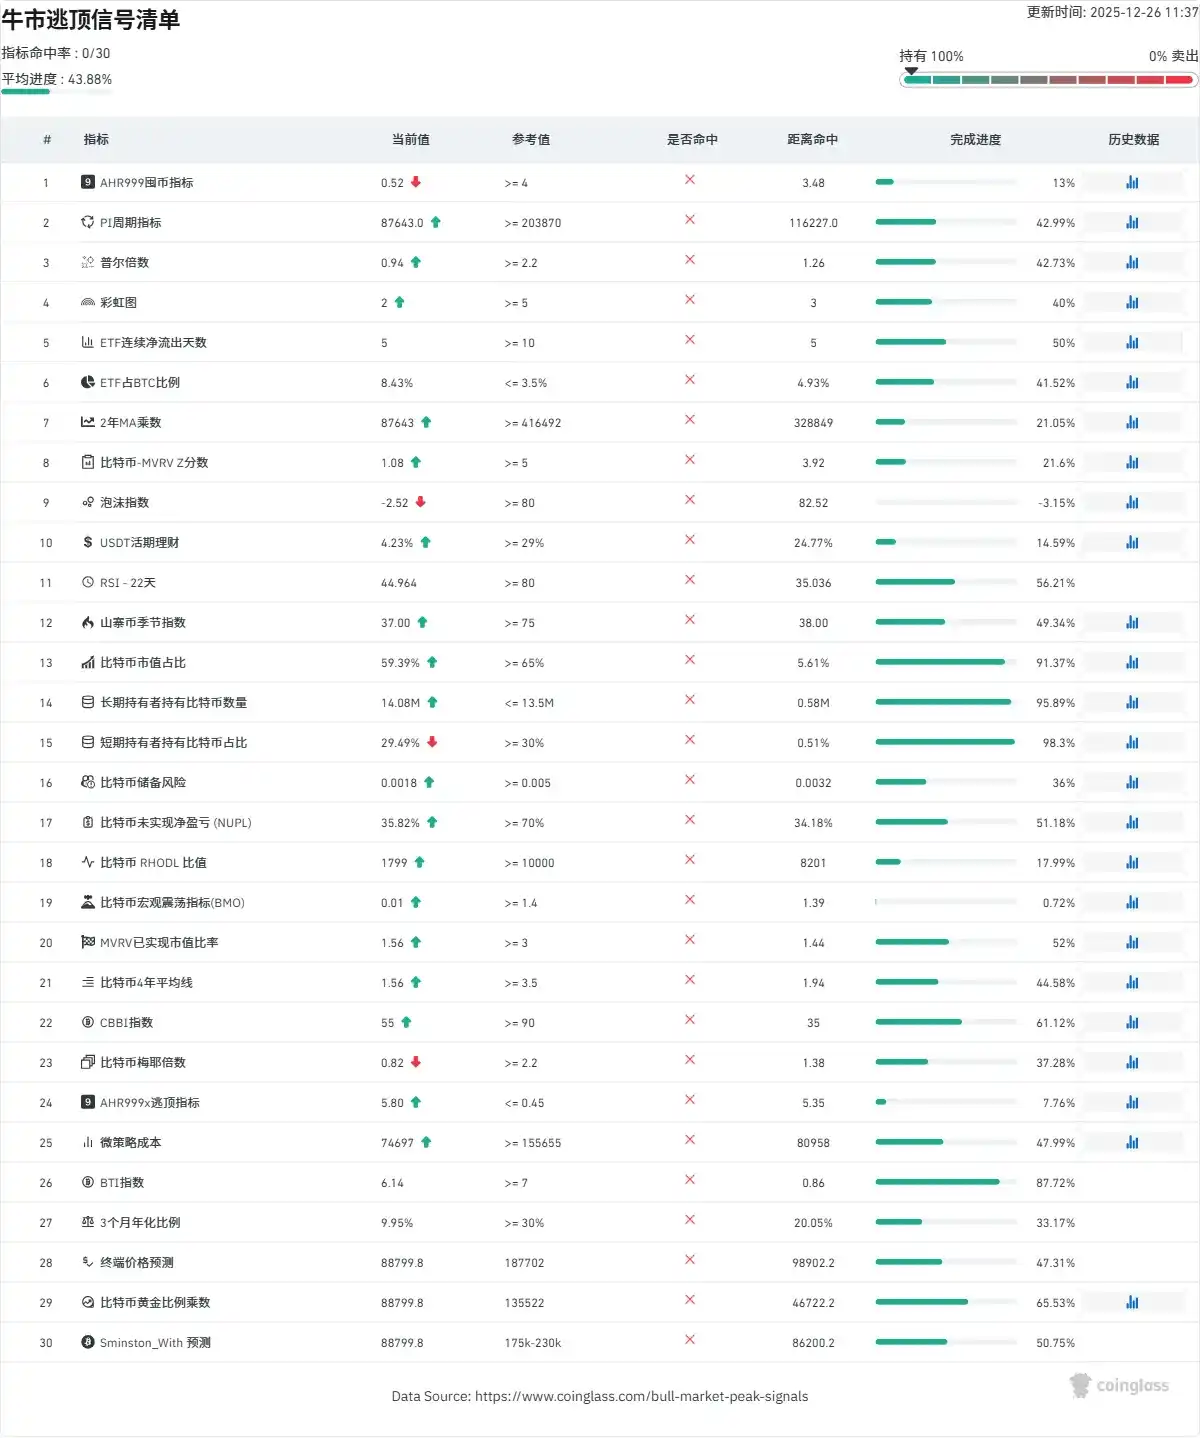
This week, the top-selling indicator did not trigger an alarm, but the proportion of short-term BTC holders increased significantly, approaching the warning threshold. Caution is needed against short-term correction risks. From the perspective of funding rates, most altcoins still had negative rates this week, but overall showed a marginal improvement trend, indicating a slight回暖 (recovery) in market speculation sentiment.

4.2 Secondary Market Analysis

4.2.1 Altcoin Strength Analysis

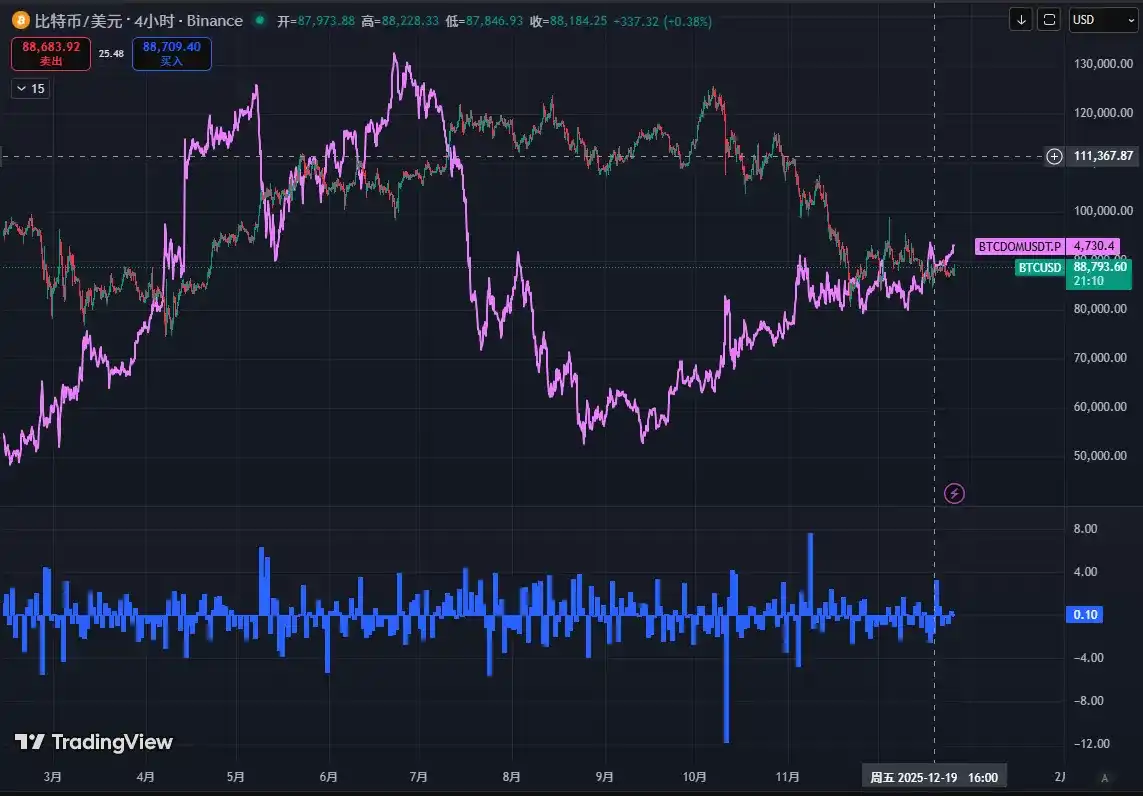
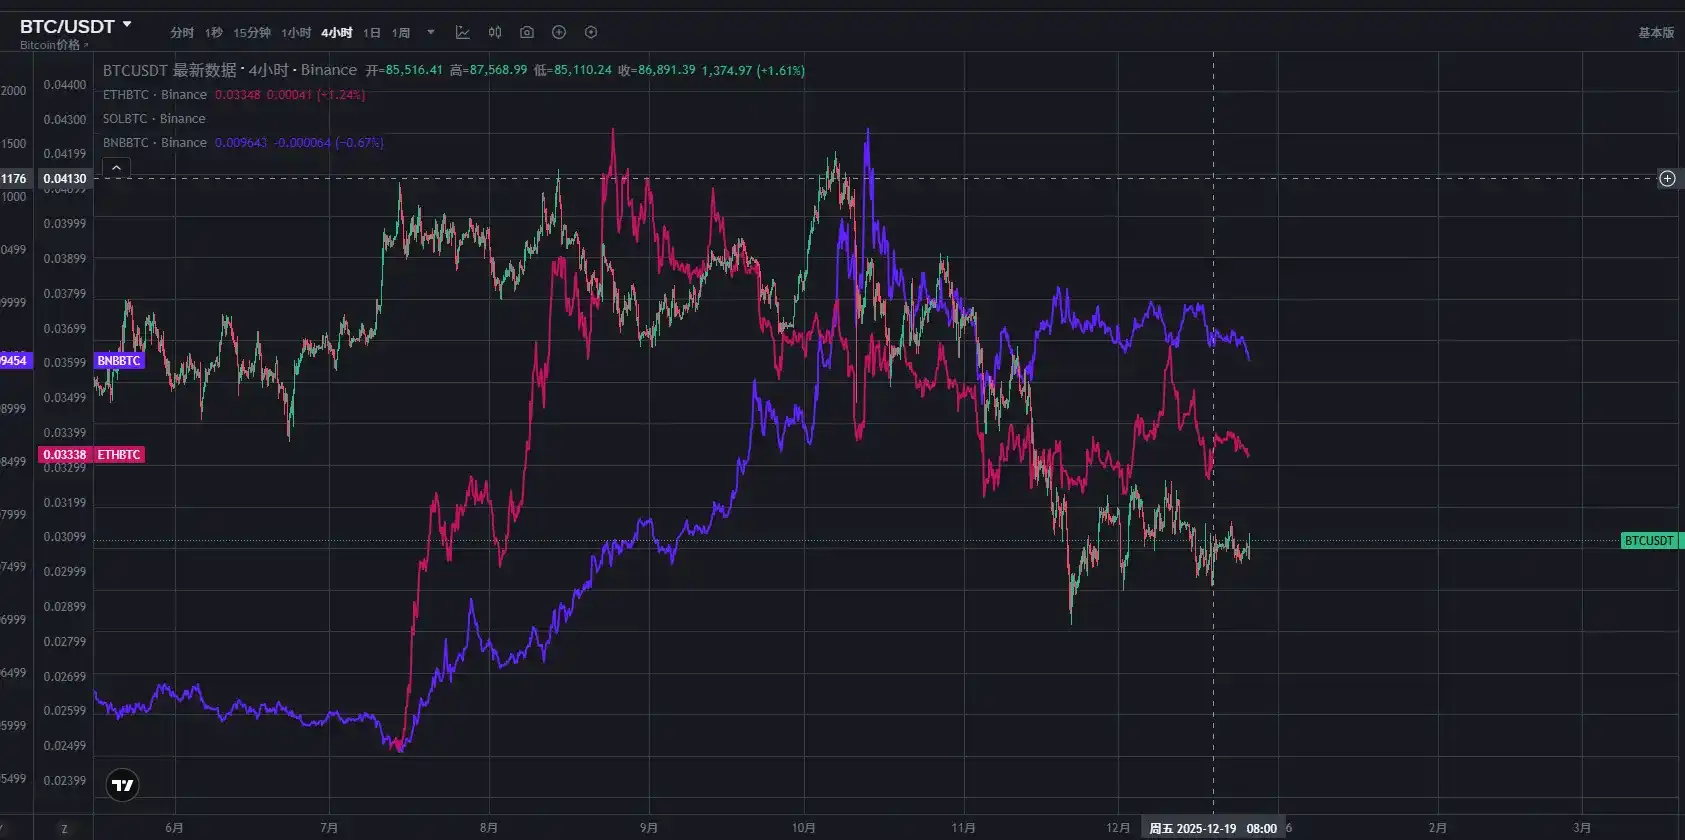
BTC's market share this week was 65.76%, a环比 increase of 0.1%, maintaining recent high-level fluctuations. Mainstream exchange rate pairs like SOL/BTC, ETH/BTC, and BNB/BTC fluctuated lower this week, overall still in a volatile or volatile downward channel. The weak pattern of altcoins relative to BTC has not significantly changed.

4.2.2 Market Flow

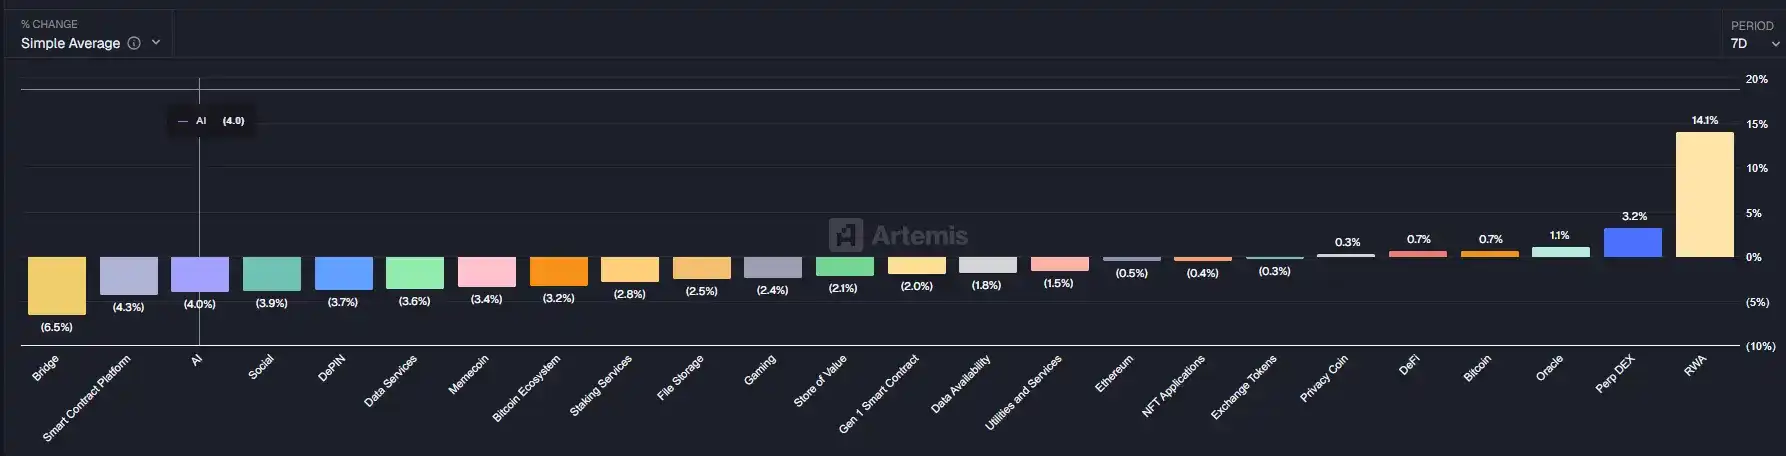
In terms of sector performance, gains and losses were differentiated this week. The RWA and PerpDEX sectors led the gains, becoming the market focus. These two sectors align with long-term market development trends and continue to attract fund attention. Regarding institutional funds, BTC and ETH ETFs continued outflows this week, with no signs of stabilization yet. Data company Bitmine did not conduct relevant purchase operations this week, indicating low institutional participation.

4.3 Primary Market Data Analysis

4.3.1 Status of the Four Major Public Chains

This week, the TVL of the four major public chains showed a slight upward trend, but the increase was lower than the price increase. Among them, ETH TVL rose from $67.2 billion to $68.1 billion, a环比 increase of 1.48%. SOL and BSC TVL remained stable at $8.3 billion and $6.4 billion, respectively. BASE TVL increased from $4.2 billion to $4.4 billion, a环比 increase of 4.76%, performing relatively突出 (outstandingly).

4.3.2 On-Chain Data Analysis

On-Chain Asset Flows

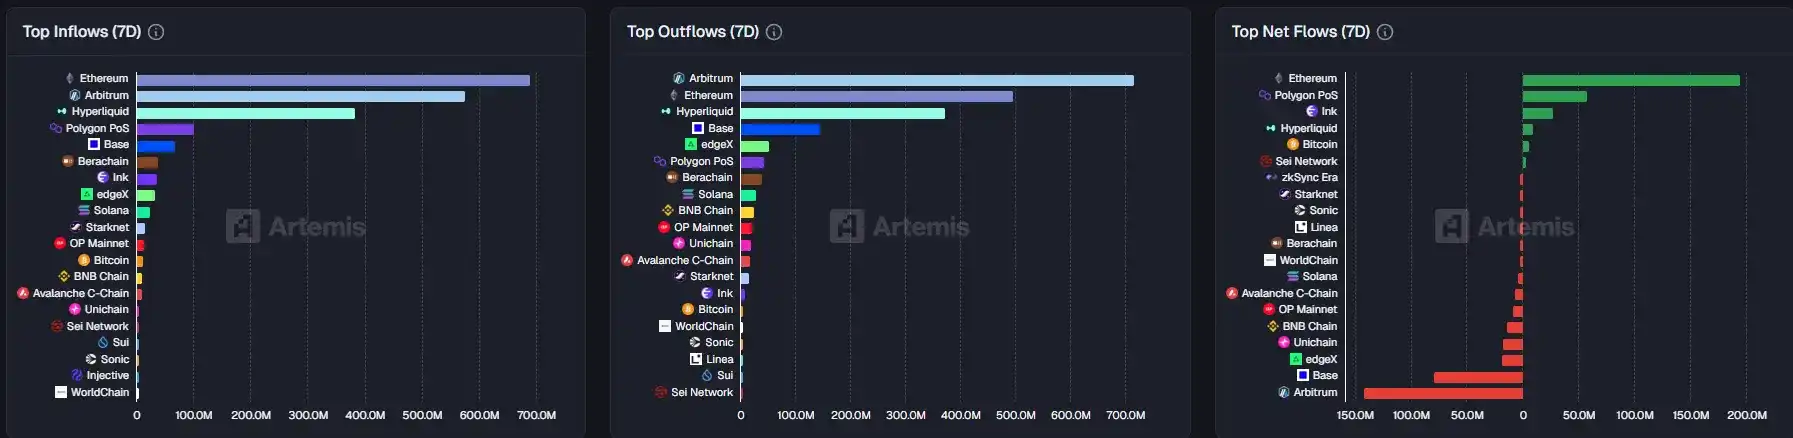
This week, USDT issuance led, while USDC experienced significant outflows. CEX funds continued to withdraw substantially, indicating that short-term market liquidity remains tight. In terms of DeFi bridge asset flows, the ETH chain had the largest net inflow, while the ARB chain had the most outflows. Overall fund flow规模 (scale) was small, and market volatility narrowed rapidly.

On-Chain User Activity and Speculative Sentiment

This week, on-chain user activity was generally average but showed a marginal improvement trend. DEX protocol revenue, active user numbers, and trading volume increased slightly环比, but overall热度 was not high, with limited gains. Market speculative sentiment is still in a low-level repair stage.

On-Chain Boom-Bust Index

Combining the TVL changes of the four major public chains and on-chain data performance, a weighted summary forms the On-Chain Boom-Bust Index (out of 100). The specific range definitions are as follows:

Extreme Prosperity: 80 points and above

Rising Line: 60-79 points

Recession Line: 50-59 points

Bear Market: 30-49 points

Data for this report was compiled and edited by WolfDAO. Please contact us if you have any questions for updates;

Author: WolfDAO( X : @10xWolfdao )

Trend Kriptolar

ctr
CitreaCTR
wstusdt
wrapped stUSDTWSTUSDT
apr
aPrioriAPR
ctx
Cryptex FinanceCTX
audio
AudiusAUDIO
comp
CompoundCOMP
mantra
MantraMANTRA
waxl
AxelarWAXL
bill
Billions NetworkBILL
pyth
PYTH (Pyth)PYTH
rune
THORChainRUNE
velodrome
Velodrome FinanceVELODROME
brev
BrevisBREV
zrx
ZRX(0X)ZRX
cake
PancakeSwapCAKE

İlgili Sorular

QWhat was the key technical support level for BTC mentioned in the article, and how did it perform?

AThe key technical support level for BTC was $85,000. It was tested and held effectively, as BTC touched a low of $84,500 before initiating a rebound, confirming the strength of this support.

QAccording to the stablecoin data, what was the trend in net issuance, and what does it indicate about market funds?

AThe net issuance of stablecoins was negative at -$326 million for the week, indicating a continued outflow of funds. However, the rate of outflow significantly narrowed compared to the previous week, falling from a daily average of -$117.7 million to -$46.5 million, suggesting a 60% improvement in fund flow and correlating with a stabilizing market that did not see sustained declines.

QWhat is identified as a core prerequisite for a trend reversal in the Bitcoin market?

AA return to net inflows for Bitcoin ETFs is identified as the core prerequisite for the market to achieve a trend reversal. The article states that despite a technical price rebound, the continued and expanding net outflows from ETFs prevent a sustainable upward trend.

QWhat does the low OTC premium rate for USDT and USDC suggest about market sentiment?

AThe low OTC premium rates for USDT (97.86%) and USDC (98.36%), which are at yearly lows, suggest that market sentiment remains pessimistic. It indicates a lack of strong buying interest from off-exchange funds and the presence of capital outflows.

QWhat was the overall trend for the altcoin market (TOTAL3), and which types of tokens performed relatively well?

AThe total market cap of altcoins (TOTAL3) increased by 1.95% to $822.3 billion, showing a震荡 (volatile/oscillating) trend. Performance was better among small-cap meme coins and high-profile trending tokens, but the rallies were short-lived and failed to create sustained sector-wide momentum.

İlgili Okumalar

U.S. Tech Momentum Stocks Post Largest Single-Day Gain Ever, But Is the Plunge Over?

US tech momentum stocks staged a sharp rebound on Tuesday (July 21st). Morgan Stanley's TMT Momentum Factor surged over 12%, marking its largest single-day gain on record, exceeding even peaks from the 2000 dot-com bubble. Key momentum indices from Goldman Sachs also posted their strongest daily performances in years. The rally was led by semiconductors, with the Philadelphia Semiconductor Index jumping 4.6%. This rebound followed three consecutive down days and a cumulative 33% plunge in momentum stocks, one of the steepest drawdowns since the dot-com era. Analysts attribute the surge largely to a short squeeze. Heavy selling had pushed high-beta momentum stocks into deeply oversold territory, forcing many short sellers, particularly in Asia, to cover their positions, creating a self-reinforcing buying spiral. However, the rebound's internals appear weak. Trading volume was notably low, and advancing stocks still lagged decliners on the S&P 500, indicating a narrow, concentrated rally rather than broad market participation. Diverging views emerge on the outlook. BTIG warns the bounce has hit key resistance and recommends selling into strength, citing extreme volatility and historical parallels to past market tops. Conversely, Goldman Sachs and UBS believe the momentum unwind is nearing its end, suggesting it may be time to gradually add exposure, as positioning has been significantly reduced. They caution, however, that high volatility warrants a measured approach, potentially using defined-risk strategies. The upcoming earnings season, particularly reports from major tech firms like Alphabet, is seen as a critical test for the rally's sustainability. Simultaneously, bond markets flashed a warning, with yields rising partly due to spiking oil prices. Analysts note that if long-term Treasury yields break decisively higher, it could pose a significant headwind for equities, especially growth stocks.

marsbit6 dk önce

U.S. Tech Momentum Stocks Post Largest Single-Day Gain Ever, But Is the Plunge Over?

marsbit6 dk önce

U.S. Tech Momentum Stocks Record Largest Single-Day Gain Ever, but Has the Rout Ended?

U.S. tech momentum stocks staged a dramatic rebound on Tuesday, July 21st. Key momentum indices like the Morgan Stanley TMT Momentum Factor and Goldman Sachs' High Beta Momentum Long Index posted historic or near-historic single-day gains, fueled largely by semiconductor stocks. This sharp rally followed a severe three-day sell-off that saw momentum stocks plunge 33%, marking one of the steepest pullbacks since the dot-com bubble. Analysts attribute the bounce primarily to a short squeeze, as forced covering from over-leveraged traders, particularly in Asia, created a buying spiral. However, the rally's health is questioned due to weak market breadth—overall trading volume was low, and decliners outnumbered advancers in the S&P 500 despite the index's gain—suggesting a narrow, concentrated surge rather than broad recovery. Opinions on the sustainability diverge. BTIG strategists warn the rebound has hit key resistance levels, citing extreme volatility and historic stock dispersion as signs of an ongoing broader correction, and recommend selling into strength. Conversely, Goldman Sachs and UBS view the aggressive momentum unwinding as nearing its end, noting reduced positioning and a lack of new fundamental catalysts. They suggest the sell-off presents a selective opportunity to add exposure, albeit cautiously and gradually using defined-risk strategies. The immediate trajectory hinges on the ongoing earnings season, with market focus on Alphabet's capital expenditure guidance for AI investment clarity. Meanwhile, bond markets present a risk, with rising Treasury yields—potentially heading toward 5.5%—and widening credit spreads for mega-cap tech companies posing a threat to equity valuations. The combination of technical factors, earnings results, and macro conditions leaves the durability of the rebound in doubt.

链捕手9 dk önce

U.S. Tech Momentum Stocks Record Largest Single-Day Gain Ever, but Has the Rout Ended?

链捕手9 dk önce

Long-Divided Must Unite, Long-United Must Divide: When L1 Becomes Its Own Rollup, What Is Ethereum's Endgame?

"The Inevitable Cycle: When L1 Becomes Its Own Rollup – What is Ethereum's Endgame?" For years, the Ethereum community grappled with concerns that L2s were fragmenting the ecosystem and eroding L1's value. While L2s provided cheaper execution, they also splintered liquidity and the unified user experience of a single chain. This has prompted a fundamental reassessment of the relationship between L1 and L2. Ethereum's roadmap is evolving. The "Scale" initiative merges L1 and L2 expansion into a holistic framework. L1 itself is advancing with higher gas limits, statelessness, and zkEVM verification, no longer content to be just a low-throughput settlement layer. Consequently, the primary value proposition of L2s is shifting from merely providing cheap blockspace to offering L1 cannot easily provide: application-specific optimizations, privacy features, and flexible governance models. L2s are becoming a spectrum of execution environments with varying degrees of security inheritance from Ethereum. A critical challenge in this multi-chain future is interoperability. The vision is to make Ethereum "feel like one chain again." This relies on advancements in native account abstraction (like EIP-7702) and intent-based architectures (Open Intents Framework), where users declare desired outcomes, and solvers handle the complex cross-chain execution. Furthermore, shortening Ethereum's finality time from minutes to seconds is crucial, as it underpins trust between chains for bridges, stablecoins, and cross-chain applications. Perhaps the most provocative idea is that Ethereum L1 itself could become a form of "its own Rollup." As zkEVM and proof systems mature, high-performance nodes could execute transactions and generate validity proofs. Regular validators would then verify these proofs instead of re-executing all transactions. This blurs the traditional L1/L2 hierarchy, making "Rollup" more of a general execution-verification architecture. Native Rollup aims to integrate L2 validation more directly into the Ethereum protocol, allowing L2s to inherit L1's security more fully and move away from reliance on security councils. In the end, L2s are not destined to replace L1 or be made obsolete by it. The likely future is a unified system where diverse execution environments—each optimized for specific use cases like DeFi, gaming, or privacy—coexist. They will share a common foundation of security, liquidity, and verifiable state, seamlessly connected to restore a cohesive user experience. The next phase for Ethereum is not just about scaling through separation, but about intelligently reintegrating what was separated back into a coherent whole.

链捕手25 dk önce

Long-Divided Must Unite, Long-United Must Divide: When L1 Becomes Its Own Rollup, What Is Ethereum's Endgame?

链捕手25 dk önce

Agent Race Ends, Super Workbench Takes Over

The era of fragmented AI agents is ending. Over the past month, China's tech giants—Tencent, Alibaba, and ByteDance—have simultaneously shifted strategy: instead of launching new, standalone AI agents, they are consolidating their various agent projects into unified "super workbenches." Tencent integrated its QClaw teams into WorkBuddy, a strategic product hailed as a potential third flagship after QQ and WeChat. Alibaba is merging its QoderWork, Wukong, and MuleRun agents into a new "Qianwen Office" platform under DingTalk's leadership. ByteDance rebranded its TRAE SOLO coding agent to TRAE Work, signaling a broader focus on workflow collaboration. This convergence marks a pivotal industry consensus. The initial exploration phase, where companies rapidly built numerous overlapping agents for different scenarios, proved costly and inefficient. With open-source tools eroding technical barriers, competition has shifted from agent creation to resource consolidation and cost control. Historically, platform wars are won not by creating more products, but by simplifying them—as seen with browsers unifying web access and super-apps consolidating services. Now, the "super workbench" aims to become the unified AI entry point for work. This reflects a deeper market realization: the primary audience for AI is no longer just programmers (a market in the tens of millions) but all knowledge workers (a market of billions). The real opportunity lies in augmenting everyday tasks—managing emails, documents, data, and meetings—across the entire workday. The core battleground is becoming control over the primary AI entry point that employees use daily. Tencent's WorkBuddy leverages WeChat and Tencent Docs; Alibaba's Qianwen Office taps into DingTalk's organizational data; ByteDance's TRAE Work integrates with Feishu's workflows. Whoever owns this "super workbench" gains strategic control over orchestrating enterprise data and APIs. This shift is redefining enterprise software. Traditional SaaS applications, valued for their user interfaces, will recede into the background. Their core functionalities will be exposed as standardized "Skills" or APIs for the super workbench's agents to invoke. Software value will shift from selling user seats to charging based on API calls and outcomes delivered. The evolution of agents is moving through clear stages: first as novel standalone products, then as consolidated primary work entry points, and finally as pervasive, invisible capabilities embedded into the digital fabric. The recent moves by major tech firms signal the transition from the first stage into the second, accelerating toward the third. In the end, the most successful agent technology may become invisible—like electricity or the HTTP protocol—a fundamental, unnamed infrastructure powering work itself.

marsbit52 dk önce

Agent Race Ends, Super Workbench Takes Over

marsbit52 dk önce

İşlemler

Spot

Popüler Makaleler

O Nasıl Satın Alınır

HTX.com’a hoş geldiniz! O1 exchange (O) satın alma işlemlerini basit ve kullanışlı bir hâle getirdik. Adım adım açıkladığımız rehberimizi takip ederek kripto yolculuğunuza başlayın. 1. Adım: HTX Hesabınızı OluşturunHTX'te ücretsiz bir hesap açmak için e-posta adresinizi veya telefon numaranızı kullanın. Sorunsuzca kaydolun ve tüm özelliklerin kilidini açın. Hesabımı Aç2. Adım: Kripto Satın Al Bölümüne Gidin ve Ödeme Yönteminizi SeçinKredi/Banka Kartı: Visa veya Mastercard'ınızı kullanarak anında O1 exchange (O) satın alın.Bakiye: Sorunsuz bir şekilde işlem yapmak için HTX hesap bakiyenizdeki fonları kullanın.Üçüncü Taraflar: Kullanımı kolaylaştırmak için Google Pay ve Apple Pay gibi popüler ödeme yöntemlerini ekledik.P2P: HTX'teki diğer kullanıcılarla doğrudan işlem yapın.Borsa Dışı (OTC): Yatırımcılar için kişiye özel hizmetler ve rekabetçi döviz kurları sunuyoruz.3. Adım: O1 exchange (O) Varlıklarınızı SaklayınO1 exchange (O) satın aldıktan sonra HTX hesabınızda saklayın. Alternatif olarak, blok zinciri transferi yoluyla başka bir yere gönderebilir veya diğer kripto para birimlerini takas etmek için kullanabilirsiniz.4. Adım: O1 exchange (O) Varlıklarınızla İşlem YapınHTX'in spot piyasasında O1 exchange (O) ile kolayca işlemler yapın.Hesabınıza erişin, işlem çiftinizi seçin, işlemlerinizi gerçekleştirin ve gerçek zamanlı olarak izleyin. Hem yeni başlayanlar hem de deneyimli yatırımcılar için kullanıcı dostu bir deneyim sunuyoruz.

177 Toplam GörüntülenmeYayınlanma 2026.06.19Güncellenme 2026.06.29

O Nasıl Satın Alınır

PROS Nasıl Satın Alınır

HTX.com’a hoş geldiniz! Pharos (PROS) satın alma işlemlerini basit ve kullanışlı bir hâle getirdik. Adım adım açıkladığımız rehberimizi takip ederek kripto yolculuğunuza başlayın. 1. Adım: HTX Hesabınızı OluşturunHTX'te ücretsiz bir hesap açmak için e-posta adresinizi veya telefon numaranızı kullanın. Sorunsuzca kaydolun ve tüm özelliklerin kilidini açın. Hesabımı Aç2. Adım: Kripto Satın Al Bölümüne Gidin ve Ödeme Yönteminizi SeçinKredi/Banka Kartı: Visa veya Mastercard'ınızı kullanarak anında Pharos (PROS) satın alın.Bakiye: Sorunsuz bir şekilde işlem yapmak için HTX hesap bakiyenizdeki fonları kullanın.Üçüncü Taraflar: Kullanımı kolaylaştırmak için Google Pay ve Apple Pay gibi popüler ödeme yöntemlerini ekledik.P2P: HTX'teki diğer kullanıcılarla doğrudan işlem yapın.Borsa Dışı (OTC): Yatırımcılar için kişiye özel hizmetler ve rekabetçi döviz kurları sunuyoruz.3. Adım: Pharos (PROS) Varlıklarınızı SaklayınPharos (PROS) satın aldıktan sonra HTX hesabınızda saklayın. Alternatif olarak, blok zinciri transferi yoluyla başka bir yere gönderebilir veya diğer kripto para birimlerini takas etmek için kullanabilirsiniz.4. Adım: Pharos (PROS) Varlıklarınızla İşlem YapınHTX'in spot piyasasında Pharos (PROS) ile kolayca işlemler yapın.Hesabınıza erişin, işlem çiftinizi seçin, işlemlerinizi gerçekleştirin ve gerçek zamanlı olarak izleyin. Hem yeni başlayanlar hem de deneyimli yatırımcılar için kullanıcı dostu bir deneyim sunuyoruz.

182 Toplam GörüntülenmeYayınlanma 2026.06.22Güncellenme 2026.06.29

PROS Nasıl Satın Alınır

VERONA Nedir

I. Proje Tanıtımı VERONA, zincir soyutlaması aracılığıyla herkes için, her yerde inşa edilmiş bir blok zinciridir. Genel Soyutlama katmanını kullanarak, VERONA, hesaplar, imzalar ve birlikte çalışabilirlik gibi karmaşık blok zinciri işlevlerini doğrudan protokol seviyesinde entegre ederek kendini ayırt eder. Bu yaklaşım, temel teknolojileri anlamaya gerek kalmadan blok zinciri uygulamalarıyla etkileşimde bulunmayı sağlar.1) Temel Bilgiler İsim: VERONA (VERONA)III. İlgili Bağlantılar Resmi web sitesi bağlantısı: https://xion.burnt.com/ Whitepaper: https://xion.burnt.com/whitepaper.pdf Keşif Araçları: https://explorer.burnt.com/ Sosyal Medya: https://x.com/burnt_xion Not: Proje tanıtımı, resmi proje ekibi tarafından yayımlanan veya sağlanan materyallerden alınmıştır, yalnızca referans içindir ve yatırım tavsiyesi teşkil etmez. HTX, ortaya çıkan doğrudan veya dolaylı kayıplardan sorumluluk kabul etmez.

173 Toplam GörüntülenmeYayınlanma 2026.06.22Güncellenme 2026.06.22

VERONA Nedir

Tartışmalar

HTX Topluluğuna hoş geldiniz. Burada, en son platform gelişmeleri hakkında bilgi sahibi olabilir ve profesyonel piyasa görüşlerine erişebilirsiniz. Kullanıcıların A (A) fiyatı hakkındaki görüşleri aşağıda sunulmaktadır.

活动图片