May witnessed two transfers of pricing power. First, the risk-free rate seized pricing power back from the crypto narrative, thoroughly exposing Bitcoin's high-beta property; then, after rates and geopolitics both eased at the month's end, capital outflow within the crypto market and investor capitulation took over price control.
On price, BTC initially surged to the $82,850 region at the start of the month, then faced sustained pressure and declined, closing the month at $73,674 in a unilateral downward trend. The most noteworthy record was the final week – the external environment turned practically accommodative, yet the crypto market refused to follow. This was a textbook case of "failed liquidity transmission," also a typical sample of a deep bear market's brutality.
Three internal market lines deteriorated simultaneously in May, which is the true root cause of the decline:
· First, double loss of incremental capital. BTC spot ETFs saw a net outflow of $2.425 billion for the entire month, the third-largest single-month outflow since their inception (only behind February 2025's $3.555 billion and November 2025's $3.481 billion), while stablecoin supply contracted simultaneously.
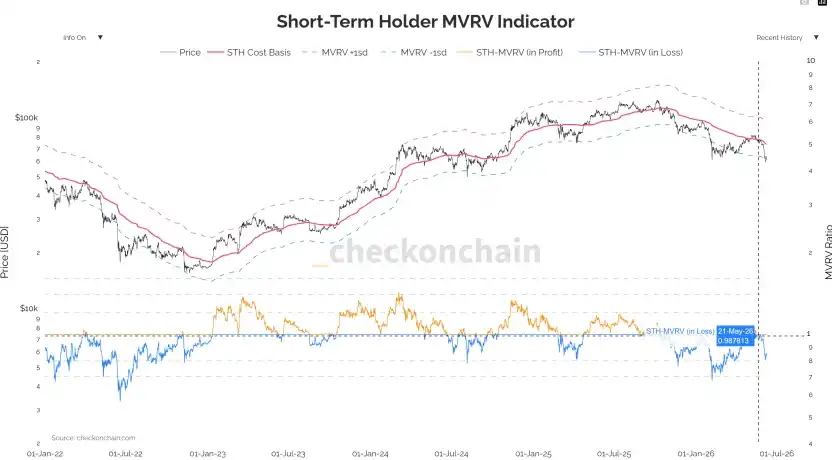
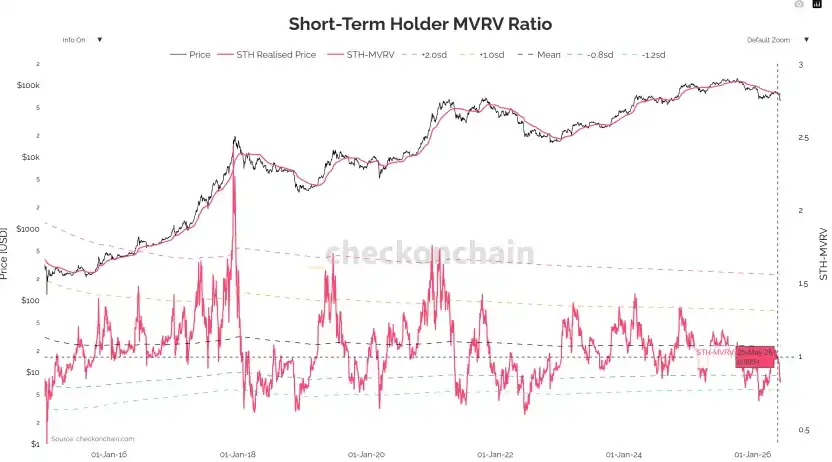
· Second, investor capitulation selling. The MVRV for short-term holders fell below the 1.0 equilibrium line into the loss zone, presenting a textbook capitulation pattern on-chain.
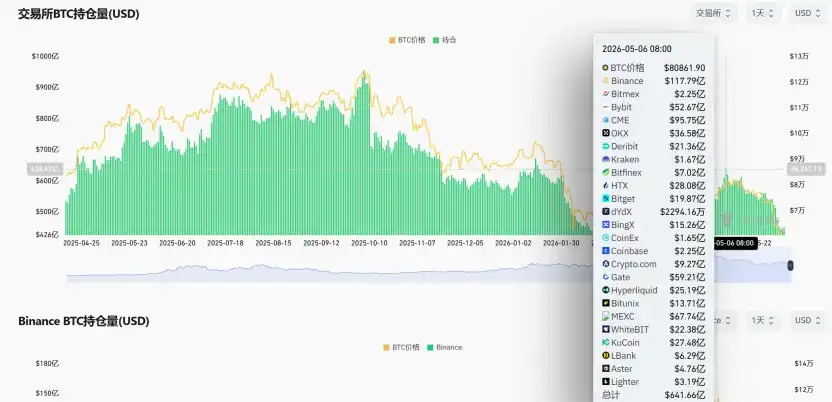
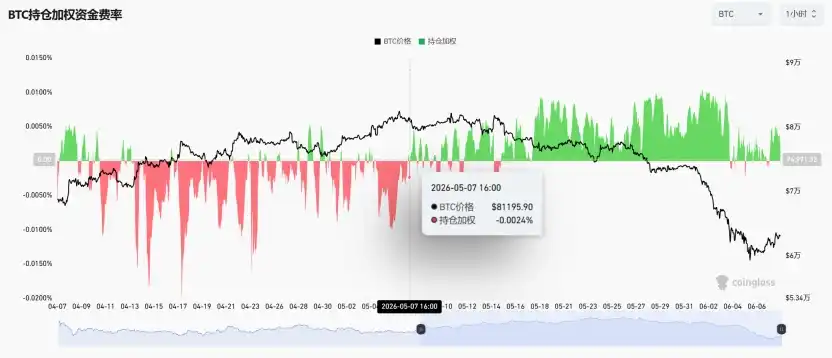
· Third, derivative longs adding leverage against the trend. Open interest increased against the trend to over $64 billion, funding rates turned positive, culminating in a brutal deleveraging with $307 million in long liquidations (shorts only $90 million).
May marked the "initiation" of a new round of independent decline after the rebound interlude concluded, and it was an "acceleration phase" within a cyclical deep bear market liquidation. When it stops no longer depends on macro factors, but on whether external capital outflow can be stemmed and long-term holder liquidation can slow down.
I. Macro & Geopolitics: Two Transfers of Pricing Power, Transmission Breakdown in Final Week
Phase One: Inflation Re-accelerates, Easing Expectations Rolled Back
The April CPI on May 12th was the first inflection point this month. Superficially mild, but the structure deteriorated – core services inflation (super core) accelerated for the third consecutive month, the stickiest dimension directly linked to employment and wages. The next day, April PPI surged to 6.0%, hitting a new high since late 2022; simultaneously, China's PPI turned positive for the first time in 41 months, marking the end of the "Chinese goods deflation" tailwind that had suppressed global inflation for two years.
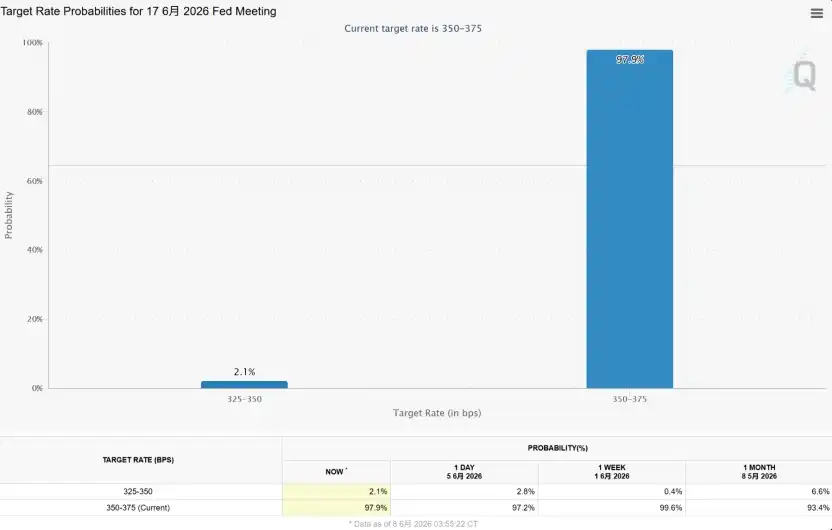
The market's focal point of博弈 completed a paradigm shift: from "when will rates be cut" to "how much will rates be raised." A timeline clarification is needed here – a near-term meeting rate hike was hardly on the table (CME showed a >99.4% probability of no change in June), but the tail end of the policy path was significantly raised. The market no longer believed in automatic cuts and began pricing in "forced hikes." This shift alone was enough to systematically increase the discount rate for all high-beta assets.
Phase Two: Fed Shakeup, Reaction Function Becomes Unstable
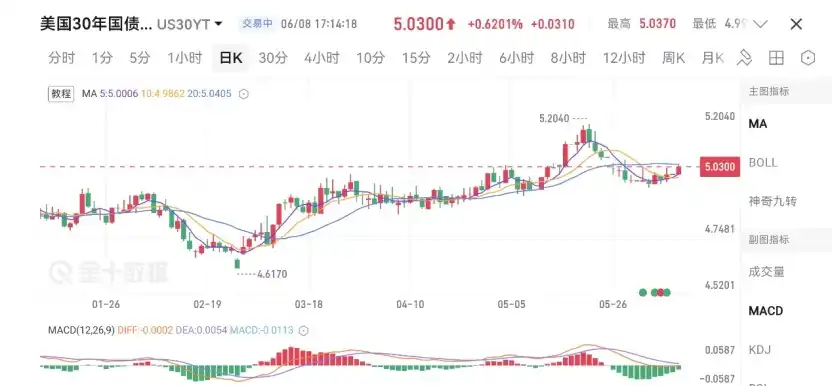
On May 15th, reformist Wash officially took the helm of the Fed, pushing an agenda of "de-transparency" including abolishing the dot plot and canceling press conferences. On the same day, the outgoing chair broke 75 years of Fed tradition, announcing they would remain a governor until 2028 for internal checks and balances. This marked the deepest internal power split within the Fed since 1951. Its market implication lies not in policy disputes, but in the significantly decreased predictability of the reaction function. The bond market responded directly: 30-year Treasury yields pushed to 5.19%, a high since before the Subprime Crisis; the dollar index reached a six-week high. For assets valued via discounted cash flows, this was a direct and unsolvable打击.
Phase Three: Geopolitical Thaw, But Transmission Chain Breaks
Geopolitics was the core扰动源 for oil prices and thus the inflation path in May, playing out in four stages: "easing—fading—escalation—thaw." Early-month easing rhetoric caused WTI to drop over 7% in a single day, with BTC first breaking below $80,000; mid-month US-Iran talks stalled; late-month conflict escalated frequently, with Brent hovering high at $107–$111. End-of-month plot twist – on May 28th, the US and Iran reached a 60-day ceasefire extension memorandum, "unrestricted passage" through the Strait of Hormuz, Iran cleared naval mines, geopolitics premium was largely digested, and WTI closed at $88.53.
Entering the final week, the negative feedback loop from mid-month – "geopolitical tension → high oil prices → sticky inflation → rate hike expectations → strong dollar & Treasuries → risk assets under pressure" – was collectively interrupted: The 10-year Treasury yield fell about 11 bps weekly to 4.45%, the dollar index dropped to 98.91; the S&P rose 1.43% weekly, Nasdaq rose 2.39% hitting consecutive closing highs, and the Nikkei rose over 1200 points in a day. In principle, this "rates down, oil down, dollar down, stocks up" combination should have provided significant support for crypto, but the market refused to follow. This precisely marks the crypto market's evident deterioration.
The complete reset of correlations reinforced this point. Mid-month, Asia-Pacific risk aversion (South Korea's KOSPI dropping 5% in a day, triggering a circuit breaker) briefly increased BTC's correlation with the Nasdaq, but entering late-month, the 30-day rolling correlation coefficient between BTC and the Nasdaq declined sharply and turned deeply negative, hitting a nearly one-year low. The same macro tailwinds flowed to completely different fates: stocks rallied together, crypto alone fell – concrete evidence of this deep negative correlation.
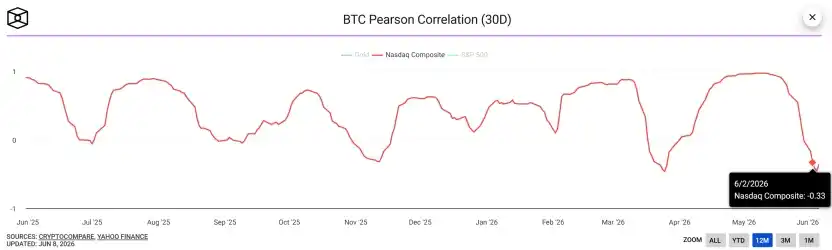
This decoupling has dual meanings. Short-term, it objectively confirms "internal liquidation dominance" – crypto no longer moves in sync with macro risk appetite but is driven by its own capital flows and positioning structure. Medium-term, it implies that even if US stocks continue hitting new highs, their pull effect on crypto will be extremely limited. A layer of mid-term vigilance must also be retained: Goldman Sachs warns global visible crude inventories are only 73 days of demand; geopolitical thaw does not equal an oil price peak. Inflation concerns remain suspended high. Its impact on risk assets?
II. Capital Flows: Monthly ETF Reversal, Deteriorating Coinbase Premium
This was the most directionally significant part of the month and the most direct evidence of "internal bleeding."
Monthly ETF Flows: Complete Reversal from April Net Inflow to May Substantial Net Outflow
First, BTC spot ETFs. April saw a single-month net inflow of $1.966 billion, pushing cumulative net inflows to a historical peak of $58.088 billion, with total AUM first breaking $100 billion, reaching $100.532 billion. Entering May, flows completely reversed – the entire month saw a net outflow of $2.425 billion, the third-largest single-month net outflow since product inception, only behind February 2025 (-$3.555B) and November 2025 (-$3.481B); cumulative net inflows fell back to $55.663 billion, total AUM shrank to $94.169 billion, evaporating over $6.4 billion in a single month.
The key is that this was a progressive放大 throughout the month, not a one-off shock: by mid-May, cumulative net outflows were already around $1.417 billion, further expanding to the full-month outflow of $2.425 billion by month-end. Capital not only failed to stabilize but accelerated its flight by month-end.
ETH spot ETFs confirmed the same trend: April still saw a net inflow of $356 million, total AUM $13.253 billion; May turned to a net outflow of $541 million, also ranking as the third-largest single-month outflow historically (only behind November 2025's $1.424B and December's $617M), cumulative net inflows fell back to $11.37 billion, total AUM shrank to $11.266 billion. Both BTC and ETH saw net inflows in April and significant net outflows in May, both刷新各自史上第三大单月流出 – this represents systematic de-risking of the entire crypto asset class by institutions.
The conclusion is clear: The "ETF marginal buying" narrative that dominated the entire rally since the halving has factually exited the stage in May. The most important incremental channel turned from an "engine" in April to a "pump" in May. (Is the conclusion "factual exit" appropriate? I think it can only express that a major support for the April rally has now turned into resistance.)
Coinbase Premium: From Mainly Positive in April to Severe Negative in May
The Coinbase Premium Index is the most direct window to identify spot buying/selling pressure from US-based institutions. In April, the index was still mainly positive (green), with US institutions net buying on most trading days, forming the现货侧 basis for April's rebound. Entering May, the index turned almost entirely negative (red) and to a severe degree – as可见 from the chart, the negative premium区间持续扩张, depth approaching the extreme zone of -0.22%, one of the most sustained and deepest negative premium intervals in the past year.
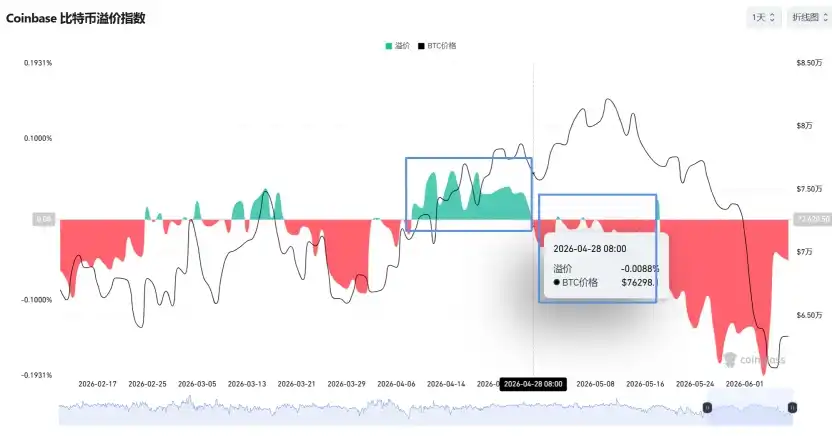
The turning point from positive to negative premium aligns perfectly with the reversal节奏 of monthly ETF net outflows, each corroborating the other. The core driver behind this is an asset rebalancing dominated by relative yields – as Treasury yields became more attractive, US institutions are "voting with their feet," swapping BTC positions for Treasury positions. Notably, even after Treasury yields fell by month-end, reducing the套利诱因 significantly, the negative premium did not repair but remained stable – indicating institutional exit has moved beyond单纯的 "yield comparison" to include an added layer of预期确认 for the crypto cycle's downturn.
Futures vs. Spot Scissors Spread
Concurrent with ETF失速, CME open interest grew against the trend to over $64 billion. The market switched from "spot absorption-driven" to "futures positioning-driven" – the so-called "resilience above 80K" was essentially not real incremental demand but extended leverage positions. It ultimately cleared via a惨烈 stampede of $307M in weekly long liquidations versus only $90M in shorts.
III. On-chain: Cost Basis Matrix Fully Breached, Capitulation Signals Confirmed
On-chain data paints the "internal liquidation" even more淋漓尽致.
1. True Market Mean & 200-day MA: From Never Firmly Held to Confirmed Breach
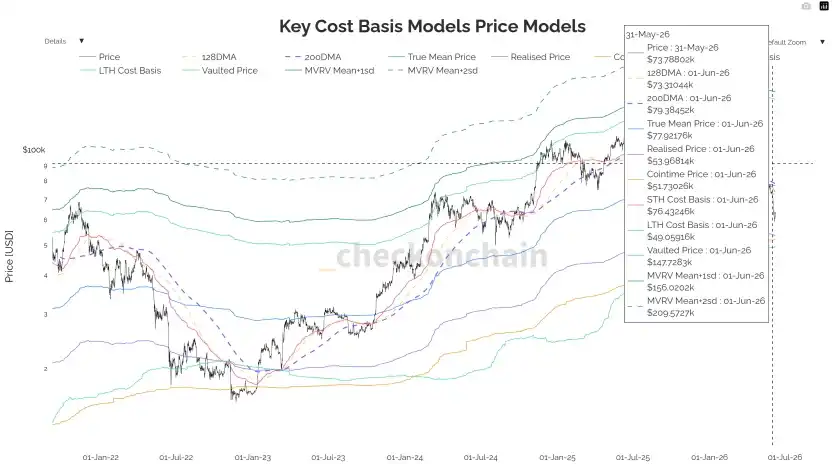
According to the Key Cost Basis Models chart, the True Market Mean and the 200-day MA together constitute a熊牛分界带 repeatedly validated over the past three BTC cycles, located in the 77–79K range in May. The early-month rebound briefly reclaimed it but failed to establish footing. After breaking below on May 18th, it was substantially lost. By month-end, price operated below this分界带, with lower moving average zones as the factual support. This key threshold has turned from underlying support to overhead "压顶云," with all short-term holders deeply underwater.
2. Realized Profit/Loss Ratio: Not Rising, But Falling
This indicator's 30-day MA above 1 represents profit-taking dominance. It was 0.4 at the February 2026 low, rising to 1.8 in mid-May – but confirming a bull market shift requires consistently staying above 2.0. The end-of-month reality: not only never reaching 2.0, but falling back to 1.56. Each wave of上涨 encountered解套式 selling pressure from earlier buyers, making every rally short-lived.
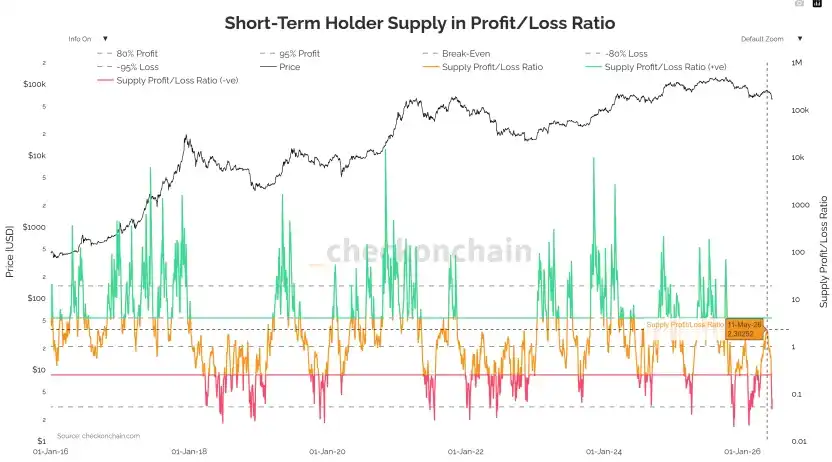
3. MVRV & NUPL: Capitulation Signals Confirmed
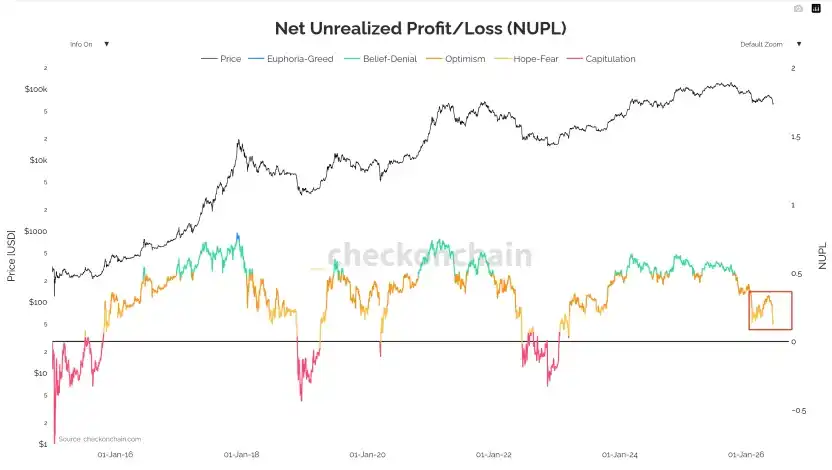
As clearly seen in the STH-MVRV chart, this ratio has fallen below the 1.0 equilibrium line into the loss zone – this is an objective刻度 of "short-term holders整体亏损," also one of the most identifiable capitulation signals in past deep corrections. The NUPL indicator (Net Unrealized Profit/Loss) simultaneously confirms deteriorating sentiment: As可见 from the chart, NUPL has significantly retreated from the "Optimism-Belief" zone (blue-green) at the year's start to the edge of the "Hope-Fear" zone (orange),接近 the key transition zone before the 2022 bear market bottom. This objectively measures the持续压缩 of market unrealized profit space and structural回落 in risk appetite.
IV. Derivatives & Public Company Reserves: Deleveraging & the 75K Psychological Line
1. Market Maker Gamma & Expiry Effects
Early-month price stability came from market makers' long gamma. BTC being pinned in a narrow range around 80K was not due to真实供需平衡, but a mechanical "price stabilizer" from market makers holding大量 long gamma – selling on rises, buying on dips, actively compressing volatility. This explains why, despite hot CPI and geopolitical tensions, BTC's actual volatility kept declining (30D RV fell to 27%).
Consecutive expiries directly altered market structure. The monthly expiry on May 15th saw over $4 billion in notional value清算 from IBIT alone; after this巨型头寸 rolled off, market makers' stabilizing ability faded, and BTC顺势 broke below 77.5K on May 18th. The second, more critical monthly expiry on May 29th saw about $7.5 billion集中清算 market-wide; before expiry, spot price had already breached the 75K max pain and max short gamma zones, with passive short hedging flows further加剧 end-of-month selling pressure.
2. The 75K Trap Has Been Triggered
The largest short gamma cluster was locked in the 75K–76K区间 (over $8 billion负伽马). Once falling into this zone, market maker hedging reverses to顺势 selling, forming a gamma squeeze downward. End-of-month reality: this trap has been triggered, breached alongside the cost-based psychological底线 of public company BTC reserve strategies. Only the last line of defense among the three共振防线 remains – the deeper, cycle-level cumulative cost band.
3. Skew Defensive Intent Continues Rising
1M Skew expanded from +2.7% at month-start to +6.2% on the breakout day, 6M Skew maintained +10% highs – institutions are not just hedging short-term events but building structural downside protection for the entire second half of 2026.
4. Public Company BTC Reserve Cost Line: From Largest Marginal Buyers to Potential Sellers
Leading "BTC reserve strategy" companies have an average cost around the $75,000–$76,000 range. Q1 earnings calls saw management首次松口, stating "would not rule out selling部分 BTC in极端情况" – the rarest attitude shift in a decade, substantially altering the博弈结构. Previously, such companies were absolute marginal buyers; the expectation of buying on dips itself formed underlying support. Now, with "possible sales," the once-largest marginal buyers are forced to become顺周期 sellers. The month-end close at $73,674 has substantially breached this cost line. Metaplanet, Semler, and similar companies mostly have costs in the 70K–80K range – losing 75K is not a single-company event but the beginning of同步去杠杆 risk for the entire public company BTC reserve ecosystem.
V. Market Outlook
Current Structural Positioning. We characterize late May as "having confirmed a局部顶部 and loss of key defense lines, with probability of structural下行延展 significantly increased."
This is the stage where participants最容易判断失误 – longs are repeatedly诱入 by "maybe it's just a healthy correction" to buy dips, shorts are repeatedly震出 by "maybe this is the bottom." But month-end laid the残酷的事实 bare: when macro and geopolitics both turned favorable, the crypto market fell instead of rising, accompanied by the third-largest monthly ETF outflow ever, deeply negative correlation with Nasdaq, and on-chain short-term holder capitulation – price leadership has shifted from "external macro" back to "internal liquidation." Until BTC effectively reclaims 77.5K and confirms with volume, left-side bottom fishing faces extremely high胜率惩罚.
A cycle-level positioning signal worth referencing: The Bitcoin 200-week MA Quantile Regression current分位数 has fallen to 10.2%, within the historical green "value zone." This statistical feature appeared before major bottoms in 2015, end-2018, and end-2022 – it does not constitute a short-term bottom-fishing basis but suggests: From a cycle dimension, the asset has entered a meaningful value区间, and deep bear market liquidation is objectively completing. However, it must be明确 that historically,从分位数 entering the value zone to price真正企稳 requires a 3–6 month time window for持仓换手 to complete.
Conclusion
May, in the most counter-intuitive way, put a long-avoided question before everyone: When external tail risks are removed and the market still cannot rise, it shows the real drag has been internalized as the cycle's own liquidation momentum. The final week saw geopolitical thaw, falling rates, declining oil, equities rallying in unison, yet BTC fell against the trend, ETFs reversed from April's net inflow to May's $2.425B monthly outflow, BTC-Nasdaq correlation turned deeply negative, on-chain short-term holders capitulated – this is a standard sample of "macro-to-crypto liquidity transmission宣告失败," and a集中体现 of a four-year cycle deep bear's残酷性. Judging by the 200-week MA分位数 reading of 10.2%, a cycle-level value zone has been entered, but a value zone is not a reversal zone; historically,从分位数触底 to price trend reversal typically requires a 3–6 month window.
The next true bull market启动 must wait for two premises to be simultaneously satisfied: First, substantive and sustainable easing of the "inflation-rates-liquidity" triangle, not the脉冲式 easing driven by a single geopolitical event like month-end. Second, reignition of on-chain demand-side (not derivative leverage) –止血回流 through both ETF and stablecoin channels, Coinbase premium turning from negative to positive, on-chain capitulation ending.
Until then, conservatism equals value, discipline equals收益 – the most mathematically meaningful应对方法 in a phase where structural liquidation is not yet complete and price has breached short-term holders' cost basis. Wealth comes from cycles, but survival is always the prerequisite for making it to the next round.
ETF Data:https://sosovalue.com/zh/assets/etf/us-eth-spot