If Dogecoin Breaks Through This Sell Wall, Expect A Pump

bitcoinist2026-04-04 tarihinde yayınlandı2026-04-04 tarihinde güncellendi

Özet

Dogecoin (DOGE) has been in a prolonged downtrend, but analysts suggest a potential major price surge if it breaks through a key sell wall around $0.09. Crypto analyst CW notes that if DOGE strongly surpasses this level, it could trigger a bullish reversal with a potential rally toward $1.12—a gain of over 1,144%. The coin has been trading in a descending channel since September 2025, and a breakout could mark the end of its bearish trend. Another expert, Osemka, also suggests an upward move is more likely than a breakdown. As of now, DOGE remains around $0.091, still below key resistance levels.

The Dogecoin (DOGE) price has been in a prolonged downtrend for months, basically mirroring Bitcoin’s decline and showing no signs of a sustained recovery or uptrend. However, a crypto analyst has suggested that this might change soon. The analyst has identified a critical sell wall on the Dogecoin chart that, if broken, could trigger a major trend shift and provide enough momentum for the meme coin to pump higher.

Dogecoin Could Rally If Sell Wall Breaks

Crypto market analyst CW has highlighted a major sell wall around the $0.09 that could determine Dogecoin’s next bullish move. In an X post on Wednesday, the analyst noted that Dogecoin is already preparing to break through this key area, as its price tests $0.09 and holds this support level firmly.

According to the analyst, if DOGE can push past this current support zone with strength, there may be no other resistance level strong enough to hold the meme coin until around $1.12. This means that CW expects the DOGE price to rise quickly toward this new high, representing a staggering increase of more than 1,144% from $0.09.

Source: Chart from CW on X

The market expert noted that this price surge could come with a bullish trend reversal, likely confirming the end of Dogecoin’s prolonged downtrend. Notably, the analyst’s chart shows that the meme coin has been trading sideways within a descending channel since its price surge in September 2025.

After rallying above the $0.25 area, Dogecoin has moved downward, previously crashing to this same critical support zone around $0.09 during the devastating October 2025 liquidation event. Although the meme coin rose back to normal levels, it remained range-bound inside this descending channel. With price showing strong breakout signals, CW has stated that once Dogecoin rises above this channel, its next major uptrend could begin in days.

DOGE Breakdown Remains The Less Likely Scenario

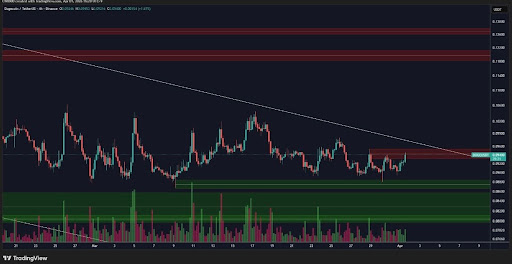
In a separate X post, market analyst Osemka shared a price chart showing Dogecoin hovering around $0.09. He noted that the meme coin is currently trading in a tight range, with the price stuck between support and resistance. According to him, this behavior cannot last forever, suggesting that the DOGE price could soon make a strong move either upward or downward to break the critical area.

Based on his chart analysis, Osemka appears cautiously bullish on Dogecoin. He said it would be a “little miracle” for Dogecoin to break downward, suggesting the more likely scenario is a strong rise above $0.09 soon. If this happens, it could completely invalidate DOGE’s bearish outlook and possibly trigger its next trend shift to the upside.

As of now, the market is cautiously watching as DOGE trades around $0.091 at the time of writing, still trapped below both the Exponential Moving Average (EMA) and the descending channel.

DOGE trading at $0.09 on the 1D chart | Source: DOGEUSDT on Tradingview.com

İlgili Sorular

QWhat is the critical price level that Dogecoin needs to break through for a potential pump, according to analyst CW?

AThe critical price level that Dogecoin needs to break through is the sell wall around $0.09.

QWhat is the potential price target for Dogecoin if it successfully breaks the $0.09 resistance with strength?

AIf Dogecoin breaks through the $0.09 resistance with strength, the next major resistance isn't expected until around $1.12, representing a potential increase of over 1,144%.

QWhat chart pattern has Dogecoin been trading within since its price surge in September 2025?

ADogecoin has been trading sideways within a descending channel since its price surge in September 2025.

QAccording to analyst Osemka, what would be a 'little miracle' for Dogecoin's price to do?

AAccording to Osemka, it would be a 'little miracle' for Dogecoin's price to break downward from its current range.

QWhat event in October 2025 previously caused Dogecoin to crash to the $0.09 support level?

ADogecoin previously crashed to the $0.09 support level during the devastating October 2025 liquidation event.

İlgili Okumalar

STRC Breaks Below $95: Why Does It Continue to Depeg? Is There Default Risk?

"STRC Falls Below $95: Why the Persistent Depegging and Is There Default Risk?" The article discusses the recent decline in the price of STRC, a perpetual preferred stock issued by Strategy (MSTR) designed to trade around a $100 par value. As of publication, STRC traded at $94.65, raising market concerns. STRC is described as a high-yield cash flow product, offering an 11.50% annual dividend paid monthly. Its "preferred" status grants it priority over common stock for dividends and in liquidation. Key reasons cited for the price depegging include: 1. **Bitcoin's Price Drop:** MSTR's assets are heavily tied to Bitcoin (BTC), which fell over 21% from its recent high, pressuring all Strategy-related products. 2. **Competitive Pressure:** Rival Strive Asset Management's similar product, SATA, offers daily dividends and has maintained its $100 par value with a ~13% yield. In response, Strategy has proposed changing STRC's dividend frequency from monthly to bi-weekly, pending shareholder vote. 3. **Technical Selling:** A break below $100 may have triggered algorithmic selling and stop-losses, exacerbating the decline. Regarding default risk, the analysis suggests it is currently low. Strategy founder Michael Saylor confirmed the June 2026 dividend rate remains at 11.50% with no cuts or suspensions. The company's massive reserve of 843,706 BTC provides a significant backstop for its obligations. Industry opinions are mixed. Some analysts view the BTC holdings as reliable support for dividends, while critics like Peter Schiff warn of potential dividend cuts leading to price crashes and lawsuits. Others highlight inflation risk and the company's ability to reduce dividends without a formal default. In summary, STRC's drop is attributed to BTC volatility, competition, and technical factors. While immediate default risk appears contained, the product faces challenges from market conditions and competitive dynamics.

marsbit32 dk önce

STRC Breaks Below $95: Why Does It Continue to Depeg? Is There Default Risk?

marsbit32 dk önce

AI Trading Cools, South Korean Stocks Plunge 1.8%, Spot Gold Rises 1%, Bitcoin Dives

A sell-off in AI-related stocks, triggered by Broadcom's disappointing earnings forecast, sent shockwaves through global markets. South Korea's KOSPI led Asia's decline, plunging 1.8% as the risks from concentrated chip stock gains and surging leveraged investments came to the fore. The tech-heavy Nasdaq 100 futures fell 0.5% following Broadcom's 14% after-hours plunge, which signaled a slower-than-expected transition to AI clients. This pullback extended Wall Street's weakness, halting the S&P 500's nine-day rally amid hawkish Fed signals and renewed Middle East tensions. South Korean authorities convened an emergency meeting, pledging "immediate measures" against market volatility and warning of record-high stock margin debt. The adjustment rippled across assets: Bitcoin fell to around $64,000, its lowest since February, while safe-haven gold rose 1% on bargain hunting. Oil prices dipped on Middle East ceasefire news. Market analysts noted the sell-off was driven by profit-taking after massive gains, particularly in chip stocks like Samsung and SK Hynix, which now dominate the KOSPI. Wall Street banks are divided on Korea's outlook, with Goldman Sachs raising its target while Citigroup and others warn of overvaluation and a potential bubble. Bridgewater's Ray Dalio noted that great technological shifts often create bubbles. Meanwhile, Fed officials' hints at potential future rate hikes added to the cautious mood ahead of key U.S. jobs data.

华尔街日报58 dk önce

AI Trading Cools, South Korean Stocks Plunge 1.8%, Spot Gold Rises 1%, Bitcoin Dives

华尔街日报58 dk önce

Seeking Alpha's Hot Article: Why Might the U.S. Stock Market Crash in June?

In a recent Seeking Alpha article, financial professor and analyst Damir Tokic argues that the US stock market may be poised for a significant crash in June 2026. The core thesis centers on a "mega-bubble" in equities, particularly within the technology sector, which has driven the S&P 500 to near-record valuations, with a Shiller P/E ratio exceeding 40—a level comparable to the 2000 dot-com bubble. Tokic identifies two primary catalysts for a potential collapse. First, he points to unsustainable market exuberance fueled by what he terms the "Trump Stimulus"—massive AI capital expenditure by tech giants, which he believes is politically driven and cannot last. Second, and more urgently, he highlights the escalating Iran war as a critical threat. The ongoing closure of the Strait of Hormuz has created a severe global energy supply crunch. Strategic petroleum reserves are projected to hit critically low operational levels by June, potentially causing oil prices to spike above $200 per barrel and triggering a severe, supply-driven inflationary shock. This scenario, Tokic warns, would force the Federal Reserve's hand. Despite currently maintaining a dovish bias, the Fed would likely be compelled to officially pivot to a hawkish stance at its June FOMC meeting to combat soaring inflation and bond yields. He contends that such a shift—or even a failure to act, which would destroy Fed credibility—could be the trigger that punctures the market bubble. The resulting downturn, he concludes, could rival the bear markets of 2000 and 2008, advising investors to prepare for a major correction.

marsbit1 saat önce

Seeking Alpha's Hot Article: Why Might the U.S. Stock Market Crash in June?

marsbit1 saat önce

İşlemler

Spot
Futures

Popüler Makaleler

PUMP Nasıl Satın Alınır

HTX.com’a hoş geldiniz! Pump.fun (PUMP) satın alma işlemlerini basit ve kullanışlı bir hâle getirdik. Adım adım açıkladığımız rehberimizi takip ederek kripto yolculuğunuza başlayın. 1. Adım: HTX Hesabınızı OluşturunHTX'te ücretsiz bir hesap açmak için e-posta adresinizi veya telefon numaranızı kullanın. Sorunsuzca kaydolun ve tüm özelliklerin kilidini açın. Hesabımı Aç2. Adım: Kripto Satın Al Bölümüne Gidin ve Ödeme Yönteminizi SeçinKredi/Banka Kartı: Visa veya Mastercard'ınızı kullanarak anında Pump.fun (PUMP) satın alın.Bakiye: Sorunsuz bir şekilde işlem yapmak için HTX hesap bakiyenizdeki fonları kullanın.Üçüncü Taraflar: Kullanımı kolaylaştırmak için Google Pay ve Apple Pay gibi popüler ödeme yöntemlerini ekledik.P2P: HTX'teki diğer kullanıcılarla doğrudan işlem yapın.Borsa Dışı (OTC): Yatırımcılar için kişiye özel hizmetler ve rekabetçi döviz kurları sunuyoruz.3. Adım: Pump.fun (PUMP) Varlıklarınızı SaklayınPump.fun (PUMP) satın aldıktan sonra HTX hesabınızda saklayın. Alternatif olarak, blok zinciri transferi yoluyla başka bir yere gönderebilir veya diğer kripto para birimlerini takas etmek için kullanabilirsiniz.4. Adım: Pump.fun (PUMP) Varlıklarınızla İşlem YapınHTX'in spot piyasasında Pump.fun (PUMP) ile kolayca işlemler yapın.Hesabınıza erişin, işlem çiftinizi seçin, işlemlerinizi gerçekleştirin ve gerçek zamanlı olarak izleyin. Hem yeni başlayanlar hem de deneyimli yatırımcılar için kullanıcı dostu bir deneyim sunuyoruz.

308 Toplam GörüntülenmeYayınlanma 2024.12.12Güncellenme 2026.06.02

PUMP Nasıl Satın Alınır

Tartışmalar

HTX Topluluğuna hoş geldiniz. Burada, en son platform gelişmeleri hakkında bilgi sahibi olabilir ve profesyonel piyasa görüşlerine erişebilirsiniz. Kullanıcıların PUMP (PUMP) fiyatı hakkındaki görüşleri aşağıda sunulmaktadır.

活动图片