Bitcoin Capital Continues to Exit: Why A Negative 7dMA Signals A High-Risk Regime

bitcoinist2025-12-27 tarihinde yayınlandı2025-12-27 tarihinde güncellendi

Özet

Bitcoin is struggling to regain market confidence as sentiment deteriorates and apathy dominates trading. Price remains below $90,000, with repeated recovery attempts failing. On-chain data reveals a negative seven-day moving average of net capital flow at approximately -$160 million, indicating more capital is exiting the network through loss-making sales than entering via profits. Despite weak conditions, Bitcoin supply activity remains elevated, with 31.79% of supply moving in the last 180 days. This high activity reflects distribution and stress rather than accumulation, as holders exit positions at unfavorable prices. For the trend to turn positive, net capital flows must recover alongside sustained activity.

Bitcoin is struggling to regain market confidence as sentiment continues to deteriorate and apathy dominates trading behavior. Price remains capped below the $90,000 level, with repeated recovery attempts failing to gain traction. As volatility compresses and participation thins, an increasing number of analysts are warning that the market may face further downside before stability can return. For now, conviction on both sides remains limited, leaving Bitcoin vulnerable to renewed selling pressure.

On-chain data underscores this fragile backdrop. A recent report by Axel Adler examines daily capital inflows and outflows across the Bitcoin network, using a seven-day moving average of net capital flow to assess market health.

This metric captures the balance between realized profits, which represent capital entering the network, and realized losses, which reflect capital being destroyed through loss-making sales. When the net flow turns negative, it signals that participants are selling at a loss more aggressively than they are taking profits.

Currently, the seven-day average stands at approximately negative $160 million, meaning the market has been losing an average of $160 million in capital per day over the past week. The period between December 17 and 24 was marked by sharp volatility, with large outflows interspersed with brief positive days. Although December 25 saw another net inflow, it was not enough to offset prior losses.

Elevated Coin Activity Signals Distribution Under the Surface

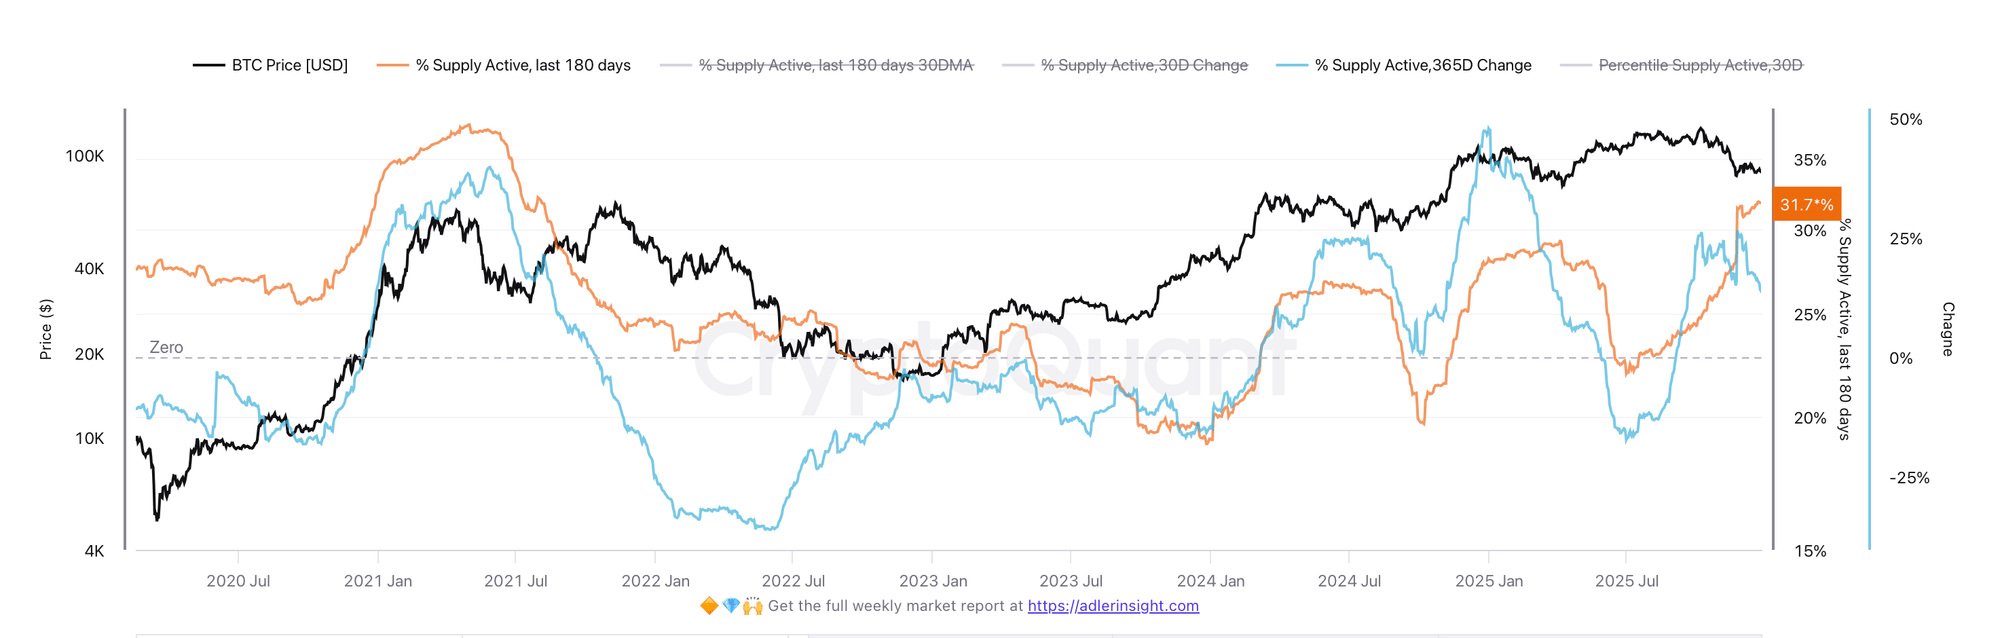
On-chain data highlighted by Adler shows that Bitcoin remains unusually active despite weak market conditions. The Bitcoin “% Supply Active (Last 180 Days)” metric tracks the share of total BTC supply that has moved at least once over the past six months.

Currently, that figure stands at 31.79%, slightly above its 30-day average of 31.43% and firmly in the 80th percentile compared with historical data. Activity has also risen sharply on a year-over-year basis, up 14.4%, indicating that coins are changing hands far more frequently than they were a year ago.

Bitcoin % Supply Active | Source: CryptoQuant

At face value, elevated activity can sometimes signal renewed interest or accumulation. In the current context, however, it carries a more cautionary implication. High supply activity is occurring alongside a negative net capital flow regime, meaning that much of this movement reflects loss-making sales rather than profitable distribution. Coins are not simply rotating between long-term holders; they are being sold under pressure.

This combination challenges the idea that the market is simply apathetic. Instead, it points to active distribution, with holders choosing to exit positions despite unfavorable prices. The distinction is important: apathy implies indecision, while distribution suggests stress.

For this metric to turn constructive, elevated activity would need to persist while net capital flows recover toward zero or positive territory. Only then would increased coin movement begin to reflect accumulation rather than capitulation.

İlgili Sorular

QWhat does a negative 7-day moving average of net capital flow indicate for the Bitcoin market?

AA negative 7-day moving average of net capital flow indicates that participants are selling Bitcoin at a loss more aggressively than they are taking profits, signaling capital destruction and a high-risk regime where the market is losing value.

QWhat is the current value of Bitcoin's 7-day average net capital flow, and what does it represent?

AThe current 7-day average net capital flow is approximately negative $160 million, meaning the Bitcoin market has been losing an average of $160 million in capital per day over the past week.

QHow does the '% Supply Active (Last 180 Days)' metric behave in the current market, and what does it suggest?

AThe '% Supply Active (Last 180 Days)' metric stands at 31.79%, above its 30-day average and in the 80th percentile historically, with a 14.4% year-over-year increase. This elevated activity, combined with negative capital flows, suggests active distribution and loss-making sales rather than accumulation.

QWhat is the difference between market apathy and distribution according to the on-chain analysis?

AMarket apathy implies indecision and lack of trading conviction, while distribution indicates active selling under pressure, with holders exiting positions despite unfavorable prices, reflecting stress and capitulation in the market.

QWhat conditions would need to occur for increased coin movement to signal accumulation rather than capitulation?

AFor increased coin movement to signal accumulation rather than capitulation, elevated supply activity would need to persist alongside a recovery in net capital flows toward zero or positive territory, indicating that coins are being bought for profit rather than sold at a loss.

İlgili Okumalar

DeepSeek Funding: Liang Wenfeng's 'Realist' Pivot

DeepSeek, a leading Chinese AI company, has initiated its first external funding round, aiming to raise at least $300 million at a valuation of no less than $10 billion. This move marks a significant shift from its founder Liang Wenfeng’s previous idealistic stance of rejecting external capital to maintain independence. Despite strong financial backing from its parent company, quantitative trading firm幻方量化 (Huanfang Quant), which provided an estimated $700 million in revenue in 2025 alone, DeepSeek faces mounting challenges. Key issues include a 15-month gap in major model updates, delays in its flagship V4 release, and the loss of several core researchers to competitors offering significantly higher compensation. The company is also undergoing a strategic pivot by migrating its infrastructure from NVIDIA’s CUDA to Huawei’s Ascend platform, a move aligned with China’s push for technological self-reliance amid U.S. export controls. However, DeepSeek lags behind rivals like智谱AI and MiniMax—both now publicly listed—in areas such as product ecosystem, multimodal capabilities, and commercialization. The funding round, though relatively small in scale, is seen as a way to establish a market-validated valuation anchor, making employee stock options more competitive and facilitating talent retention. It also signals DeepSeek’s transition from a pure research-oriented organization to a commercially-driven player in the global AI ecosystem.

marsbit14 dk önce

DeepSeek Funding: Liang Wenfeng's 'Realist' Pivot

marsbit14 dk önce

Solana Q1 Report: Revenue Plunges 68% Year-on-Year, Developers Decrease by 30%

Solana Q1 2026 Report: Key Metrics Show Significant Decline Amid Market Reset Solana experienced a substantial downturn in Q1 2026, with key performance indicators reflecting a broader market cooling. Total network revenue (REV) fell to $89.9 million, down 68% year-over-year (YoY) and 1.4% quarter-over-quarter (QoQ). This decline was driven by reduced speculative activity, which had previously fueled the network during the 2024/2025 bull market. Key revenue components saw mixed results: base fees dropped 8.7% QoQ, Jito tips (MEV) fell 19.7%, priority fees rose 23%, and vote fees declined 44.5%. The annualized real yield for stakers was just 0.17%, down 67% YoY. Network GDP, generated by top applications, fell 7% QoQ to $451 million. Pump Fun emerged as a standout, generating $103 million (up 3% QoQ), surpassing Solana's L1 revenue. However, daily active addresses averaged 2.4 million, down 4.8% YoY. Stablecoin supply on Solana reached $15.9 billion, down 2.7% QoQ but up 18% YoY. USDC and USDT remained dominant. DEX volumes averaged $3.2 billion daily, with private DEXs now accounting for 60% of all volume. The network's net dilution rate was 4.38%, while the cost to produce $1 of REV was $8.10, up 93% YoY. The number of new tokens created on launchpads grew 42% QoQ to 3 million, with Pump Fun dominating 85% of this market. Despite the downturn, Solana's core strengths remain: its position as a hub for retail trading apps, potential in perpetual markets, and growing use in stablecoin-based fintech applications, particularly in Latin America. However, developer activity declined 32% YoY, slightly worse than Ethereum's 29% drop. The network must now focus on attracting traditional finance, competing in perpetual markets, and sustaining developer ecosystem growth to drive the next expansion cycle.

marsbit51 dk önce

Solana Q1 Report: Revenue Plunges 68% Year-on-Year, Developers Decrease by 30%

marsbit51 dk önce

İşlemler

Spot
Futures

Popüler Makaleler

FRAX Nasıl Satın Alınır

HTX.com’a hoş geldiniz! FRAX (FRAX) satın alma işlemlerini basit ve kullanışlı bir hâle getirdik. Adım adım açıkladığımız rehberimizi takip ederek kripto yolculuğunuza başlayın. 1. Adım: HTX Hesabınızı OluşturunHTX'te ücretsiz bir hesap açmak için e-posta adresinizi veya telefon numaranızı kullanın. Sorunsuzca kaydolun ve tüm özelliklerin kilidini açın. Hesabımı Aç2. Adım: Kripto Satın Al Bölümüne Gidin ve Ödeme Yönteminizi SeçinKredi/Banka Kartı: Visa veya Mastercard'ınızı kullanarak anında FRAX (FRAX) satın alın.Bakiye: Sorunsuz bir şekilde işlem yapmak için HTX hesap bakiyenizdeki fonları kullanın.Üçüncü Taraflar: Kullanımı kolaylaştırmak için Google Pay ve Apple Pay gibi popüler ödeme yöntemlerini ekledik.P2P: HTX'teki diğer kullanıcılarla doğrudan işlem yapın.Borsa Dışı (OTC): Yatırımcılar için kişiye özel hizmetler ve rekabetçi döviz kurları sunuyoruz.3. Adım: FRAX (FRAX) Varlıklarınızı SaklayınFRAX (FRAX) satın aldıktan sonra HTX hesabınızda saklayın. Alternatif olarak, blok zinciri transferi yoluyla başka bir yere gönderebilir veya diğer kripto para birimlerini takas etmek için kullanabilirsiniz.4. Adım: FRAX (FRAX) Varlıklarınızla İşlem YapınHTX'in spot piyasasında FRAX (FRAX) ile kolayca işlemler yapın.Hesabınıza erişin, işlem çiftinizi seçin, işlemlerinizi gerçekleştirin ve gerçek zamanlı olarak izleyin. Hem yeni başlayanlar hem de deneyimli yatırımcılar için kullanıcı dostu bir deneyim sunuyoruz.

269 Toplam GörüntülenmeYayınlanma 2026.03.03Güncellenme 2026.03.03

FRAX Nasıl Satın Alınır

MANTRA Nedir

I. Proje TanıtımıMANTRA, gerçek dünya düzenleyici gerekliliklerine uyum sağlama ve bunları uygulama yeteneğine sahip, güvenlik odaklı bir RWA Katman 1 Blok Zinciridir. Kurumlar ve Geliştiriciler için tasarlanmış olan MANTRA, izinli uygulamalar için izin gerektirmeyen bir Blok Zinciri sunmaktadır.Ana Özellikler: * Cosmos SDK kullanılarak inşa edilmiştir, IBC uyumlu, CosmWasm destekli * Egemen bir PoS doğrulayıcı seti ile güvence altına alınmıştır * 10k TPS'ye kadar ölçeklenebilir * Düzenleyici uyumlu RW'ları oluşturmak, ticaretini yapmak ve yönetmek için yerleşik Modüller, SDK'lar ve API'ler * Yerel olmayan kullanıcıları ve kurumları Web3'e entegre etmek için geliştirilmiş Kullanıcı Deneyimi.1) Temel Bilgilerİsim:MANTRA(OM)III. İlgili BağlantılarBeyaz Kağıt:https://docs.mantrachain.io/Resmi web sitesi:https://www.mantrachain.io/Keşif Araçları:https://mintscan.io/mantraSosyal Medya:https://x.com/MANTRA_ChainNot: Proje tanıtımı, resmi proje ekibi tarafından yayımlanan veya sağlanan materyallerden alınmıştır, yalnızca referans içindir ve yatırım tavsiyesi teşkil etmez. HTX, ortaya çıkan doğrudan veya dolaylı kayıplardan sorumluluk kabul etmez.

552 Toplam GörüntülenmeYayınlanma 2026.03.04Güncellenme 2026.03.04

MANTRA Nedir

MANTRA Nasıl Satın Alınır

HTX.com’a hoş geldiniz! Mantra (MANTRA) satın alma işlemlerini basit ve kullanışlı bir hâle getirdik. Adım adım açıkladığımız rehberimizi takip ederek kripto yolculuğunuza başlayın. 1. Adım: HTX Hesabınızı OluşturunHTX'te ücretsiz bir hesap açmak için e-posta adresinizi veya telefon numaranızı kullanın. Sorunsuzca kaydolun ve tüm özelliklerin kilidini açın. Hesabımı Aç2. Adım: Kripto Satın Al Bölümüne Gidin ve Ödeme Yönteminizi SeçinKredi/Banka Kartı: Visa veya Mastercard'ınızı kullanarak anında Mantra (MANTRA) satın alın.Bakiye: Sorunsuz bir şekilde işlem yapmak için HTX hesap bakiyenizdeki fonları kullanın.Üçüncü Taraflar: Kullanımı kolaylaştırmak için Google Pay ve Apple Pay gibi popüler ödeme yöntemlerini ekledik.P2P: HTX'teki diğer kullanıcılarla doğrudan işlem yapın.Borsa Dışı (OTC): Yatırımcılar için kişiye özel hizmetler ve rekabetçi döviz kurları sunuyoruz.3. Adım: Mantra (MANTRA) Varlıklarınızı SaklayınMantra (MANTRA) satın aldıktan sonra HTX hesabınızda saklayın. Alternatif olarak, blok zinciri transferi yoluyla başka bir yere gönderebilir veya diğer kripto para birimlerini takas etmek için kullanabilirsiniz.4. Adım: Mantra (MANTRA) Varlıklarınızla İşlem YapınHTX'in spot piyasasında Mantra (MANTRA) ile kolayca işlemler yapın.Hesabınıza erişin, işlem çiftinizi seçin, işlemlerinizi gerçekleştirin ve gerçek zamanlı olarak izleyin. Hem yeni başlayanlar hem de deneyimli yatırımcılar için kullanıcı dostu bir deneyim sunuyoruz.

237 Toplam GörüntülenmeYayınlanma 2026.03.04Güncellenme 2026.03.04

MANTRA Nasıl Satın Alınır

Tartışmalar

HTX Topluluğuna hoş geldiniz. Burada, en son platform gelişmeleri hakkında bilgi sahibi olabilir ve profesyonel piyasa görüşlerine erişebilirsiniz. Kullanıcıların A (A) fiyatı hakkındaki görüşleri aşağıda sunulmaktadır.

活动图片