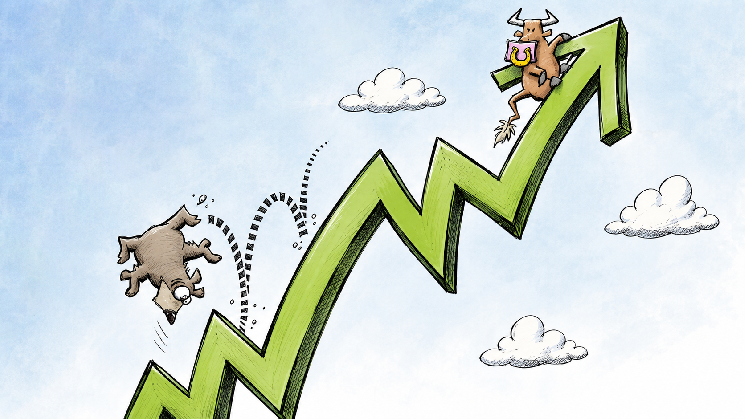
Bitcoin (BTC) Price Under Pressure: Is a Bearish Flag Flashing a Warning of a Slide to $70K?

TheNewsCrypto2025-12-09 tarihinde yayınlandı2025-12-09 tarihinde güncellendi

Within the bear hold, the largest asset in the crypto market, Bitcoin (BTC), is stuck in the downside waves, lighting up the red candlesticks. Multiple rejections have been faced back-to-back, and are currently trading below the $95K. As of today, with the fear sentiment, BTC has posted a modest loss of over 1.12%.

The price movement in the early hours caused the asset to hit a high of $92,220.86. Later, the bearish fluctuations triggered BTC to fall to its bottom range of $89,586.98. As per the CMC data, at the time of writing, Bitcoin traded at around the $90,511.42 zone.

Besides, the market cap of the asset is resting at $1.8 trillion, and its daily trading volume has dropped and reached the $55.88 billion. As reported by the Coinglass data, the market has witnessed a liquidation of $54.95 million worth of Bitcoin in the last 24 hours.

The Ali chart has exhibited that the current structure on Bitcoin’s chart is forming a bearish flag. The price consolidates upward within a tight channel after a sharp drop, but fails to break higher. If BTC breaks below the lower trendline, the pattern projects a downside target. In this case, around $70K, based on the height of the preceding drop.

Is Bitcoin Preparing for an Extended Bear Grip?

Both the Moving Average Convergence Divergence (MACD) line and the signal line are positioned below the zero line, which indicates Bitcoin’s broader bearish phase. The downside pressure will continue to dominate unless the lines rise back above the zero line.

In addition, the Chaikin Money Flow (CMF) indicator value found at 0.15 suggests moderate buying pressure in the BTC market. The money is flowing into the asset, not strongly, but it hints at a positive shift in demand and may support further upside.

The 4-hour trading session of Bitcoin shows bearish sentiment, with the price might slip to the key support at $90,472. Further correction on the downside could easily push for the death cross emergence, and the bears would send the price below the $90.3K mark.

Conversely, if the bulls appeared, the price could move up toward the $90,612 resistance range. A golden cross might take place with the strengthened upside pressure. Gradually, the bulls likely drive the BTC price to its recent high, above the $90.7K zone.

Bitcoin’s daily Relative Strength Index (RSI) is at 50.54, in the neutral zone — neither overbought nor oversold. With the balanced momentum, the price could swing in either direction. Moreover, BTC’s Bull Bear Power (BBP) of -31.33 signals that bears currently have control. The selling pressure is strong, pushing the price below, and the trend will lean more bearish unless momentum shifts.

Top Updated Crypto News

Zcash (ZEC) Rockets Up 14%: Is Crucial Resistance Lurking Ahead?

TagsBitcoinBTCBTC priceCryptocurrency

Trend Kriptolar

İlgili Okumalar

RWA Tokenization Enters the Next Phase: What is the Truly Time-Consuming Advantage to Build?

The article argues that as tokenization frameworks for Real-World Assets (RWA) mature, the ability to issue assets is becoming less of a competitive advantage. The focus is shifting to what happens *after* issuance: which RWA operations can build enduring trust, maintain stable operations, and remain integrated into the financial ecosystem over the long term. The piece introduces the concept of a **Reserve Layer**—infrastructure that connects tokenized assets to the necessary verification, liquidity, and operational systems for on-chain finance. For an asset to serve as a reliable reserve (e.g., short-term U.S. Treasuries, gold), it needs predictable value, standardized features, deep markets, and observable pricing. However, the true, hard-to-replicate advantage lies not just in the underlying asset but in the **operational track record** built over time. This includes consistent reserve management, independent audits, successful redemptions, maintained liquidity, and protocol integrations. Each successful operation adds evidence, creating a reinforcing cycle: more evidence builds stronger institutional confidence, leading to wider distribution, deeper liquidity, and more use cases as collateral. The article presents a framework combining two dimensions: an asset's suitability as a reserve and the issuer's operational capability. The most sustainable model combines **high-quality reserve assets with strong, long-term operational discipline**. A critical blind spot is an asset with high reserve suitability (like gold) issued by an entity with a limited operational track record; the quality of the infrastructure is separate from the quality of the asset itself. In conclusion, the next phase of RWA will be defined by participants who can pair appropriate reserve assets with the operational rigor to support them through market cycles, thereby transforming tokenized RWAs into durable financial infrastructure.

marsbit33 dk önce

RWA Tokenization Enters the Next Phase: What is the Truly Time-Consuming Advantage to Build?

marsbit33 dk önce

İşlemler

Spot

Popüler Makaleler

KR200 Nedir

KOSPI 200, Güney Kore'nin referans mavi çip endeksidir ve Kore Borsası'nda (KRX) işlem gören en büyük 200 büyük ölçekli, yüksek likiditeye sahip hisse senedini takip eder. Samsung ve SK Hynix gibi sektör liderlerini kapsar ve Kore hisse türevleri ile küresel kurumsal karşılaştırmalar için ana temel olarak hizmet eder.

36 Toplam GörüntülenmeYayınlanma 2026.08.19Güncellenme 2026.08.19

KR200 Nedir

KR200 Nasıl Satın Alınır

HTX.com’a hoş geldiniz! KOSPI 200 (KR200) satın alma işlemlerini basit ve kullanışlı bir hâle getirdik. Adım adım açıkladığımız rehberimizi takip ederek kripto yolculuğunuza başlayın. 1. Adım: HTX Hesabınızı OluşturunHTX'te ücretsiz bir hesap açmak için e-posta adresinizi veya telefon numaranızı kullanın. Sorunsuzca kaydolun ve tüm özelliklerin kilidini açın. Hesabımı Aç2. Adım: Kripto Satın Al Bölümüne Gidin ve Ödeme Yönteminizi SeçinKredi/Banka Kartı: Visa veya Mastercard'ınızı kullanarak anında KOSPI 200 (KR200) satın alın.Bakiye: Sorunsuz bir şekilde işlem yapmak için HTX hesap bakiyenizdeki fonları kullanın.Üçüncü Taraflar: Kullanımı kolaylaştırmak için Google Pay ve Apple Pay gibi popüler ödeme yöntemlerini ekledik.P2P: HTX'teki diğer kullanıcılarla doğrudan işlem yapın.Borsa Dışı (OTC): Yatırımcılar için kişiye özel hizmetler ve rekabetçi döviz kurları sunuyoruz.3. Adım: KOSPI 200 (KR200) Varlıklarınızı SaklayınKOSPI 200 (KR200) satın aldıktan sonra HTX hesabınızda saklayın. Alternatif olarak, blok zinciri transferi yoluyla başka bir yere gönderebilir veya diğer kripto para birimlerini takas etmek için kullanabilirsiniz.4. Adım: KOSPI 200 (KR200) Varlıklarınızla İşlem YapınHTX'in spot piyasasında KOSPI 200 (KR200) ile kolayca işlemler yapın.Hesabınıza erişin, işlem çiftinizi seçin, işlemlerinizi gerçekleştirin ve gerçek zamanlı olarak izleyin. Hem yeni başlayanlar hem de deneyimli yatırımcılar için kullanıcı dostu bir deneyim sunuyoruz.

37 Toplam GörüntülenmeYayınlanma 2026.08.19Güncellenme 2026.08.19

KR200 Nasıl Satın Alınır

SKDD Nedir

SK Hynix hisse senedinin günlük fiyat hareketlerinin -2 kat ters kaldıraçlı getirilerini sağlamak üzere tasarlanmış olan bu, GraniteShares altında tek günlük kısa kaldıraçlı bir ETF'dir. Taktiksel tahsis için SK Hynix üzerinde kısa vadeli bir düşüş beklentisi olan yatırımcılar için uygundur.

83 Toplam GörüntülenmeYayınlanma 2026.08.19Güncellenme 2026.08.19

SKDD Nedir

Tartışmalar

HTX Topluluğuna hoş geldiniz. Burada, en son platform gelişmeleri hakkında bilgi sahibi olabilir ve profesyonel piyasa görüşlerine erişebilirsiniz. Kullanıcıların A (A) fiyatı hakkındaki görüşleri aşağıda sunulmaktadır.

活动图片