A 25% Weekly Surge: Bitcoin Breaches $79,000 Amid Mass Short Liquidations

cryptonews.ru2026-08-21 tarihinde yayınlandı2026-08-21 tarihinde güncellendi

Özet

Bitcoin surged above $79,000 on August 21, marking a 25% weekly gain. The rally was fueled by massive short liquidations exceeding $1.2 billion in 24 hours, catching many bearish traders off guard. Analysts are monitoring key levels. The $70,000 zone is seen as crucial for maintaining the bullish trend, while $73,000-$74,000 is a significant resistance area. Breaking and holding above this zone could pave the way for moves toward $83,000. Several traders, including Crypto Candy and Roman, noted the rapid achievement of earlier targets ($70,700 and $75,000) and acknowledge the possibility of a short-term pullback, but the overall structure remains bullish. Daan Crypto Trades emphasized the importance of Bitcoin closing the weekly candle above the 200-period Exponential Moving Average (EMA) around the $73k-$74k range for increased confidence in a move toward May's highs. From a data perspective, comparisons are drawn to similar short-squeeze events in the past, like August of the previous year and summer 2021, where sharp rallies preceded significant corrections. Some analysis suggests such derivative-driven spikes may not always reflect genuine spot market demand, raising the question of whether the momentum will sustain or if a retest of the $73,000-$74,000 support is imminent.

Bitcoin climbed above $79,000 on August 21, with its gain for the week reaching 25%. This movement was accompanied by massive short position liquidations and became a topic of discussion among several analysts and traders on the social network X.
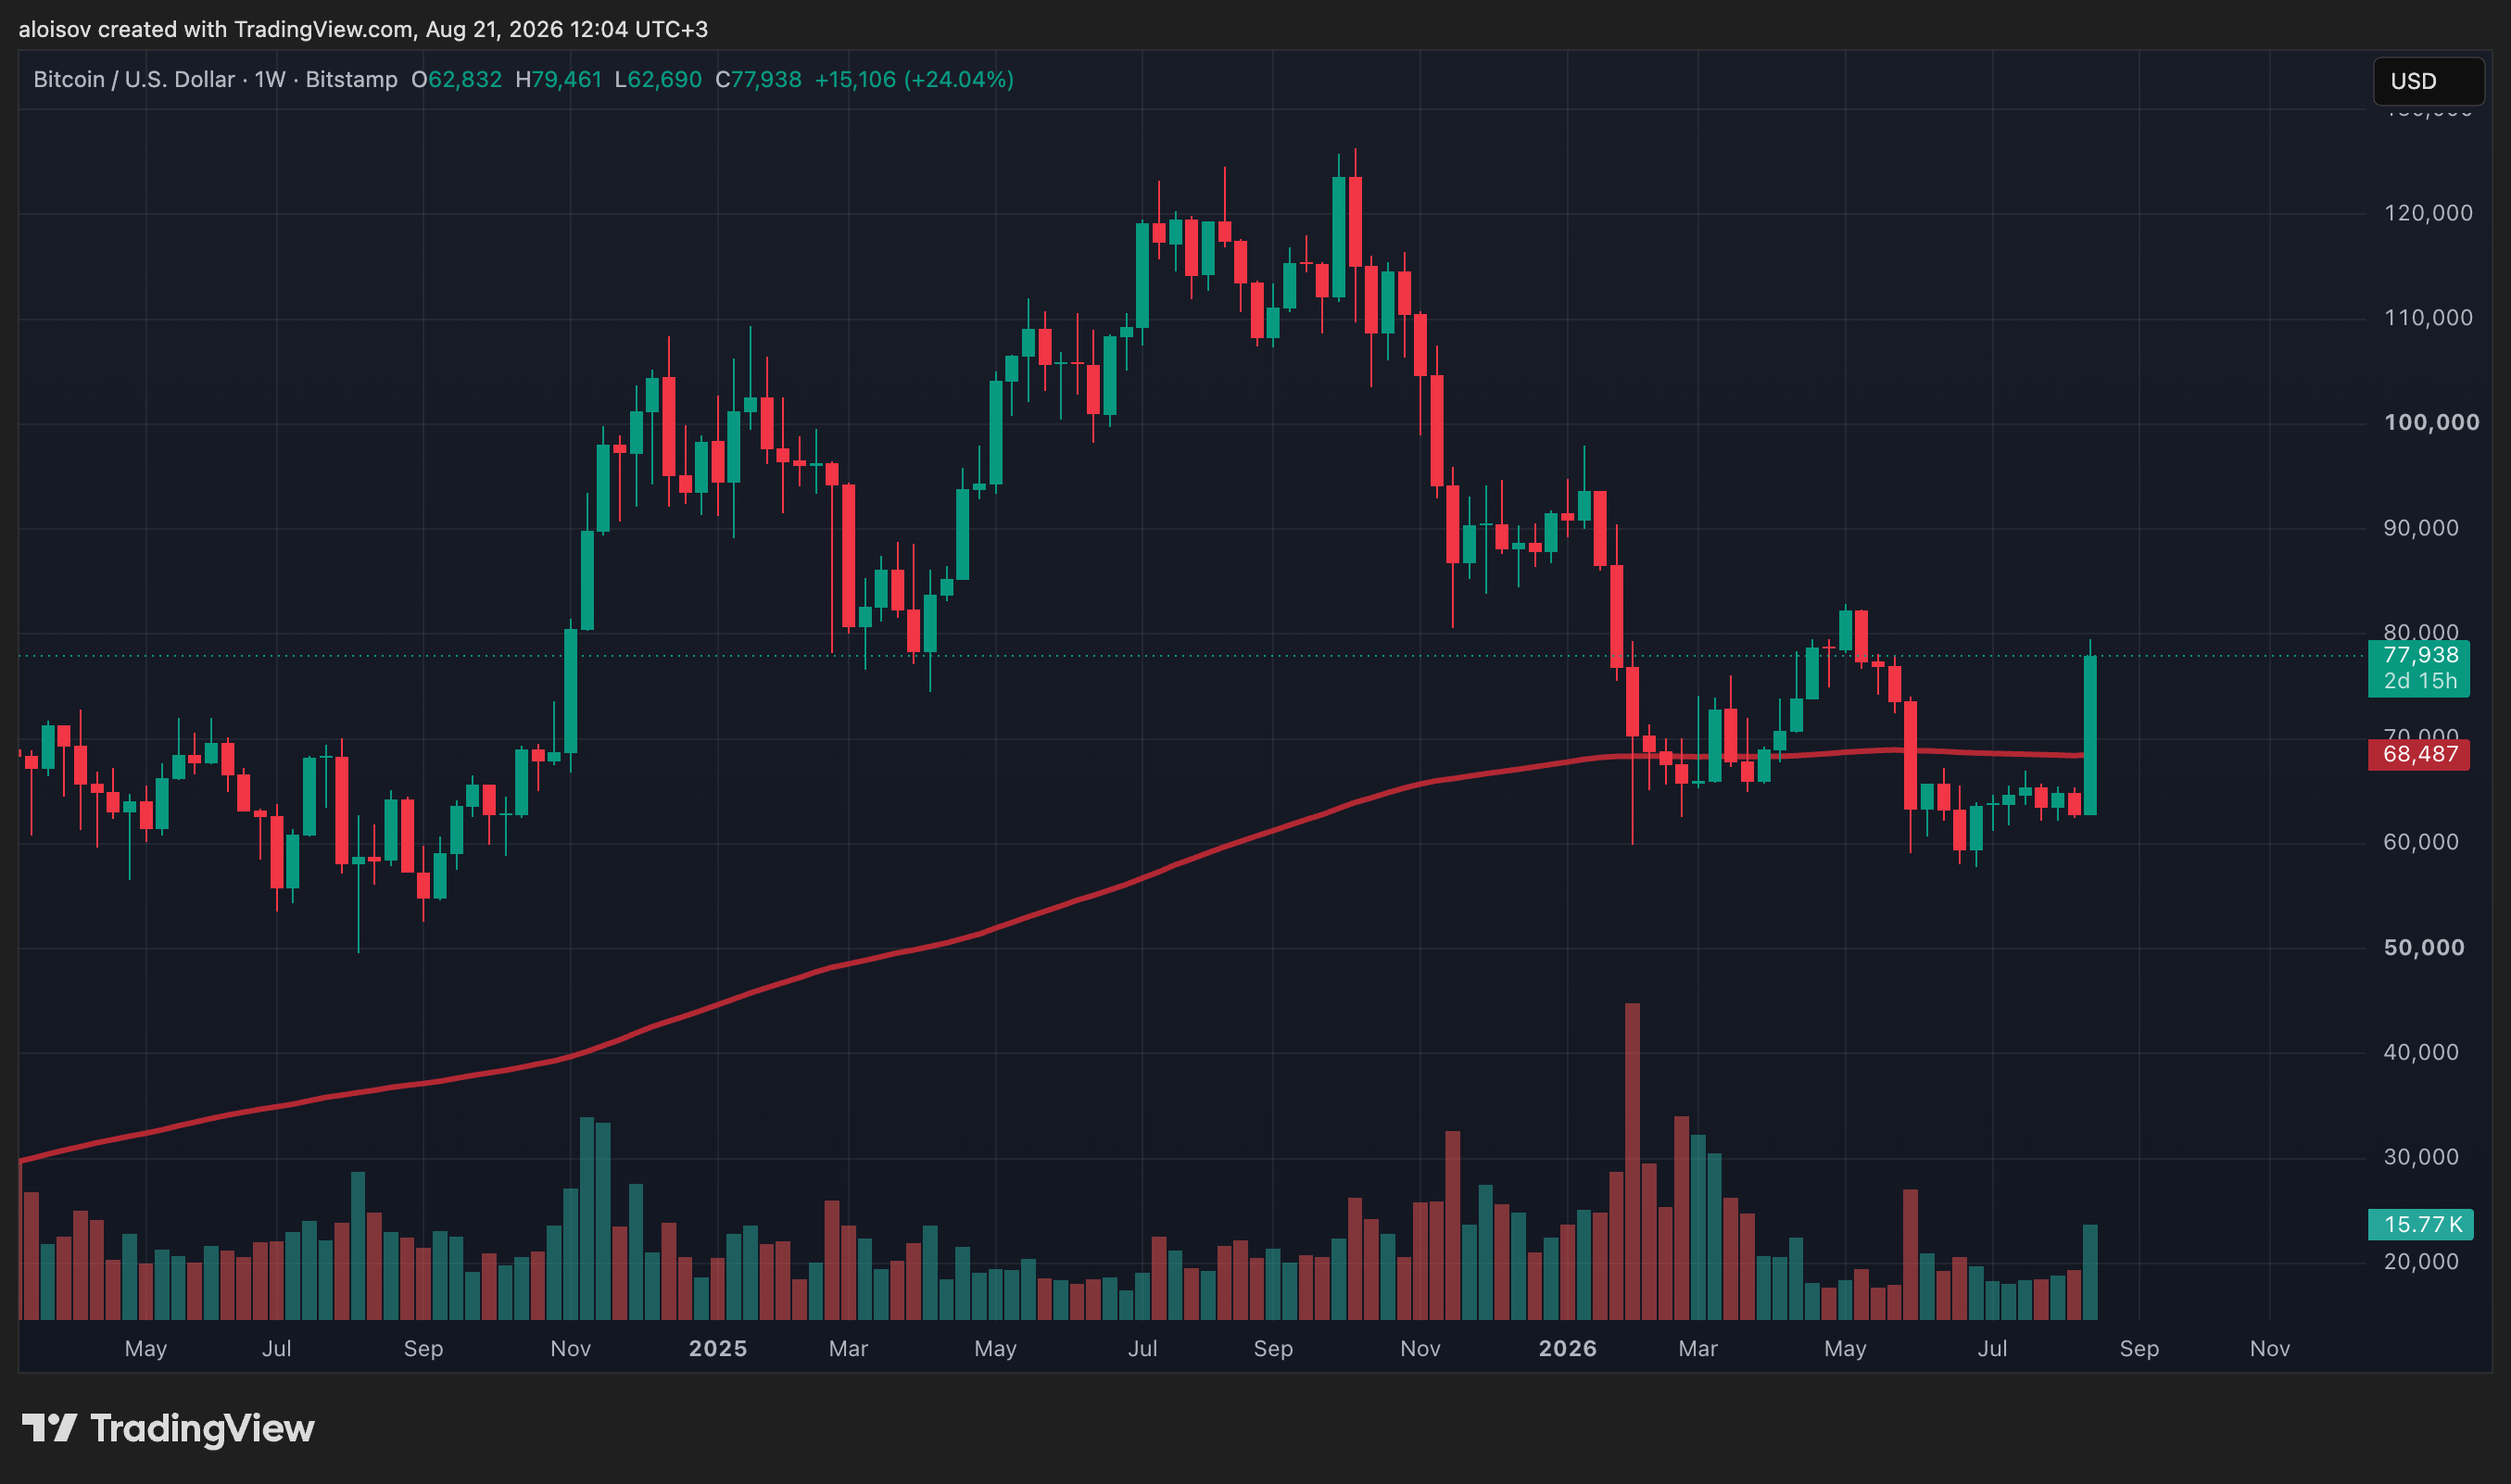
1-week chart of $BTC/USD and the 200EMA. Source: Bitstamp

Short Liquidations Amid the Rally

Crypto YouTuber Crypto Rover drew attention to the volume of forcibly closed positions: according to CoinGlass, over $1.2 billion worth of short positions were liquidated in the last 24 hours. He characterized the candles on Bitcoin's chart as extremely aggressive towards bears—the sharp upward move caught those betting on a price decline off guard.

Technical Targets and a Possible Correction

Trader and investor Crypto Candy noted that after breaking out of the consolidation zone, Bitcoin quickly reached both previously identified targets—$70,700 and $75,000—within a single day. In his assessment, a short-term pullback is possible, but if the current momentum persists, moves towards $77,000 and then $83,000 are not out of the question. He stated this scenario remains relevant as long as the price holds above the $70,000 level.
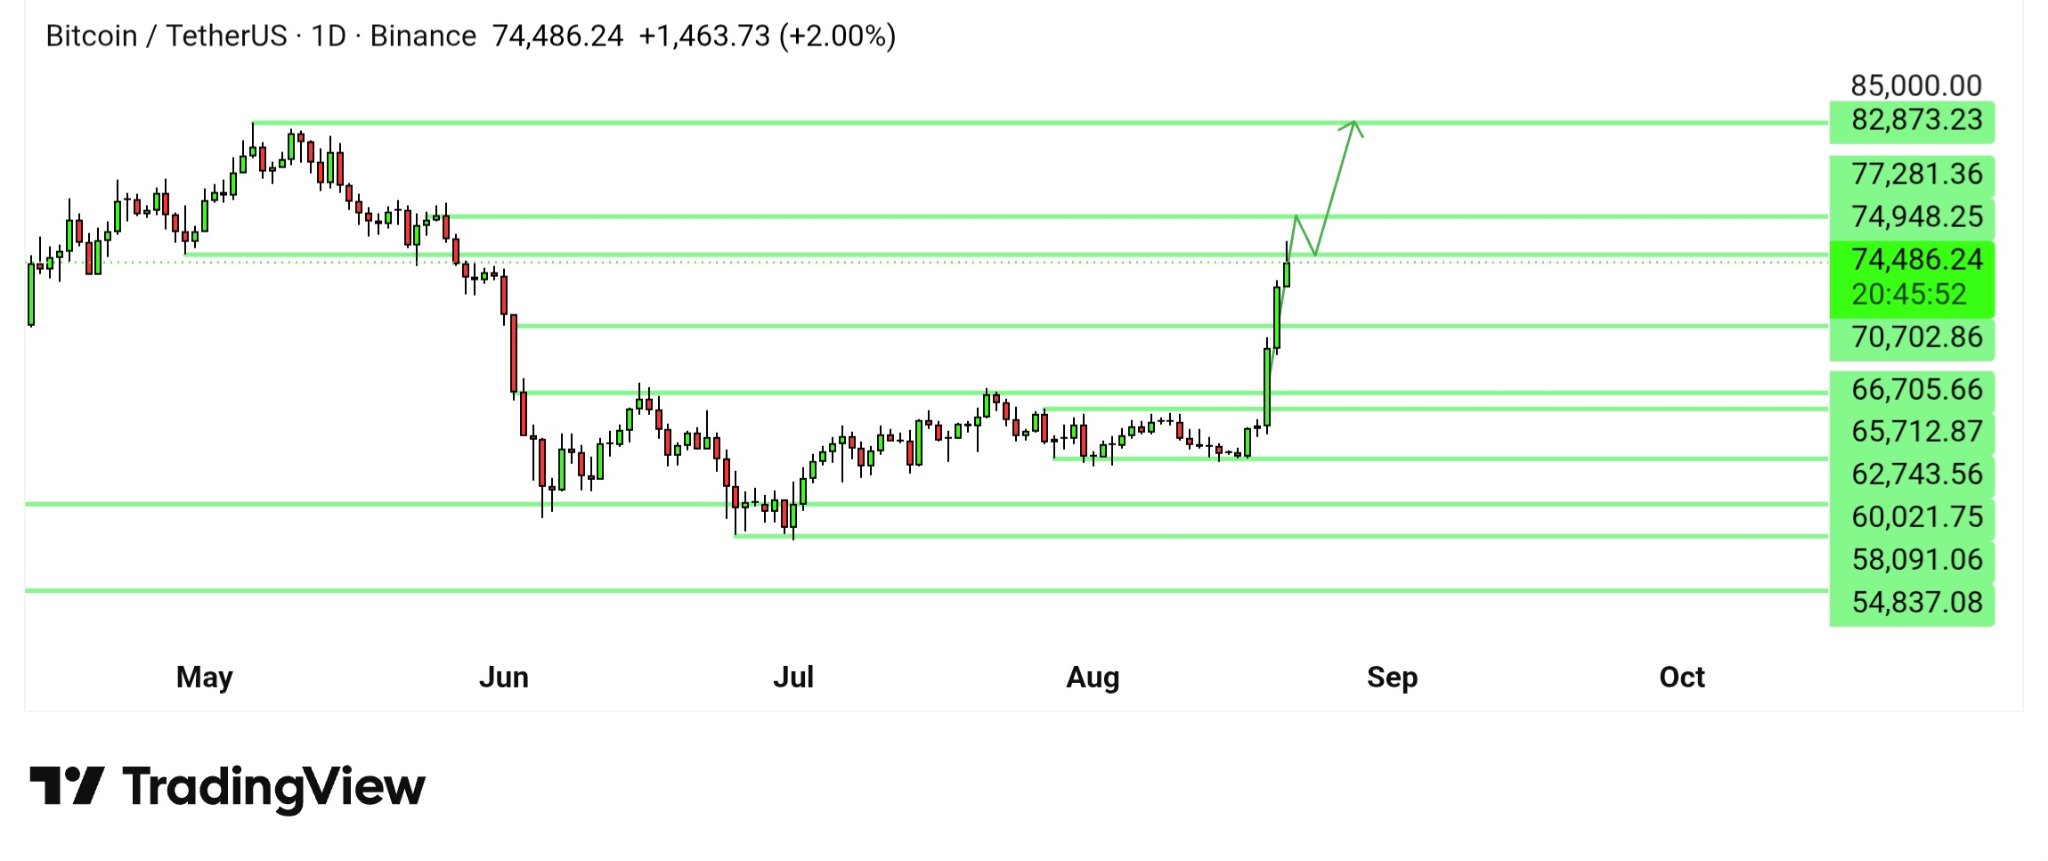
1-day chart of $BTC/USD. Analysis: Crypto Candy

Trader Roman shares a similar view. He reminded that as early as August 19, during a live broadcast, he spoke about the potential for a move to $75,000 in the coming days—a prediction that has now materialized. His assessment was based on a bullish deviation, a divergence indicator reversal, and the overall price action structure. According to him, a sustained uptrend has been observed for over ten months, and a small pullback at current levels is not ruled out.
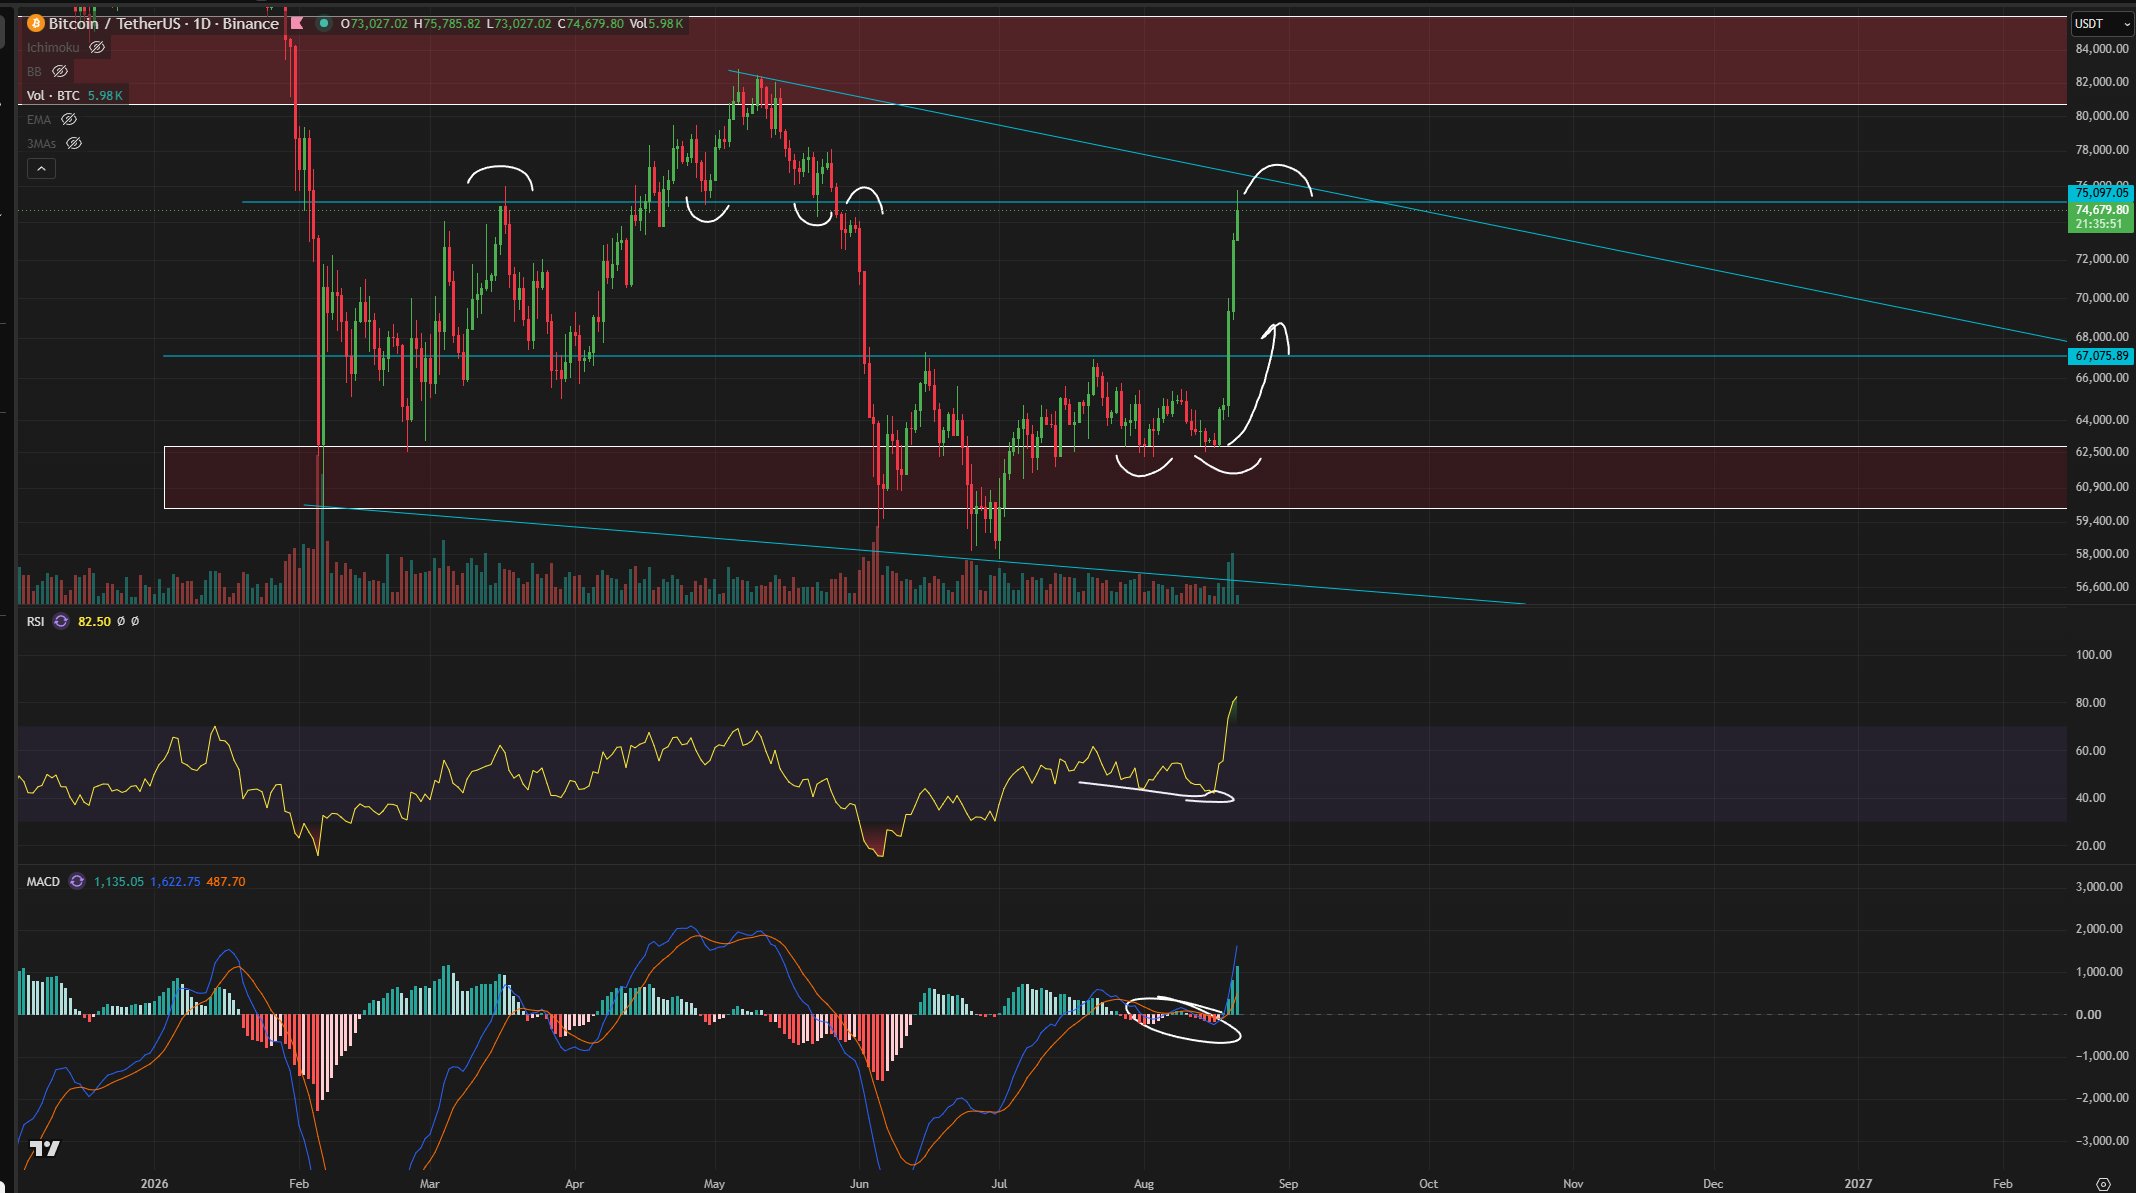
1-day chart of $BTC/USD. Analysis: Roman

Weekly Candle and Moving Averages

Trader Daan Crypto Trades noted Bitcoin's attempt to establish itself above the bull market support band and the weekly 200-period Exponential Moving Average (EMA). He emphasized the significance of the horizontal $73,000–$74,000 level: a sustained move above this zone, in his opinion, would increase confidence in a move towards the May highs. At the same time, he suggested waiting for the close of the current weekly candle at or above the reached levels—this alone would already be a positive signal.
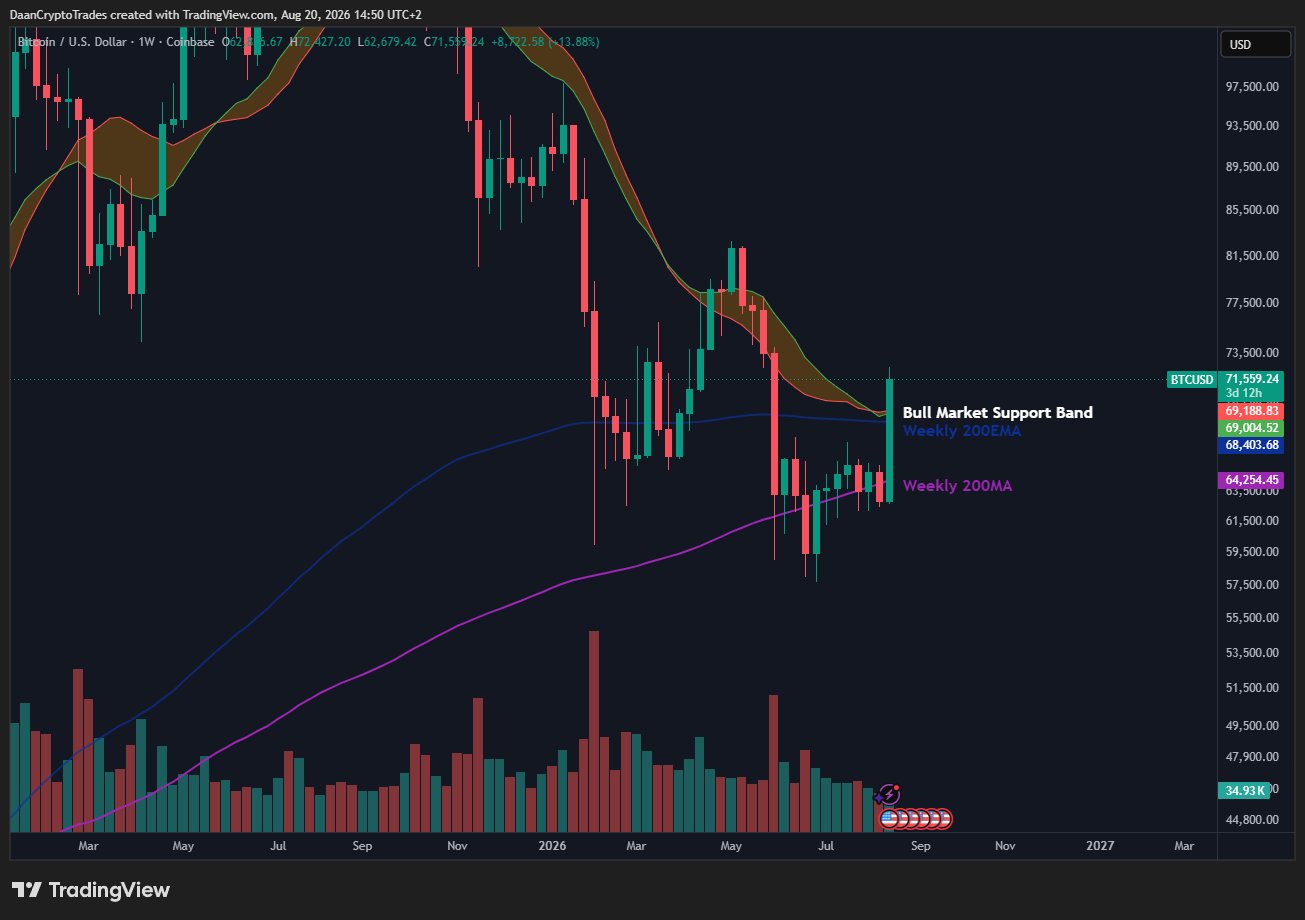
1-week chart of $BTC/USD. Analysis: Daan Crypto Trades

Key Levels

  • $70,000 — The level above which analysts believe the bullish scenario remains intact.

  • $73,000–$74,000 — The horizontal resistance level highlighted by Daan Crypto Trades.

  • $79,000 — The level reached on August 21.

  • $83,000 — The next potential target according to Crypto Candy's assessment.

Thus, several traders agree that the key reference point for further movement remains the $73,000–$74,000 zone, while further targets along the current trend lie in the $80,000–$83,000 range.

Analysts also acknowledge the possibility of a short-term correction following such a sharp move, while noting that the overall chart structure—from the weekly close above the 200 EMA to the bullish divergence—continues to point to the persistence of the uptrend.

AI Perspective

From the perspective of machine data analysis, Bitcoin's current jump to $79,000 resembles the structure of events from a year ago. The asset already broke through the $70,000 mark on a wave of a similar short squeeze on August 20, and a parallel with the summer of 2021 shows that short liquidations then also exceeded $1 billion per day, after which the price corrected by almost 20% from the local peak. Such episodes often turn out to be temporary impulses rather than definitive trend reversals.

A technical aspect that remained unaddressed in the article is the derivative nature of such rallies. Analysts at Hash Telegraph have previously noted that sharp spikes amid mass liquidations often reflect the effect of cascading position closures rather than a genuine breakout driven by spot market demand. Will the current momentum persist after the weekly candle closes, or will the market return to test the $73,000–$74,000 zone?

end-content

İlgili Sorular

QWhat was the main reason behind Bitcoin's surge above $79,000 on August 21st, according to the article?

AAccording to the article, Bitcoin's surge above $79,000 was accompanied by a large-scale liquidation of short positions. Analysts cited massive forced closures of bearish bets as a key driver behind the sharp price increase.

QWhich key price levels do analysts believe are crucial for Bitcoin's bullish scenario to remain valid?

AAnalysts believe that staying above the $70,000 level is crucial for the bullish scenario to remain valid. The horizontal resistance zone of $73,000–$74,000 is also noted as a critical area to hold for confidence in a move towards all-time highs.

QWhat potential future price targets for Bitcoin did analyst Crypto Candy mention?

AAnalyst Crypto Candy mentioned that if the current momentum is maintained, Bitcoin could move towards $77,000 and then potentially reach $83,000 as the next target.

QWhat cautionary perspective or potential risk does the article's 'AI Opinion' section raise about the current rally?

AThe 'AI Opinion' section raises caution by comparing the current surge to past events, noting that similar short squeezes have often resulted in temporary price spikes followed by significant corrections. It suggests that sharp rallies driven by mass liquidations might reflect a cascade effect in derivatives rather than genuine spot market demand, hinting at a potential pullback.

QWhat technical indicator on the weekly chart did trader Daan Crypto Trades emphasize as significant for Bitcoin's trend?

ATrader Daan Crypto Trades emphasized the significance of Bitcoin attempting to hold above the weekly 200-period Exponential Moving Average (EMA). He suggested waiting for the weekly candle to close at or above current levels for a more confident bullish signal.

İlgili Okumalar

After 'Bessent Put', How Far Is the U.S. from Restarting QE?

Following an unscheduled announcement from the U.S. Treasury Department on August 19th, investor discussions have intensified regarding the potential for future policy interventions in long-term bond markets. The Treasury increased the maximum size of its regular buyback operations for 10-to-30 year bonds from $2 billion to $4 billion, citing a desire to improve liquidity. This move came shortly after a surge in long-term yields, with the 30-year Treasury yield briefly touching 5.34%. Market analysts, rather than focusing on the modest operational size, have interpreted the timing—outside the normal quarterly communication window—as a significant signal. The move has been dubbed the "Bessent Put," implying the market's growing expectation that Treasury officials, led by Deputy Secretary Josh Bessent, may act to prevent a disorderly rise in long-term borrowing costs. This perception represents a potential shift in the market's view of the government's "policy reaction function." The underlying pressures on long-term bonds are multifaceted, including large fiscal deficits, increased Treasury supply, a rise in corporate debt issuance for AI infrastructure (creating a "crowding out" effect), and uncertainty around foreign holdings, particularly from Japan. Geopolitical risks in the Middle East further complicate the policy landscape, potentially creating conflicting pressures between fighting inflation and managing financing costs. However, the article clarifies that this Treasury buyback program is distinct from Quantitative Easing (QE). It is a debt management operation, not a Federal Reserve balance sheet expansion. While the announcement opens the door for market speculation about more forceful tools like Yield Curve Control (YCC) or a return to QE, analysts note that conditions would need to deteriorate significantly for such measures to be implemented. For now, the "Bessent Put" reflects a change in market expectations about possible policy boundaries, not an imminent launch of new monetary stimulus.

marsbitŞimdi

After 'Bessent Put', How Far Is the U.S. from Restarting QE?

marsbitŞimdi

Is Stablecoin Really Necessary for Cross-border Payments?

"Is Stablecoin Truly Necessary for Cross-Border Payments? While stablecoins are often praised as superior for cross-border transfers—especially if the recipient desires crypto—their advantage is less clear in traditional cross-currency scenarios (e.g., USD to Mexican Peso). The existing correspondent banking system is slow and costly (≈15% fees) due to multiple intermediaries. Modern fintech solutions like Wise have dramatically improved this by using a netting model: they hold local currency pools and settle payments domestically, avoiding actual cross-border fund movement. This offers near-instant transfers with low, transparent fees (averaging ~0.52%). The 'stablecoin sandwich' model (convert fiat to stablecoin, transfer on-chain, convert to local fiat) offers similar user experience but doesn't inherently provide major cost or speed advantages over fintech. Its on-chain transfer is cheap, but fiat conversion spreads remain. Stablecoin's real innovation is 'unbundling' the cross-border payment stack. Instead of requiring a proprietary global network like Wise, businesses only need reliable on- and off-ramps in specific corridors. This lowers market entry barriers, fosters competition among local providers, and can drive down costs, particularly for niche or underserved corridors (e.g., US to Africa). While vertical integration may reoccur, the open, permissionless nature of the underlying blockchain layer makes monopolistic pricing difficult. The long-term benefit is the potential redistribution of value—previously captured as intermediary rents—to consumers through lower costs."

marsbit4 dk önce

Is Stablecoin Really Necessary for Cross-border Payments?

marsbit4 dk önce

Ethereum Finally 'Bounces Back'! ETH Returns to the Golden Line, What's Different About This Rally?

Ethereum has surged above $2,300, a level not seen in over three months, marking a significant recovery and technical breakthrough by reclaiming key resistance levels, including the weekly EMA50 for the first time in the current bear market. The rally has been fueled by a combination of factors: improved market risk appetite, positive regulatory sentiment, and a major short squeeze where over 88% of recent ETH liquidations were short positions. The ETH/BTC ratio has also broken its long-term downtrend, indicating renewed strength for Ethereum relative to Bitcoin. Fundamentally, Ethereum spot ETFs have shown strong inflows, outperforming their Bitcoin counterparts in recent months. Wall Street institutions like Morgan Stanley and JPMorgan have notably increased their ETH exposure, while several banks have added or expanded positions in ETH ETFs. On-chain fundamentals remain robust, with the proportion of staked ETH reaching a new all-time high of nearly 33.7%. Data indicates long-term holding sentiment, as small wallet holdings increased while large outflows were often directed towards staking or contracts, not selling. However, potential headwinds include declining staking yields and community debate over proposals to adjust staking rewards at high participation levels. The upcoming Glamsterdam upgrade, featuring improvements to validator exit efficiency, could enhance liquidity and further attract institutional stakers. While the rebound is supported by sentiment, capital flows, and fundamentals, its sustainability hinges on continued positive developments.

marsbit5 dk önce

Ethereum Finally 'Bounces Back'! ETH Returns to the Golden Line, What's Different About This Rally?

marsbit5 dk önce

İşlemler

Spot
活动图片