1. BTC concussion drops
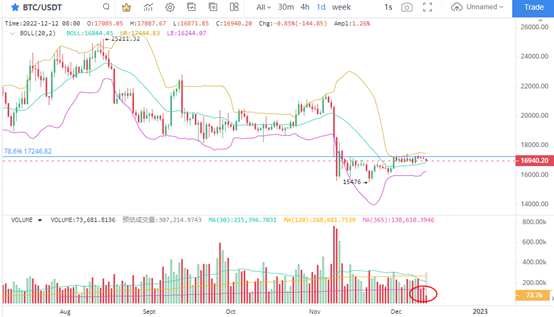
In the daily K line chart of BTC, the price trend is relatively stable, and BTC runs above the middle track of Bollinger Line. The short-term closure of Bollinger Line indicates that BTC is about to confirm the direction of breakthrough. During this period, the trading volume has continued to shrink. The shrinking trading volume on December 10 and December 11 suggests that the market is not performing well and there is still a risk of decline.
2. Escape of long-term investors
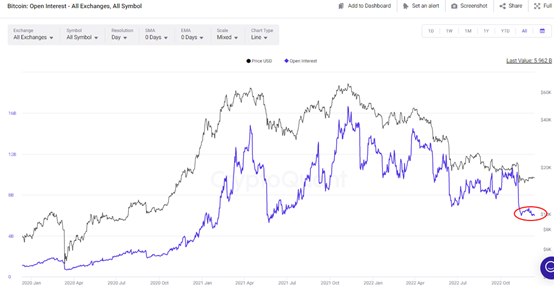
The number of BTC and contract positions remained low. At present, the contract position on December 12 fell to 5.96 billion US dollars, the lowest in a year. Contract investors are obviously bearish on the market at present, which means that BTC still maintains a light trading state in the near future, indicating that trading opportunities are limited.
3. LTC shrinkage consolidation
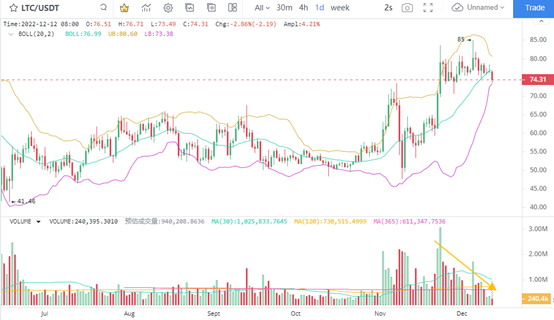
LTC is the main force of the recent rebound of the mainstream currency. The daily K line chart shows that there has been obvious signs of weakness, and the trading volume has shrunk to a very low level. At present, the daily trading volume of the K-line is only equivalent to the level before October 24, so it is difficult to support the price to continue to rise. Correspondingly, BTC shrinkage has also reached a recent low,
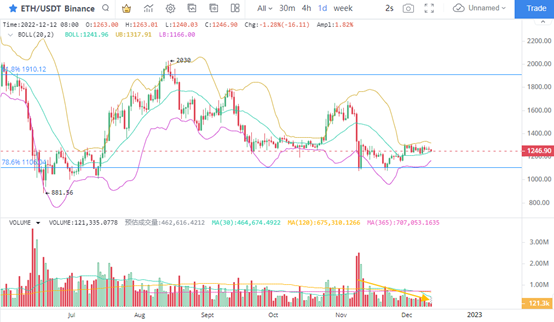
4. The trading volume of ETH shrinks more obviously
The peak value of ETH's highest trading volume appeared on June 13 and November 9, when the price fell sharply, which boosted the enthusiasm of investors for trading. At present, ETH trading volume continues to shrink, and there is still no sign of the end. The trading volume from December 2021 to January 2022 is very similar to that on December 10 and December 11, 2022, both at the lowest level. However, after January 2022, the ETH price continued to retreat significantly, continuing the price decline. After the trading volume is reduced to a low level, pay attention to the expectation of price changes.