Seasoned Holders Taking Profit

insights.glassnode2025-06-04 tarihinde yayınlandı2025-06-19 tarihinde güncellendi

Bitcoin hit a new ATH of $111.8k before retracing, as profit-taking by long-term holders began to weigh on momentum. With key support at $103.7k and $95.6k, and signs of older investors offloading, the bulls now face a critical test of their resolve.

Executive Summary

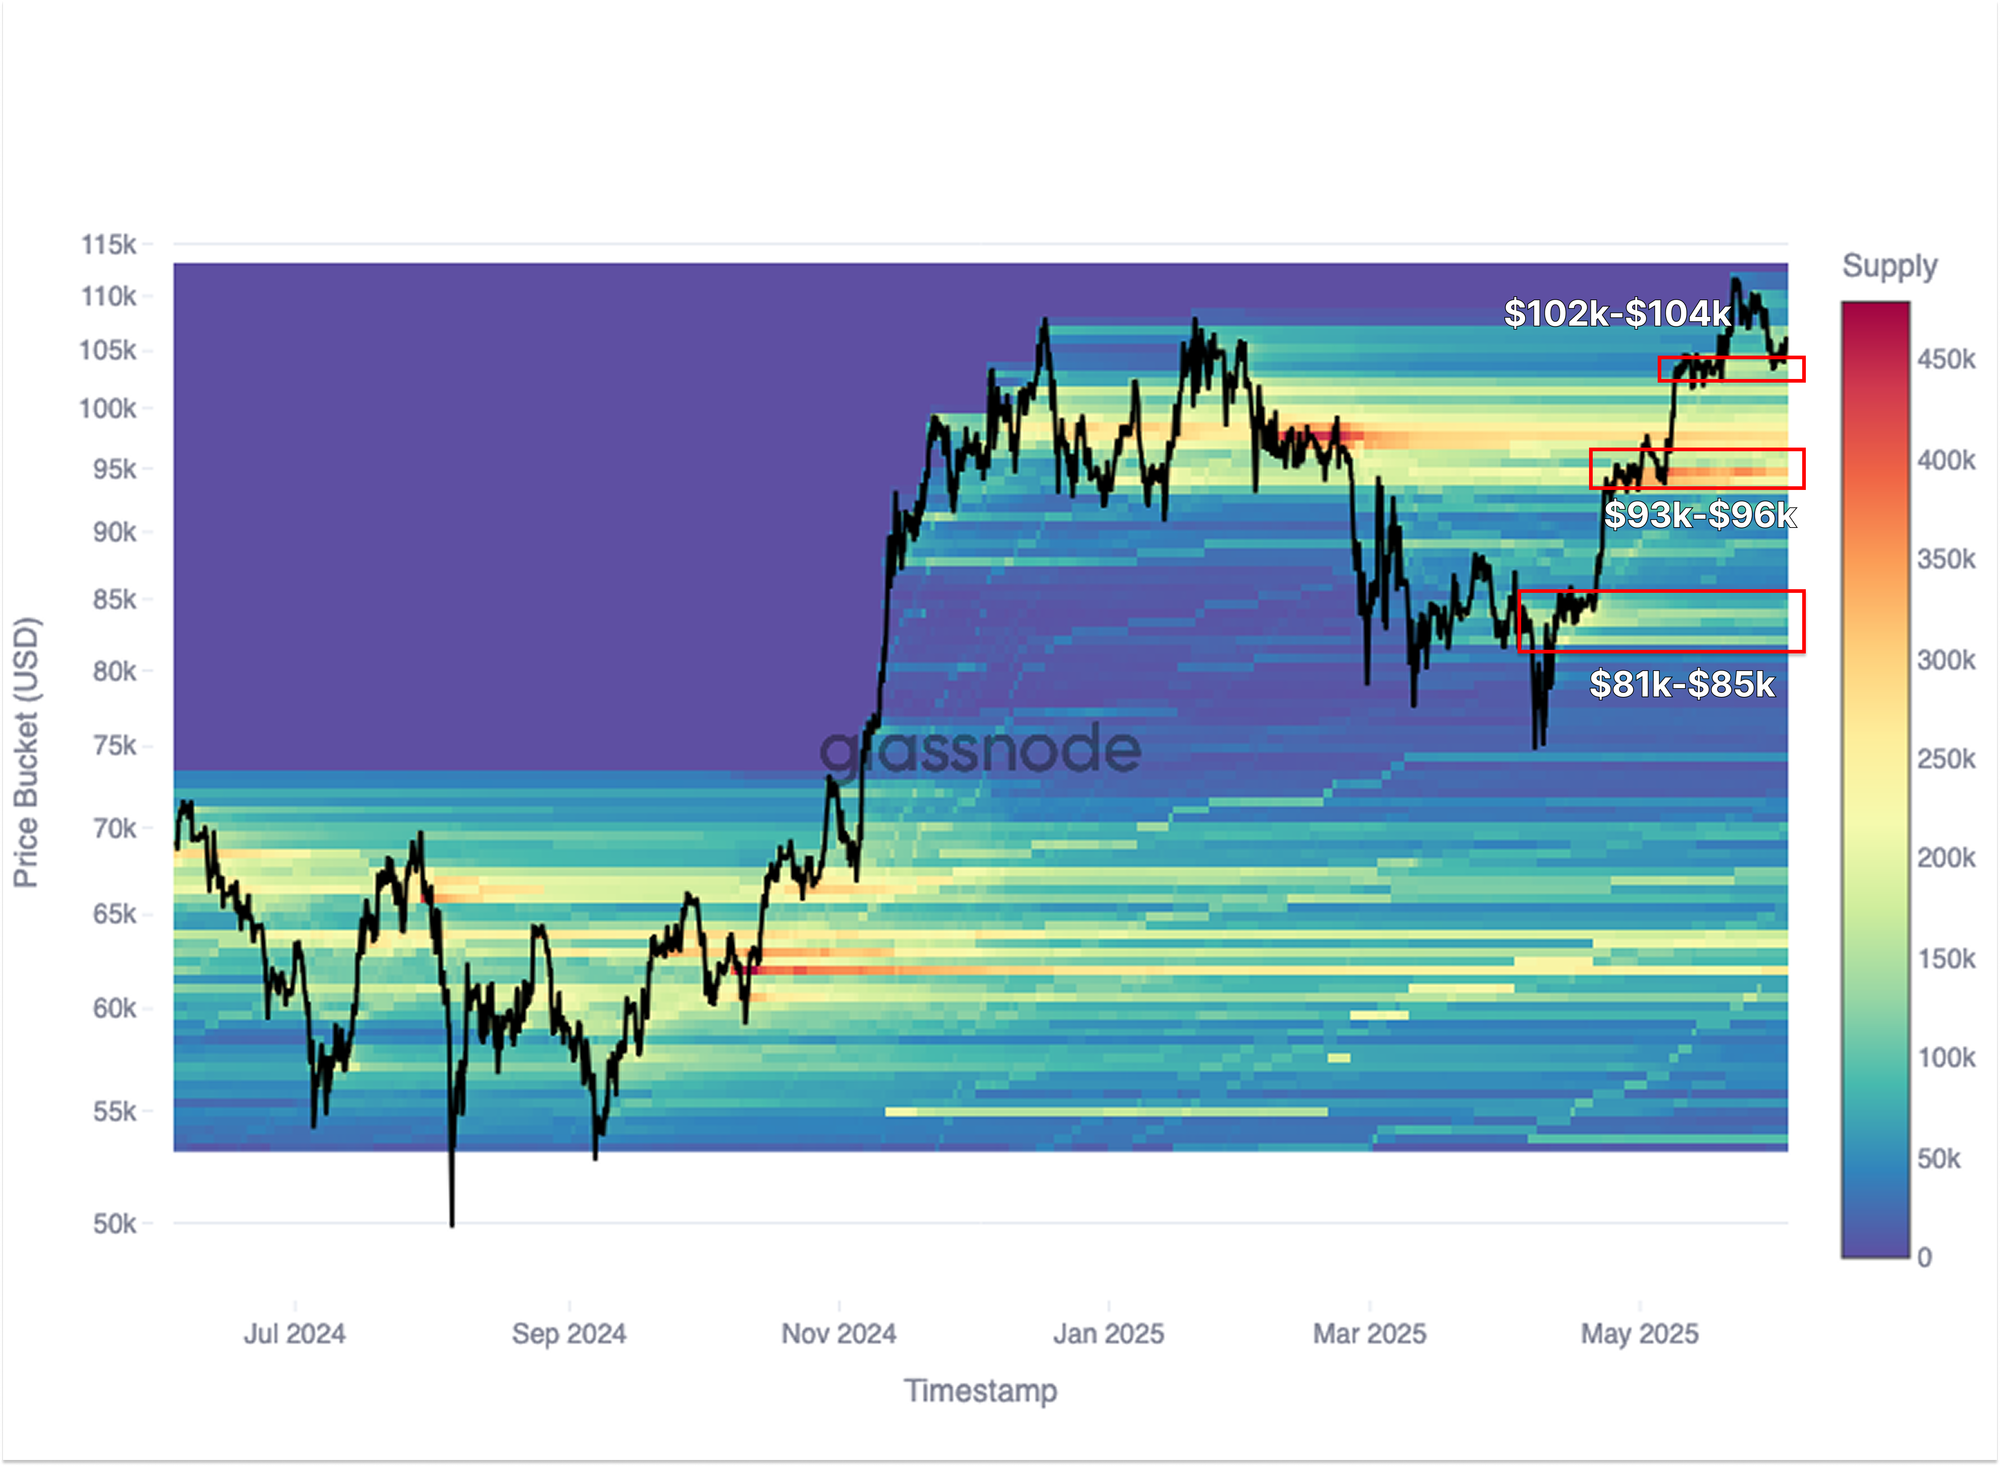
  • BTC reached a new all-time high at $111.8k, but quickly retraced to $103.2k. The initial rally appears to be spot-driven, with major accumulation zones at $81–85k, $93–96k, and $102–104k now acting as potential support.
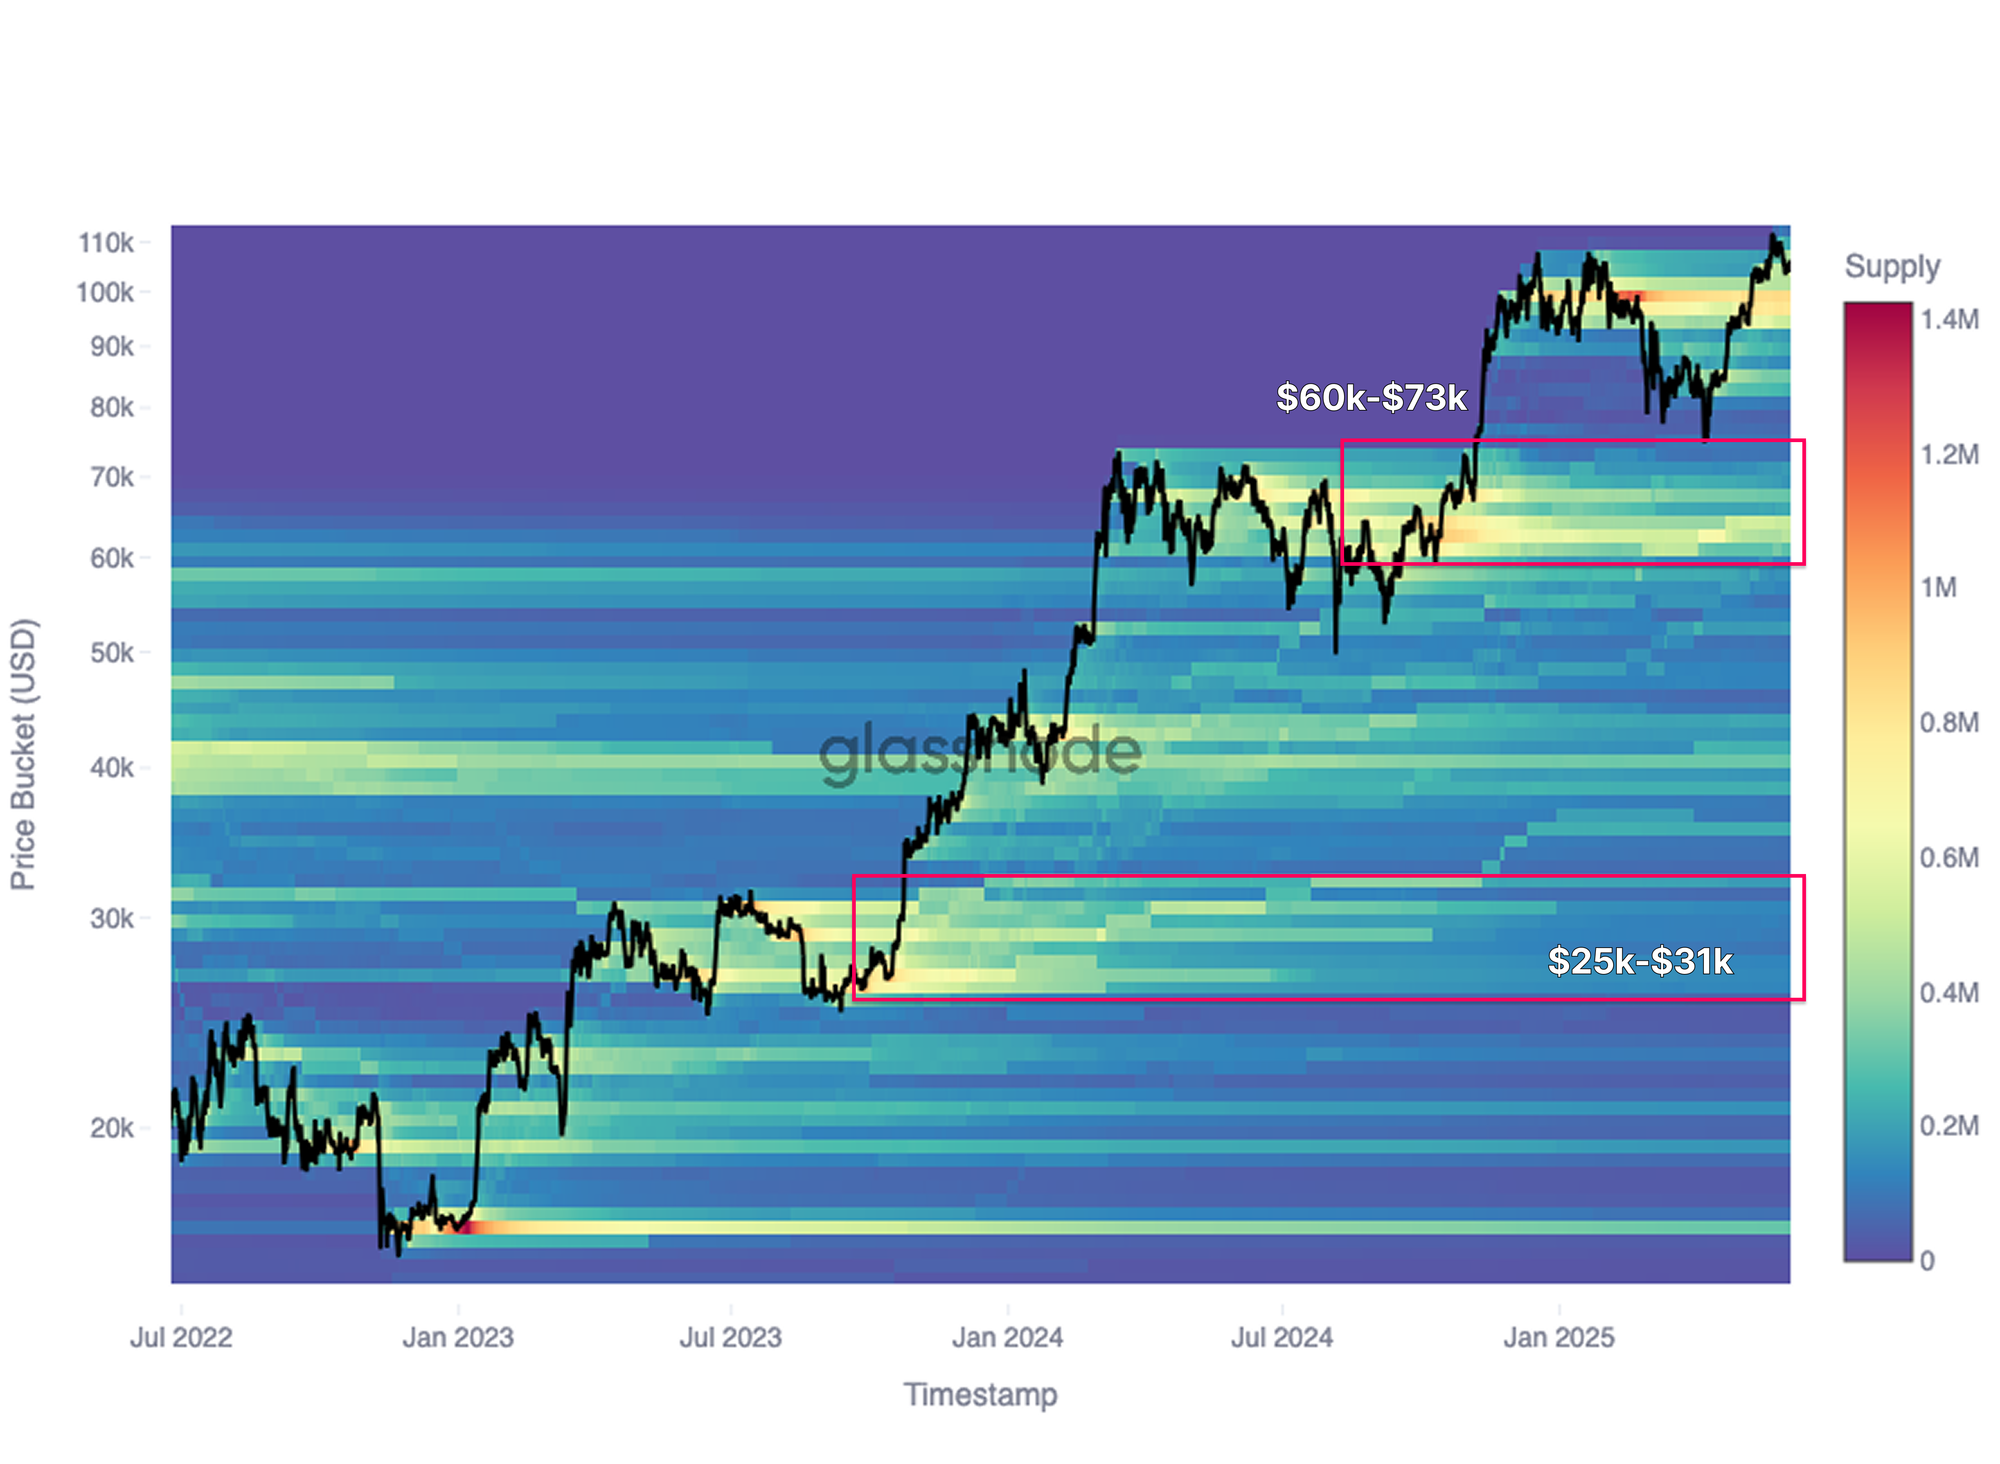
  • Zooming out with the CBD Heatmap, many historical accumulation zones flipped into distribution zones. Sellers from $25k–31k, $38k–44k, and $60k–73k ranges are now weighing on price action.
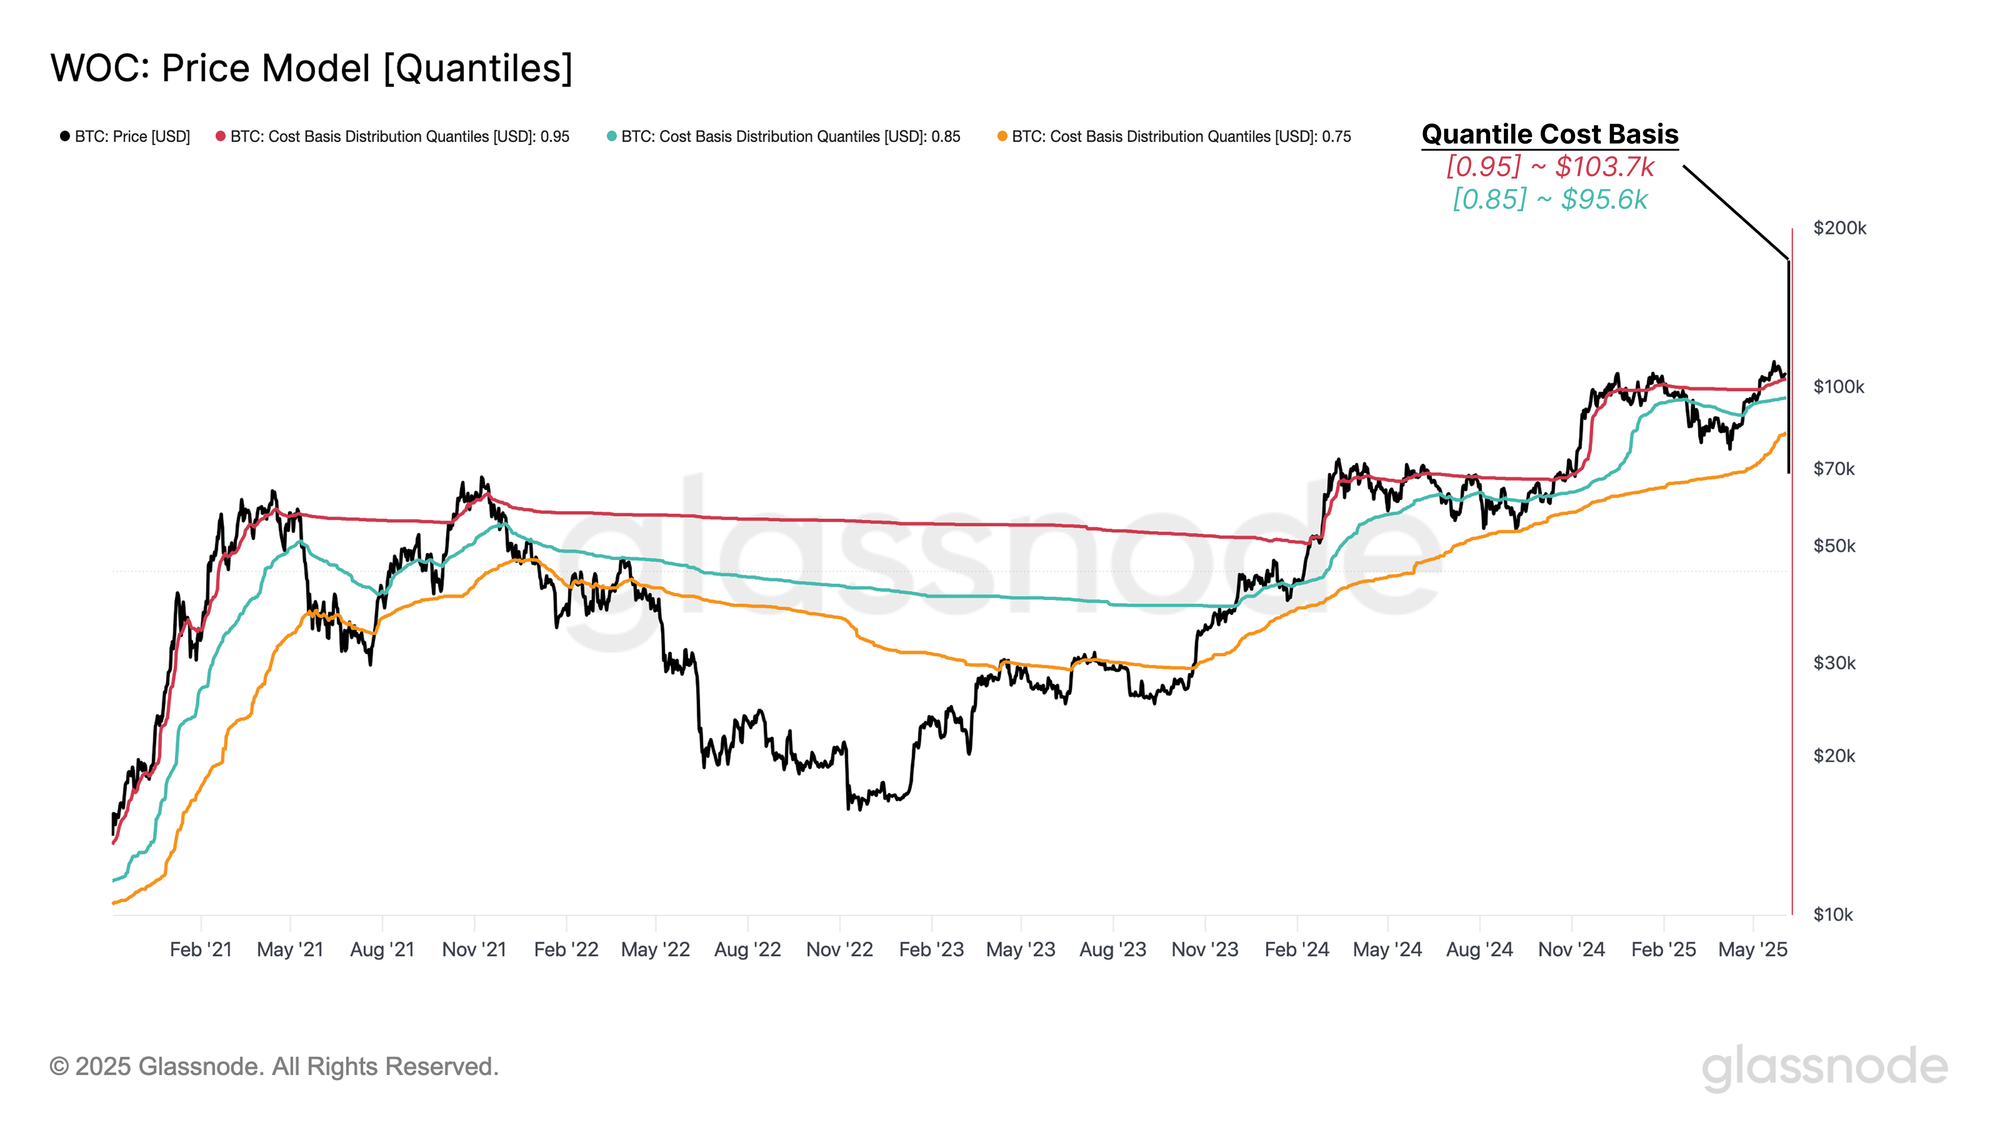
  • Cost basis quantiles and short-term holder bands place immediate support near $103.7k and $95.6k, with resistance at $114.8k. These levels are statistically significant markers of broader sentiment shifts.
  • Realized profits spiked to $1.47B/day, marking the fifth major profit-taking wave in this cycle. Selling was led by long-term holders, not short-term traders.
  • Cohorts holding for >12 months dominated the recent realized profits, reflecting mature capital rotation. This aligns with earlier observations from the CBD Heatmap, confirming that seasoned investors are shaping the current top formation phase.
💡
View all charts in this edition in The Week On-chain Dashboard.

Mapping the Rungs of the Rally

Over the past two weeks, Bitcoin extended its rally to a new high of $111.8k, briefly surpassing the previous ATH set in January 2025. However, this move was followed by a correction to $103.2k, signalling a potential pause in bullish momentum.

To understand the anatomy of this rally, we turn to the Cumulative Volume Delta (CBD) Heatmap, a tool that tracks the net difference between aggressive buying and selling across price levels. Visually, it reveals zones of concentrated spot-driven accumulation or distribution, helping pinpoint where demand was strongest.

From the heatmap, it's evident this rally was largely spot-led and stair-stepped higher, with clear accumulation clusters at $81–85k, $93–96k, and $102–104k. These zones now potentially can serve as supply-dense regions that may act as short-term support, depending on broader market sentiment.

Notably, top buyers from Q1 2025, who held through the drawdown below $80k, are once again being tested as price churns sideways. This edition will examine the fading momentum behind recent demand, the forces draining market strength, and where potential support may emerge if weakness continues.
Live Dashboard

Old Hands Sell Pressure

To understand the forces driving Bitcoin’s recent move beyond $111k, we need to take a broader view of the market structure. By examining the CBD Heatmap from the June 2022 cycle bottom onward, a clear pattern of distribution by past accumulators begins to emerge.

As the price marched upward, the supply-dense zones that previously acted as bases of accumulation, often marked by sideways consolidation, have now turned into active selling zones. Visually, the heatmap reveals a gradual shift; areas that once supported the rally have flipped into sources of resistance, as earlier holders take the opportunity to offload.

The most notable selling pressure has come from cohorts who accumulated during key historical ranges: $25k–31k and $60k–73k. These groups, many of whom held through multiple volatility phases, are now contributing to the supply overhang that appears to be capping further upside, at least in the short term.
Live Dashboard

With long-term holders gradually applying sell pressure, the probability of a short-term correction continues to build, particularly in the absence of a strong upside catalyst to push Bitcoin decisively above $111.8k. In such phases, where bullish momentum stalls, on-chain pricing models become essential tools for identifying likely support levels during pullbacks.

One particularly effective framework is the Spent Supply Distribution (SSD) Quantiles. This metric analyzes the cost basis of coins being spent at a given time, dividing them into 100 percentiles. It provides a high-resolution view of where supply originally entered the market, enabling us to pinpoint zones with elevated turnover, likely driven by profit-taking or loss realization.

Here, we focus on three key quantiles:

  • 🔴 0.95 (top 5% of spent supply)
  • 🔵 0.85 (top 15%)
  • 🟠 0.75 (top 25%)

Historical patterns over the past five years suggest that absolute euphoria tends to occur when price trades above the 0.95 quantile, while sideways bull phases often unfold between 0.85 and 0.95. On the other hand, sustained trading below the 0.75 quantile has typically marked bearish or risk-off periods.

At present, the 0.95 quantile sits at ~$103.7k, acting as the first on-chain support zone. Should selling pressure persist, the next level to watch is the 0.85 quantile at $95.6k, which may provide structural support, or, if breached, confirm a broader risk reset.
Live Chart

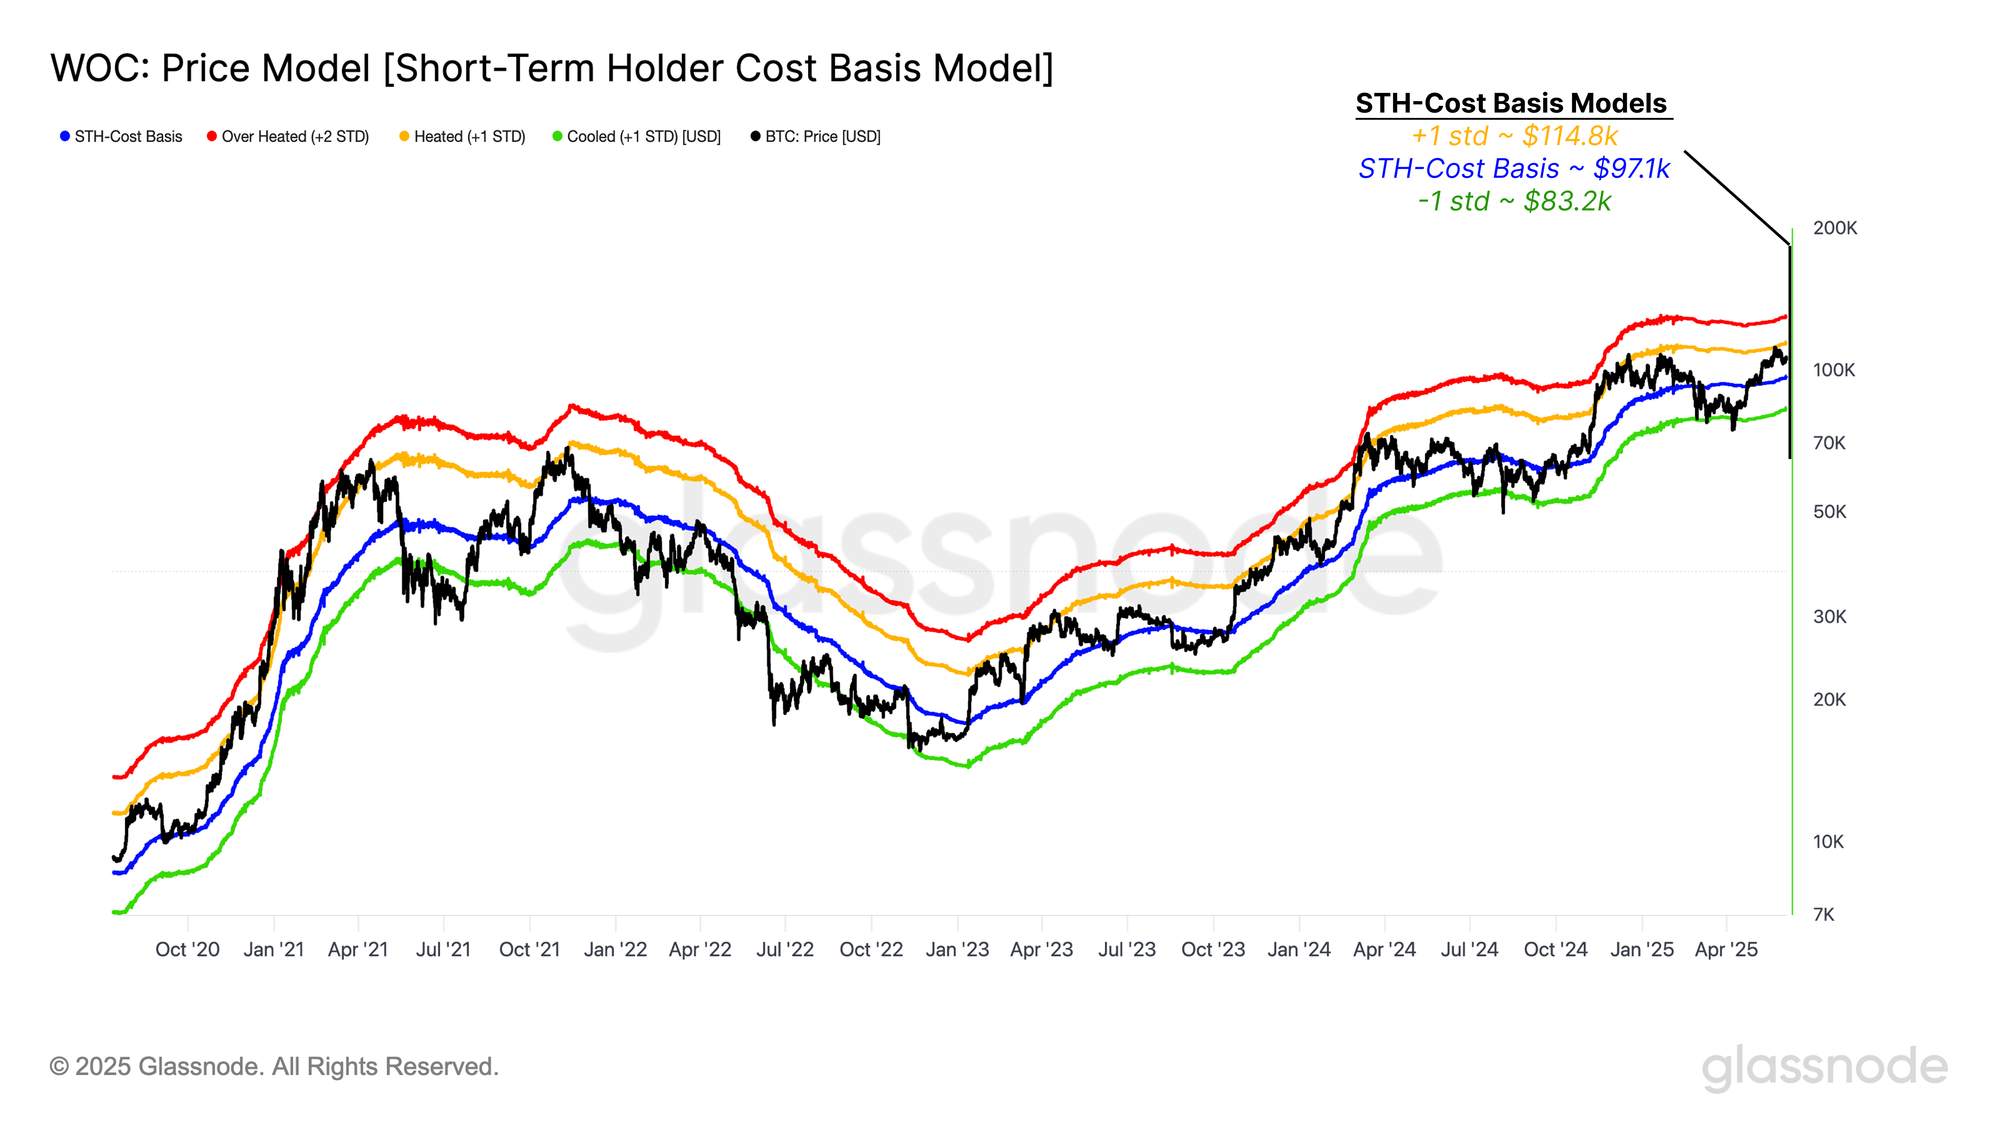
With a substantial portion of Bitcoin's supply changing hands over the past six months, driven by two separate pushes to new all-time highs, it becomes increasingly important to track recent investor behaviour. One of the most insightful models for this is the Short-Term Holder (STH) Cost Basis, which captures the average acquisition price of coins held for less than 155 days.

To add statistical context, we apply standard deviation bands around this cost basis to define key support and resistance zones. These bands help quantify the range of market consensus among short-term participants and can signal trend exhaustion or breakout thresholds.

Currently, the STH cost basis sits at $97.1k, representing the average entry price for recent buyers. The +1 standard deviation band, often associated with overbought or bullish breakout conditions, lies at $114.8k, while the -1 standard deviation band at $83.2k marks a level of elevated downside risk.

These three levels, $114.8k, $97.1k, and $83.2k, now define the statistical boundaries of short-term sentiment. A break above or below these thresholds will likely shape the next leg of market direction, signalling whether momentum is returning or fading.
Live Chart

A High Profit Realization

As Bitcoin retreats from its recent $111.8k high, much of the selling pressure appears to stem from intra-cycle seasoned holders, those who accumulated earlier in the rally and are now realizing substantial gains. In this phase, the profit realization regime is a key concept for evaluating the risk of demand exhaustion.

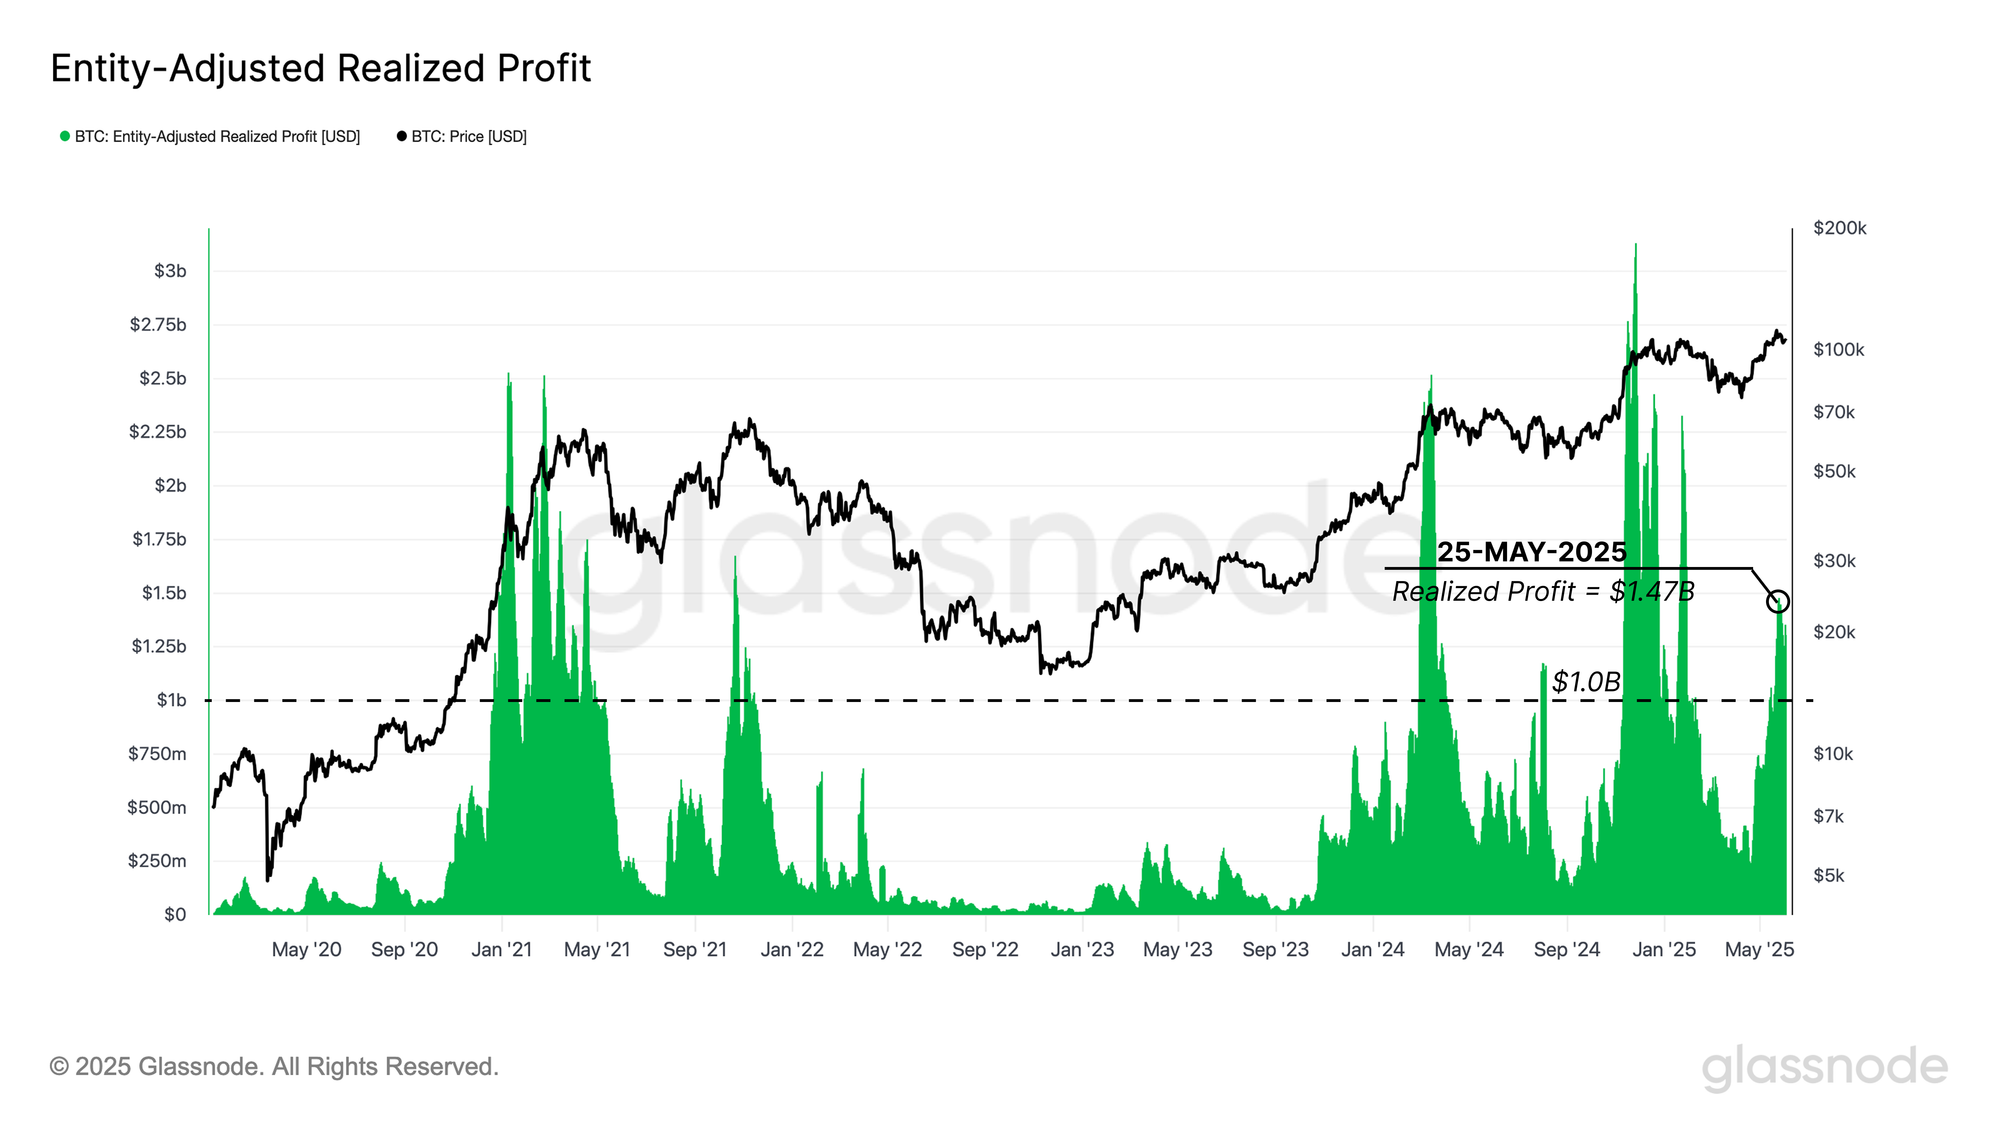
Using the 7-day SMA of daily profit realization, adjusted to exclude intra-entity flows, we see that realized profits peaked at $1.47B per day last week. This is a notable level, highlighting the intensity of recent capital rotation.

More importantly, this marks the fifth wave in this cycle where daily profit-taking has surpassed the $1B threshold. Such events often coincide with local market tops or slowdowns, especially if incoming demand cannot absorb the scale of realized gains. This puts a spotlight on the market’s resilience in the face of elevated selling pressure.
Live Chart

A Dynamic Shift

To better understand the significance of the current elevated wave of profit realization, it helps to view it through a cyclical lens. Not all profit-taking events are created equal, and the dynamic nature of these regimes can reveal how market maturity and volatility shape investor behaviour over time.

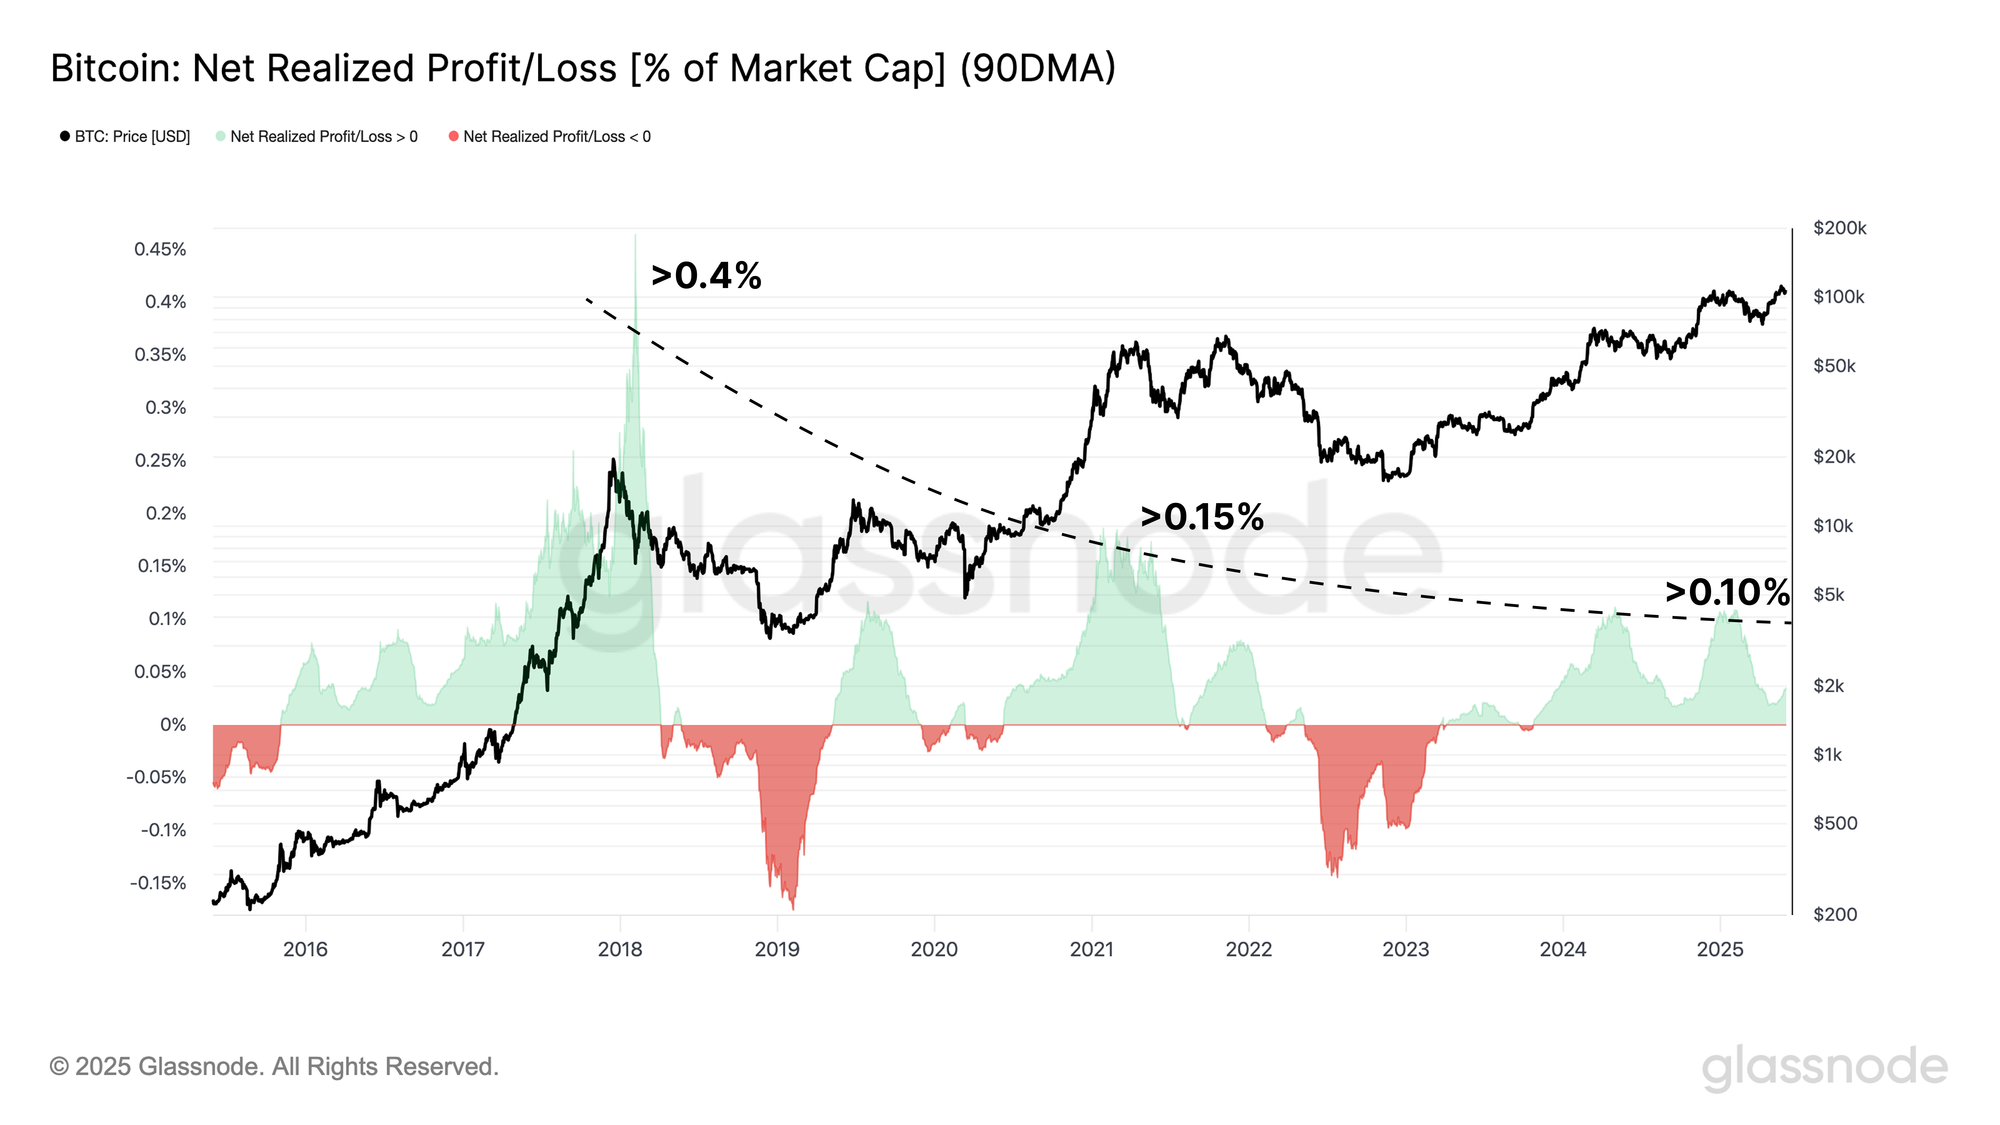
One effective approach is to examine the 90-day SMA of net realized profit, normalized by market cap. This adjustment allows us to compare profit-taking intensity across cycles on an apples-to-apples basis. A clear trend emerges: profit-taking has grown less euphoric over time, reflecting the broader degradation in cyclical upside performance and lower volatility profiles as the market matures.

  • From November 2015 to April 2018, the net profit-taking regime lasted ~25 months, peaking above 0.4% of market cap.
  • In the 2020–2022 cycle, this region persisted for ~20 months, but only peaked at around 0.15%.
  • In the current cycle, beginning November 2023, the net profit-taking phase has stretched across 18 months, forming two distinct peaks near 0.1%..

This trend suggests that while profit-taking still exerts significant pressure, it has become more tempered, possibly signalling a shift from boom-bust euphoria to structured capital rotation in a more mature asset class.
Live Chart

Who Is Realizing Profit?

Another useful lens for evaluating profit-taking cycles is to identify which investor cohorts are behind the selling.

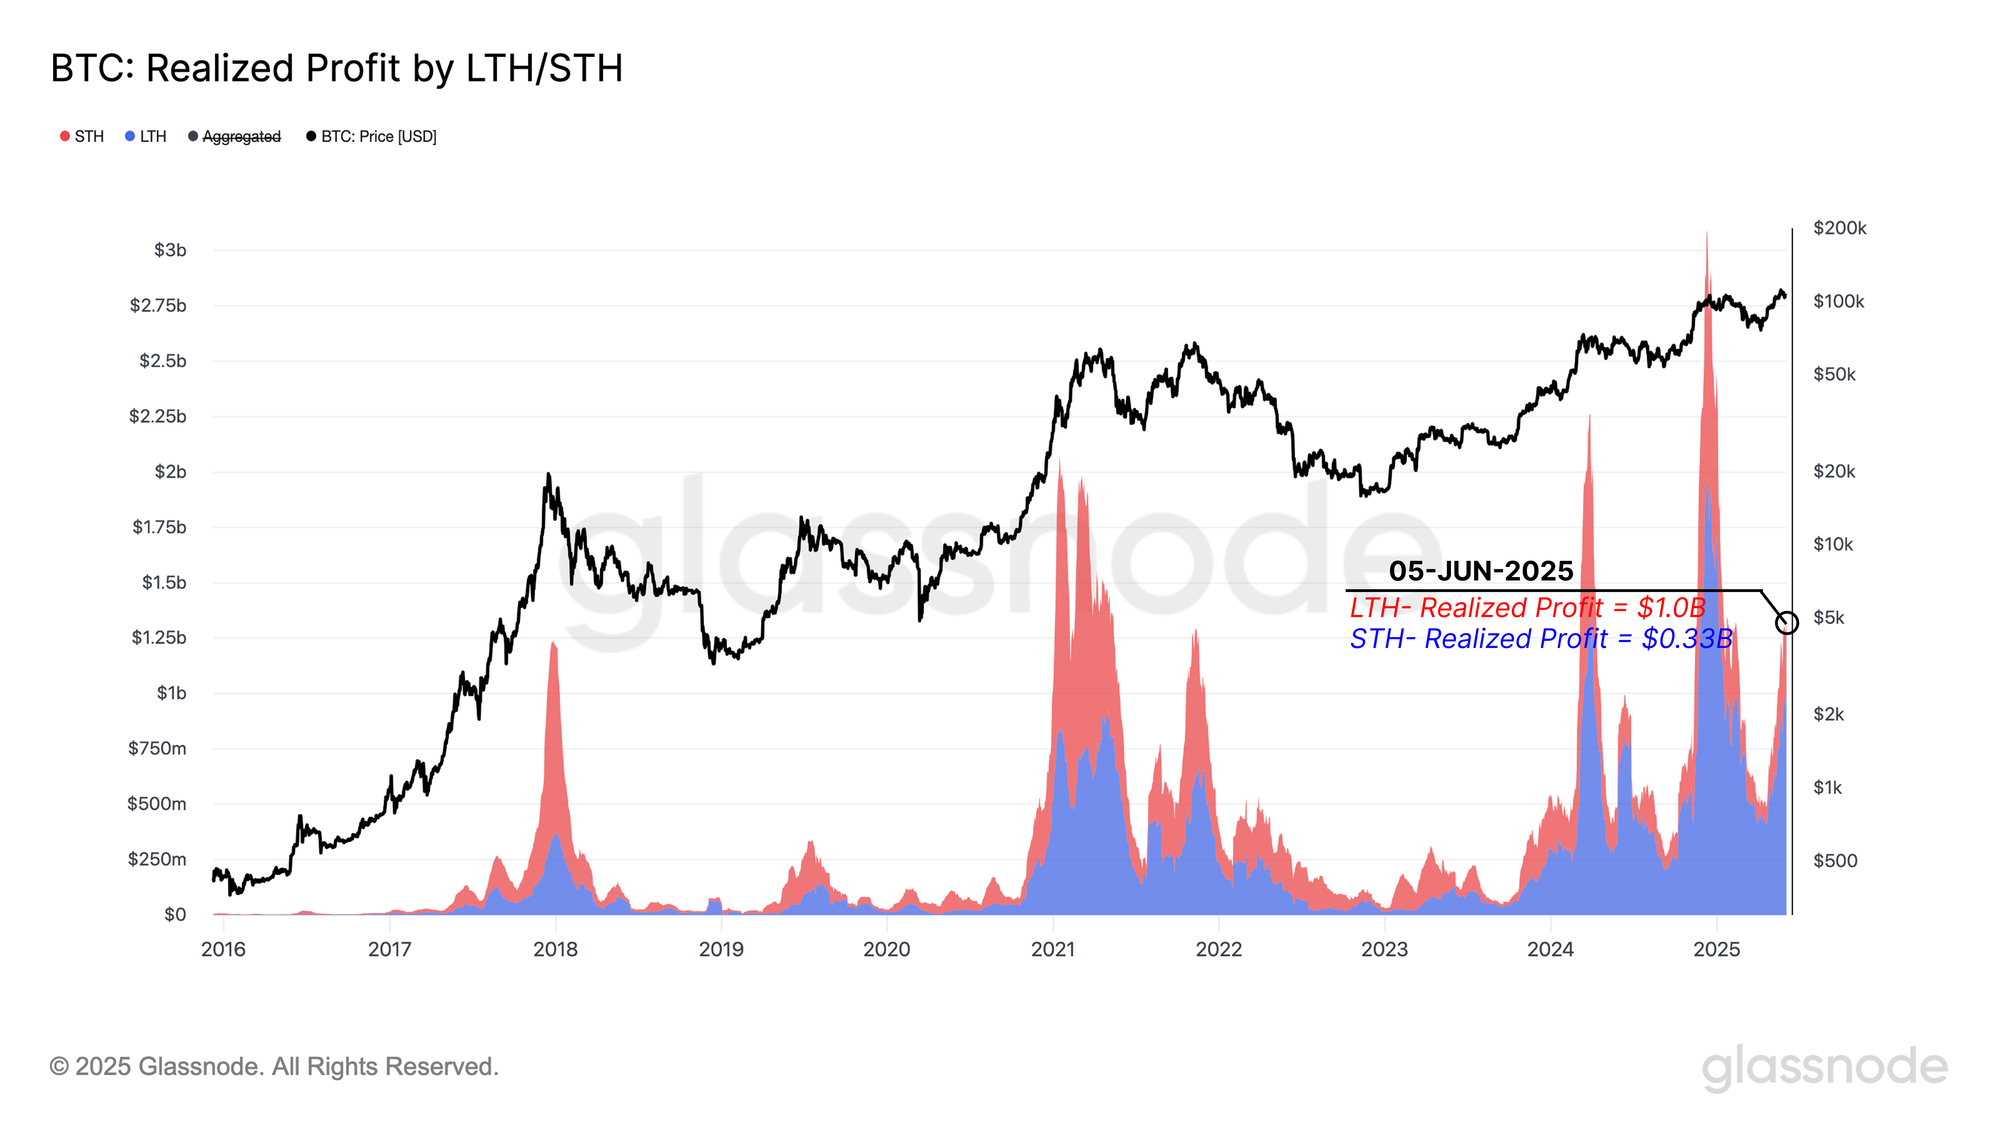
Since the 2015–2018 cycle, the share of realized profit attributed to long-term holders (LTHs) has steadily increased during euphoric market tops. This trend highlights a structural shift in market maturity, where more seasoned investors dominate capital rotation rather than fast-moving speculators.

At the most recent peak, the 30-day moving average of realized profit by LTHs surged to ~$1B per day, while short-term holders (STHs) realized just $0.32B per day. This marks a more than 3X difference, reinforcing that this wave of profit-taking is being led by older, higher-conviction investors.
Live Chart

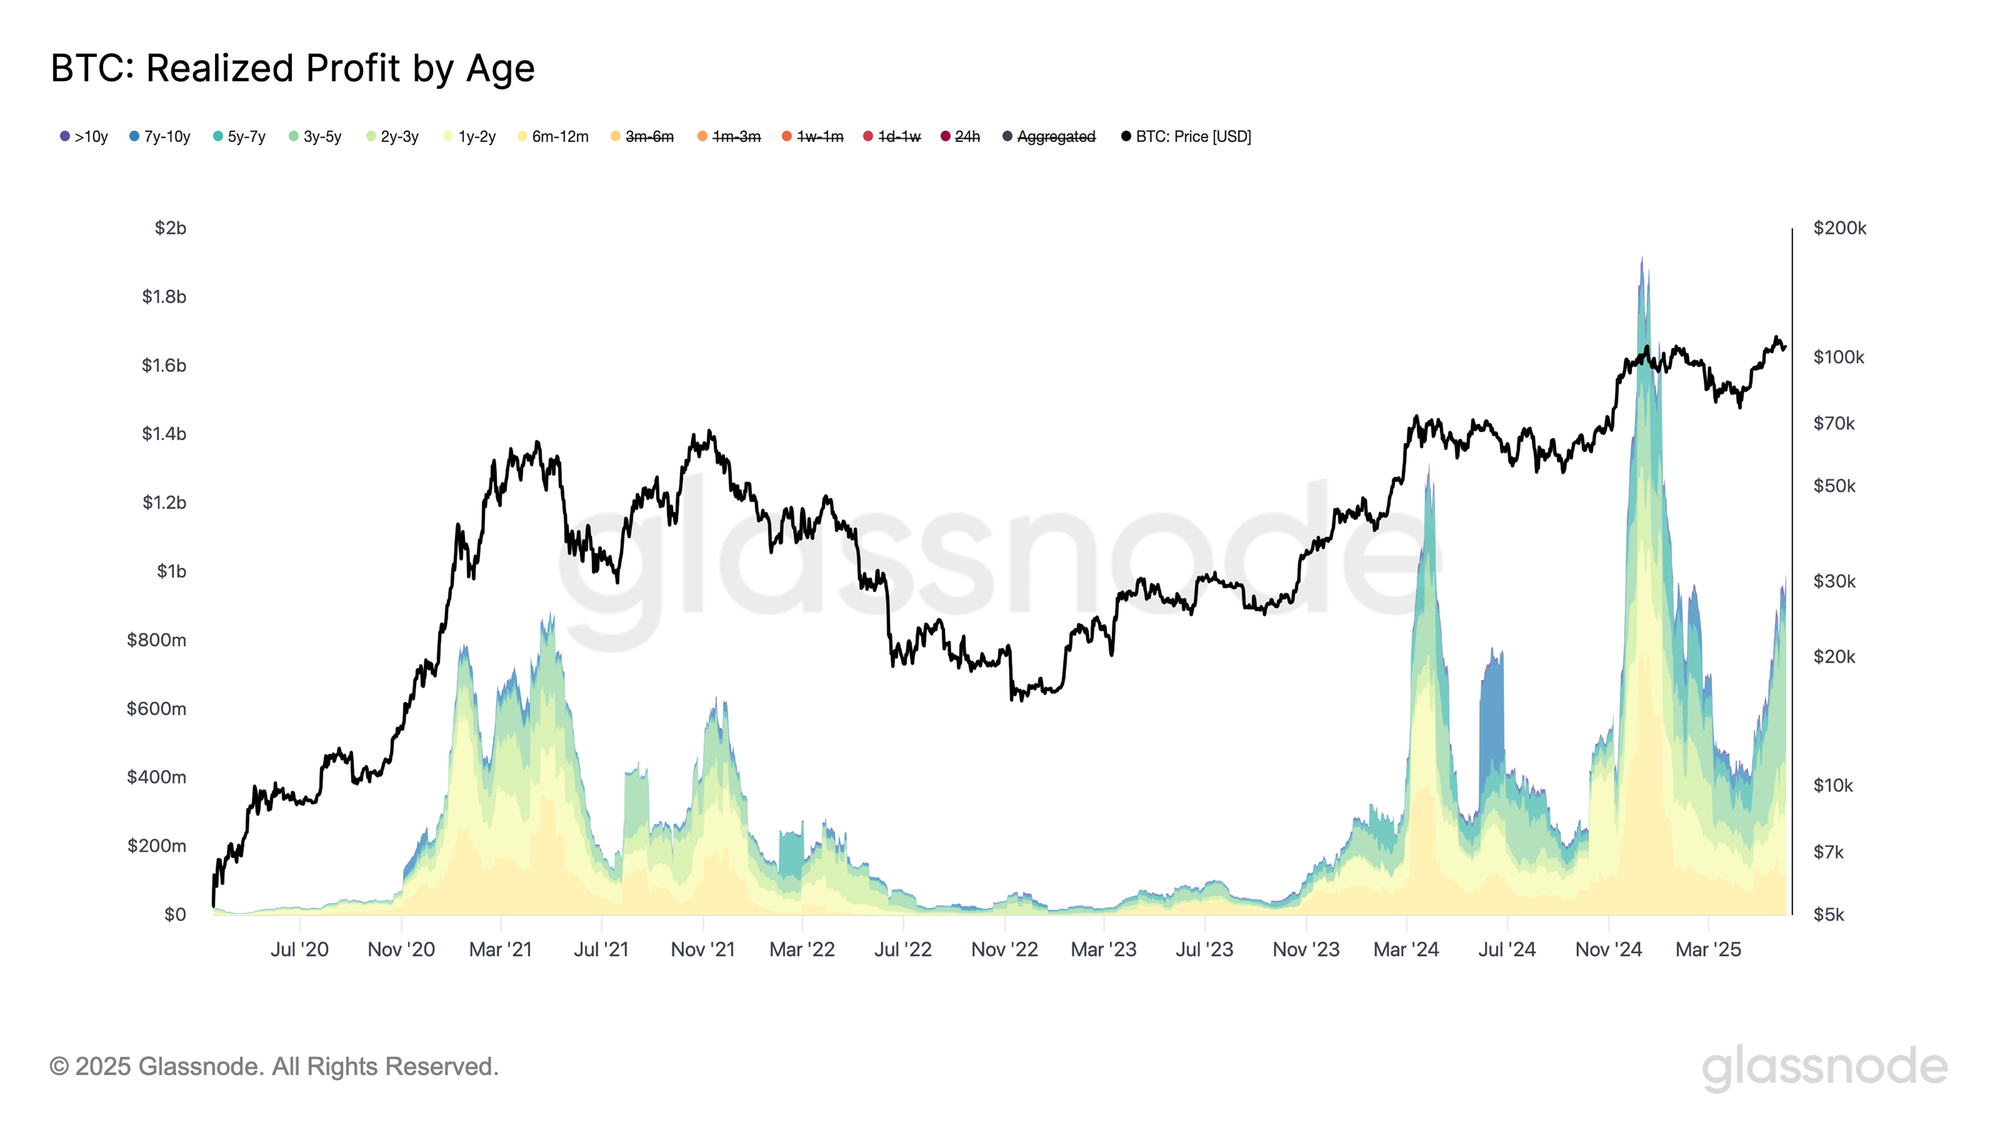
At first glance, the current ~$1B per day in realized profit by long-term holders (those holding >6 months) may seem modest compared to the $1.8B peak during the December 2024 top. However, a deeper breakdown reveals a familiar pattern.

Throughout bull markets, the 6–12 month holder cohort tends to contribute less to profit-taking as the cycle matures. This dynamic is playing out again in the current cycle. As the rally stretches, it's increasingly the older segments of long-term holders who are stepping in as dominant sellers, shaping what appears to be the top formation phase of this cycle.
Live Chart

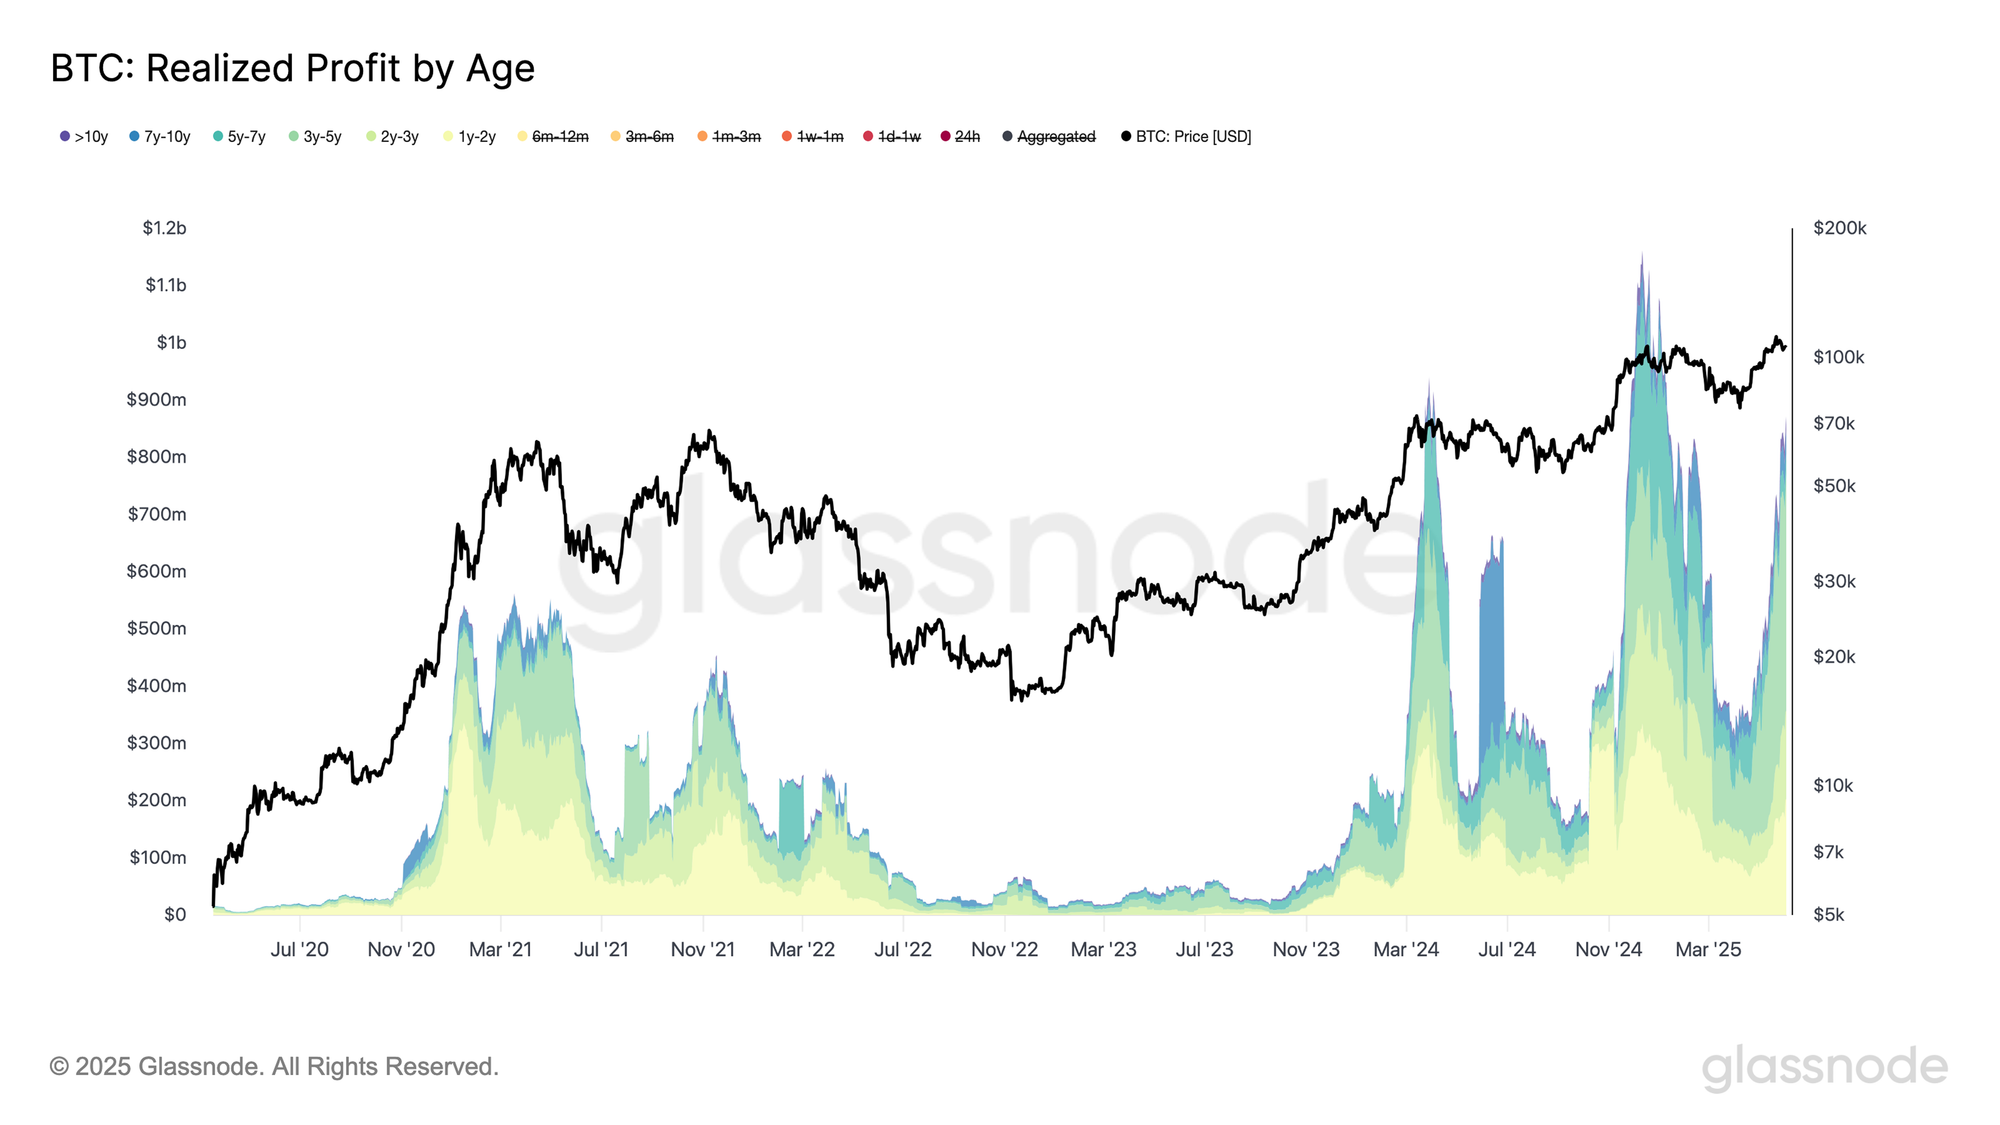
Therefore, by excluding the 6–12 month cohort from the total realized profit of long-term holders, we can better assess the true impact of seasoned investors on current market dynamics. This adjustment removes the influence of Q1 2025 top buyers, who have relatively limited unrealized gains, and focuses on those holding for over a year with deeper profit margins.

When isolating realized profit by >12-month holders, the significance of the current wave becomes more apparent. This cohort, often associated with conviction-driven investors, is now taking profits at scale, a behaviour that typically signals maturity or exhaustion in a bull trend.

This observation is in confluence with the earlier findings from the CBD Heatmap, which also pointed to older investors contributing most of the recent selling pressure, reinforcing the narrative that long-term holders are increasingly active in this top formation phase.
Live Chart

Conclusion

Bitcoin’s recent climb to a new all-time high of $111.8k has met growing resistance, as market data points to exhaustion from earlier buyers and profit-taking by long-standing holders. The CBD Heatmap shows that many of the strong accumulation zones from previous cycles have flipped into active selling regions, particularly among cohorts who bought in the >$25k and <$73k zones.

On-chain pricing models such as the Cost Basis Quantiles and Short-Term Holder statistical bands now define the immediate structure of the market. Key support levels at $103.7k and $95.6k will be critical to hold if demand falters, while the upper resistance band at $114.8k remains a test for renewed strength.

The profit realization regime is also showing signs of intensity, with daily profits peaking at $1.47B, primarily led by older long-term holders. This trend, along with the rising share of profit-taking from the >12-month cohort, suggests we may be witnessing a distribution phase rather than a fresh breakout.

Altogether, the market appears to be at a crossroads, shaped by elevated sell pressure, maturing bullish momentum, and demand that must prove itself resilient. The coming weeks will be crucial in determining whether this is a mid-cycle consolidation or the start of a broader top formation.


Disclaimer: This report does not provide any investment advice. All data is provided for informational, and educational purposes only. No investment decision shall be based on the information provided here and you are solely responsible for your own investment decisions.

Exchange balances presented are derived from Glassnode’s comprehensive database of address labels, which are amassed through both officially published exchange information and proprietary clustering algorithms. While we strive to ensure the utmost accuracy in representing exchange balances, it is important to note that these figures might not always encapsulate the entirety of an exchange’s reserves, particularly when exchanges refrain from disclosing their official addresses. We urge users to exercise caution and discretion when utilizing these metrics. Glassnode shall not be held responsible for any discrepancies or potential inaccuracies. 

Please read our Transparency Notice when using exchange data.


Trend Kriptolar

İlgili Okumalar

US Stocks Are at an Extremely Fragile Moment as Earnings Season Kicks Off

U.S. stocks are entering a high-stakes earnings season amidst what analysts describe as an "extremely fragile" market environment. While major indices show subdued volatility, underlying pressures from geopolitics, monetary policy expectations, and mixed credit market signals are building. UBS's proprietary "Turbu-lens" market fragility indicator has reached 0.9, its highest level since September 2025, historically a precursor to a sharp spike in the VIX volatility index. The risk is amplified by elevated earnings expectations. Analysts project robust profit growth for Q2—24% for the S&P 500 and 12% for the Stoxx 600—but recent upward revisions mean disappointment could trigger outsized market moves. Current low VIX levels are seen as misleading and temporary, with the earnings season likely to push volatility higher. Market internals reveal significant stress, with single-stock volatility exceeding index volatility by more than threefold. This divergence suggests a potential convergence that could drive a sharp rise in index-level volatility. Given likely continued sector rotation, UBS suggests single-stock options may offer better tactical hedging opportunities than broad index hedges. Further pressures stem from rising oil prices, which threaten to keep inflation and interest rate expectations elevated, and a cautious credit market where CDS spreads have not confirmed the equity rally's strength. For investors, UBS recommends focusing on pair-wise correlation trades to navigate expected stock-specific volatility, highlighting sectors like Tech, Energy, and Financials in the U.S. and Energy, Tech, and Consumer Discretionary in Europe.

marsbit51 dk önce

US Stocks Are at an Extremely Fragile Moment as Earnings Season Kicks Off

marsbit51 dk önce

İşlemler

Spot

Popüler Makaleler

BITCOIN Nedir

HarryPotterObamaSonic10Inu (ERC-20)'yu ve Kripto Alanındaki Yerini Anlamak Son yıllarda, kripto para piyasası, hem ticaret yapanların hem de topluluk etkileşimi ve eğlence değeri arayanların ilgisini çeken meme coin'lerin popülaritesinde bir artış gördü. Bu benzersiz token'lar arasında, kripto para dokusuna kültürel referansları harmanlayan ilginç bir proje olan HarryPotterObamaSonic10Inu (ERC-20) bulunmaktadır. Bu makale, HarryPotterObamaSonic10Inu'nun temel yönlerini, mekanizmalarını, topluluk odaklı ethosunu ve daha geniş kripto manzarasıyla etkileşimini incelemektedir. HarryPotterObamaSonic10Inu (ERC-20) Nedir? Adından da anlaşılacağı gibi, HarryPotterObamaSonic10Inu, Ethereum blok zinciri üzerinde inşa edilen bir meme coin'dir ve ERC-20 standardı altında sınıflandırılmaktadır. Geleneksel kripto paraların pratik kullanılabilirlik veya yatırım potansiyeline odaklandığı durumların aksine, bu token eğlence değeri ve topluluğunun gücü üzerine kuruludur. Proje, bağlı kullanıcıların bir araya gelebileceği, fikirlerini paylaşabileceği ve çeşitli kültürel fenomenlerden ilham alan etkinliklere katılabileceği bir ortam yaratmayı hedeflemektedir. HarryPotterObamaSonic10Inu'nun dikkate değer özelliklerinden biri işlemlerde sıfır vergi olmasıdır. Bu çekici unsur, küçük ölçekli yatırımcıları caydırabilecek ek ücretlerden yoksun olarak ticareti ve topluluk katılımını teşvik etmeyi amaçlamaktadır. Coin'in toplam arzı bir milyar token olarak belirlenmiştir; bu, topluluk içinde önemli bir dolaşım sağlama niyetini göstermektedir. HarryPotterObamaSonic10Inu (ERC-20) Yaratıcısı HarryPotterObamaSonic10Inu'nun kökenleri bir miktar gizemlidir; yaratıcısı hakkında spesifik bilgilerin ne olduğu bilinmemektedir. Bu token'ın geliştirilmesi, belirli bir ekip veya açık bir plan eksikliği ile gerçekleşmiştir; bu durum, meme coin sektöründe oldukça yaygındır. Proje, topluluğunun heyecanı ve katılımına dayalı olarak organik bir şekilde ortaya çıkmıştır. HarryPotterObamaSonic10Inu (ERC-20) Yatırımcıları Dış yatırımlar ve destekler söz konusu olduğunda, HarryPotterObamaSonic10Inu da belirsiz kalmaktadır. Token, bilinen herhangi bir yatırım fonunu veya önemli bir kurumsal desteği listelememektedir. Bunun yerine, projenin can damarı, kolektif eylem ve kripto alanındaki katılım yoluyla büyüme ve sürdürülebilirlik sağlayan temel topluluğudur. HarryPotterObamaSonic10Inu (ERC-20) Nasıl Çalışır? Bir meme coin olarak, HarryPotterObamaSonic10Inu, genellikle varlık değerini yöneten geleneksel çerçevelerin dışında çalışmaktadır. Projenin nasıl çalıştığını tanımlayan birkaç özelliği vardır: Sıfır Vergi İşlemleri: İşlemlerde vergi ücreti olmadan, kullanıcılar gizli maliyet endişesi olmadan token'ı serbestçe alıp satabilirler. Topluluk Etkileşimi: Proje, topluluk etkileşimi üzerine kuruludur ve sosyal medya platformlarını kullanarak heyecan yaratarak katılımı kolaylaştırır. Tartışmalar, içerik paylaşımı ve katılım, projenin erişimini genişletmeye ve destekleyiciler arasında sadakat oluşturmaya yardımcı olan kritik unsurlardır. Pratik Kullanılabilirlik Yok: HarryPotterObamaSonic10Inu'nun mali ekosistem içinde somut bir kullanılabilirlik sunmadığı belirtilmelidir. Daha ziyade, eğlence ve topluluk etkinlikleri için bir token olarak sınıflandırılmaktadır. Kültürel Referans: Token, popüler kültürden unsurları zekice harmanlayarak ilgi çekmektedir ve hem meme meraklıları hem de kripto takipçileriyle bağlantı kurmaktadır. HarryPotterObamaSonic10Inu, meme coin'lerin, daha geleneksel kripto para projelerinden nasıl farklı çalıştığını örneklendirmektedir; bu projeler, utilitarist varlıklar yerine yenilikçi sosyal yapıların bir parçası olarak piyasaya girmektedir. HarryPotterObamaSonic10Inu (ERC-20) Zaman Çizelgesi HarryPotterObamaSonic10Inu'nun tarihi, birkaç dikkate değer kilometre taşı ile işaretlenmiştir: Oluşum: Token, birçok kripto meraklısının hayal gücünü yakalayan bir viral meme'den ortaya çıkmıştır. Spesifik yaratım tarihleri mevcut değildir ve bu onun organik yükselişini vurgulamaktadır. Borsa Listelemeleri: HarryPotterObamaSonic10Inu, topluluğun daha kolay erişim ve ticaret yapabilmesini sağlamak için çeşitli borsalarda yer bulmuştur. Topluluk Katılım İnisiyatifleri: Yarışmalar, sosyal medya kampanyaları ve hayranlar ile destekçilerden içerik üretimini içeren topluluk etkileşimini artırmayı amaçlayan devam eden etkinlikler. Gelecek Genişleme Planları: Projenin yol haritası, kültürel temalarına ilişkin bir NFT koleksiyonu, ticari ürünler ve bir e-ticaret sitesi başlatılmasını içermektedir; bu da topluluğun daha fazla katılımını sağlamayı ve ekosistemine daha fazla boyut kazandırmayı hedeflemektedir. HarryPotterObamaSonic10Inu (ERC-20) Hakkında Kilit Noktalar Topluluk Odaklı Doğası: Proje, kullanıcı katılımını geliştirme önceliği taşır ve böylece kullanıcıların sürecin en önünde yer almasını sağlar. Meme Coin Sınıflandırması: Eğlenceye dayalı kripto paranın doruk noktasıdır ve geleneksel yatırım araçlarından ayrılmaktadır. Bitcoin ile Doğrudan İlişki Yok: Ticker ismindeki benzeliğe rağmen, HarryPotterObamaSonic10Inu ayırt edicidir ve Bitcoin veya diğer yerleşik kripto paralarla herhangi bir ilişkisi yoktur. İşbirliğine Odaklanma: HarryPotterObamaSonic10Inu, sahipleri arasında işbirliği ve hikaye paylaşımı için bir alan oluşturmak üzere tasarlanmıştır ve bu da yaratıcılık ve topluluk bağlarını sağlamaktadır. Gelecek Beklentileri: Başlangıçta belirlendiği temalardan NFTs ve ticari ürünlere genişleme arzusu, projenin dijital kültürde daha ana akıma girebilmesi için bir yol haritası çizmektedir. Meme coin'ler, kripto para topluluğunun hayal gücünü çalmaya devam ederken, HarryPotterObamaSonic10Inu (ERC-20), kültürel bağları ve topluluk merkezli yaklaşımıyla öne çıkmaktadır. Geleneksel bir hizmet odaklı token modeliyle uyumlu olmasa da, özünde destekçileri arasında sağlanan neşe ve dostluğu vurgulayarak, giderek dijitalleşen bir çağda kripto paraların evrilen doğasını göstermektedir. Proje gelişmeye devam ettikçe, topluluk dinamiklerinin blockchain teknolojisi dünyasındaki seyrini nasıl etkilediğini izlemek önemli olacaktır.

2.1k Toplam GörüntülenmeYayınlanma 2024.04.01Güncellenme 2024.12.03

BITCOIN Nedir

BTC Nasıl Satın Alınır

HTX.com’a hoş geldiniz! Bitcoin (BTC) satın alma işlemlerini basit ve kullanışlı bir hâle getirdik. Adım adım açıkladığımız rehberimizi takip ederek kripto yolculuğunuza başlayın. 1. Adım: HTX Hesabınızı OluşturunHTX'te ücretsiz bir hesap açmak için e-posta adresinizi veya telefon numaranızı kullanın. Sorunsuzca kaydolun ve tüm özelliklerin kilidini açın. Hesabımı Aç2. Adım: Kripto Satın Al Bölümüne Gidin ve Ödeme Yönteminizi SeçinKredi/Banka Kartı: Visa veya Mastercard'ınızı kullanarak anında Bitcoin (BTC) satın alın.Bakiye: Sorunsuz bir şekilde işlem yapmak için HTX hesap bakiyenizdeki fonları kullanın.Üçüncü Taraflar: Kullanımı kolaylaştırmak için Google Pay ve Apple Pay gibi popüler ödeme yöntemlerini ekledik.P2P: HTX'teki diğer kullanıcılarla doğrudan işlem yapın.Borsa Dışı (OTC): Yatırımcılar için kişiye özel hizmetler ve rekabetçi döviz kurları sunuyoruz.3. Adım: Bitcoin (BTC) Varlıklarınızı SaklayınBitcoin (BTC) satın aldıktan sonra HTX hesabınızda saklayın. Alternatif olarak, blok zinciri transferi yoluyla başka bir yere gönderebilir veya diğer kripto para birimlerini takas etmek için kullanabilirsiniz.4. Adım: Bitcoin (BTC) Varlıklarınızla İşlem YapınHTX'in spot piyasasında Bitcoin (BTC) ile kolayca işlemler yapın.Hesabınıza erişin, işlem çiftinizi seçin, işlemlerinizi gerçekleştirin ve gerçek zamanlı olarak izleyin. Hem yeni başlayanlar hem de deneyimli yatırımcılar için kullanıcı dostu bir deneyim sunuyoruz.

8.0k Toplam GörüntülenmeYayınlanma 2024.12.12Güncellenme 2026.06.02

BTC Nasıl Satın Alınır

$BITCOIN Nedir

DİJİTAL ALTIN ($BITCOIN): Kapsamlı Bir Analiz DİJİTAL ALTIN ($BITCOIN) Tanıtımı DİJİTAL ALTIN ($BITCOIN), geleneksel değerli metallerin özelliklerini merkeziyetsiz teknolojilerin yeniliği ile birleştirmeyi amaçlayan Solana ağı üzerinde çalışan blockchain tabanlı bir projedir. Bitcoin ile aynı isme sahip olmasına rağmen, genellikle bir değer saklama aracı olarak algılandığı için “dijital altın” olarak anılmaktadır; DİJİTAL ALTIN, Web3 ortamında benzersiz bir ekosistem yaratmak için tasarlanmış ayrı bir tokendir. Hedefi, uygulanabilir bir alternatif dijital varlık olarak kendini konumlandırmaktır, ancak uygulamaları ve işlevleri ile ilgili ayrıntılar hala gelişmektedir. DİJİTAL ALTIN ($BITCOIN) Nedir? DİJİTAL ALTIN ($BITCOIN), Solana blockchain'inde kullanılmak üzere açıkça tasarlanmış bir kripto para tokenidir. Bitcoin'in yaygın olarak tanınan bir değer saklama rolü sağlamasının aksine, bu token daha geniş uygulamalara ve özelliklere odaklanıyor gibi görünmektedir. Dikkate değer yönler şunlardır: Blockchain Altyapısı: Token, yüksek hızlı ve düşük maliyetli işlemleri yönetme kapasitesi ile bilinen Solana blockchain'inde inşa edilmiştir. Arz Dinamikleri: DİJİTAL ALTIN'ın maksimum arzı 100 katrilyon token (100P $BITCOIN) ile sınırlıdır, ancak dolaşımdaki arzı ile ilgili ayrıntılar şu anda açıklanmamıştır. Kullanım Alanı: Kesin işlevler açıkça belirtilmemiş olsa da, token'ın merkeziyetsiz uygulamalar (dApps) veya varlık tokenizasyon stratejileri ile ilgili çeşitli uygulamalar için kullanılabileceğine dair işaretler bulunmaktadır. DİJİTAL ALTIN ($BITCOIN) Yaratıcısı Kimdir? Şu anda, DİJİTAL ALTIN ($BITCOIN) arkasındaki yaratıcıların ve geliştirme ekibinin kimliği bilinmemektedir. Bu durum, merkeziyetsiz finans ve meme coin fenomenleriyle uyumlu olan birçok yenilikçi proje arasında yaygındır. Böyle bir anonimlik, topluluk odaklı bir kültürü teşvik edebilirken, yönetişim ve hesap verebilirlik konusundaki endişeleri artırmaktadır. DİJİTAL ALTIN ($BITCOIN) Yatırımcıları Kimlerdir? Mevcut bilgiler, DİJİTAL ALTIN ($BITCOIN) için bilinen herhangi bir kurumsal destekçi veya önde gelen risk sermayesi yatırımı olmadığını göstermektedir. Proje, geleneksel finansman yolları yerine topluluk desteği ve benimsemeye odaklanan bir eşler arası modelde çalışıyor gibi görünmektedir. Faaliyetleri ve likiditesi esas olarak PumpSwap gibi merkeziyetsiz borsalarda (DEX'ler) yer almakta olup, bu da onun taban hareketine vurgu yapmaktadır. DİJİTAL ALTIN ($BITCOIN) Nasıl Çalışır DİJİTAL ALTIN ($BITCOIN) 'ın operasyonel mekanikleri, blockchain tasarımı ve ağ özellikleri temelinde açıklanabilir: Konsensüs Mekanizması: Solana'nın benzersiz tarih kanıtı (PoH) ile bir hisse kanıtı (PoS) modelini birleştirerek, proje ağın yüksek performansına katkıda bulunan verimli işlem doğrulamasını sağlar. Tokenomik: Belirli deflasyonist mekanizmalar kapsamlı bir şekilde detaylandırılmamış olsa da, geniş maksimum token arzı, henüz tanımlanmamış mikro işlemler veya niş kullanım durumlarına hitap edebileceğini ima etmektedir. Etkileşim: Solana'nın daha geniş ekosistemi ile entegrasyon potansiyeli bulunmaktadır; bu, çeşitli merkeziyetsiz finans (DeFi) platformlarını içermektedir. Ancak, belirli entegrasyonlarla ilgili ayrıntılar belirtilmemiştir. Önemli Olayların Zaman Çizelgesi DİJİTAL ALTIN ($BITCOIN) ile ilgili önemli kilometre taşlarını vurgulayan bir zaman çizelgesi: 2023: Token'ın Solana blockchain'inde ilk dağıtımı, sözleşme adresi ile işaretlenmiştir. 2024: DİJİTAL ALTIN, PumpSwap gibi merkeziyetsiz borsalarda işlem görmeye başladıkça görünürlük kazanır ve kullanıcıların bunu SOL karşısında ticaret yapmasına olanak tanır. 2025: Proje, topluluk odaklı etkileşimlere yönelik potansiyel ilgi ve ara sıra ticaret faaliyetleri görür, ancak şu ana kadar dikkate değer ortaklıklar veya teknik ilerlemeler belgelenmemiştir. Kritik Analiz Güçlü Yönler Ölçeklenebilirlik: Temel Solana altyapısı, yüksek işlem hacimlerini destekleyerek $BITCOIN'in çeşitli işlem senaryolarındaki faydasını artırabilir. Erişilebilirlik: Token başına potansiyel düşük ticaret fiyatı, perakende yatırımcıları çekebilir ve parçalı mülkiyet fırsatları sayesinde daha geniş katılımı kolaylaştırabilir. Riskler Şeffaflık Eksikliği: Kamuya açık olarak bilinen destekçilerin, geliştiricilerin veya bir denetim sürecinin olmaması, projenin sürdürülebilirliği ve güvenilirliği konusunda şüpheler doğurabilir. Piyasa Volatilitesi: Ticaret faaliyeti büyük ölçüde spekülatif davranışa dayanmakta olup, bu da yatırımcılar için önemli fiyat dalgalanmalarına ve belirsizliklere yol açabilir. Sonuç DİJİTAL ALTIN ($BITCOIN), hızla gelişen Solana ekosisteminde ilginç ama belirsiz bir proje olarak ortaya çıkmaktadır. “Dijital altın” anlatısını kullanmaya çalışırken, Bitcoin'in değer saklama rolünden ayrılması, amaçlanan faydasının ve yönetişim yapısının daha net bir şekilde tanımlanması gerekliliğini vurgulamaktadır. Gelecekteki kabul ve benimseme, mevcut belirsizliklerin giderilmesine ve operasyonel ile ekonomik stratejilerinin daha açık bir şekilde tanımlanmasına bağlı olacaktır. Not: Bu rapor, Ekim 2023 itibarıyla mevcut olan sentezlenmiş bilgileri kapsamaktadır ve araştırma döneminin ötesinde gelişmeler yaşanmış olabilir.

170 Toplam GörüntülenmeYayınlanma 2025.05.13Güncellenme 2025.05.13

$BITCOIN Nedir

Tartışmalar

HTX Topluluğuna hoş geldiniz. Burada, en son platform gelişmeleri hakkında bilgi sahibi olabilir ve profesyonel piyasa görüşlerine erişebilirsiniz. Kullanıcıların BTC (BTC) fiyatı hakkındaki görüşleri aşağıda sunulmaktadır.

活动图片